Solid-state lighting: Failure analysis of white LEDs N. Narendran, Y. Gu, J.P. Freyssinier, H. Yu, and L. Deng Lighting Research Center Rensselaer Polytechnic Institute, Troy, NY 12180 www.lrc.rpi.edu Narendran, N., Y. Gu, J.P. Freyssinier, H. Yu, and L. Deng. 2004. Solid-state lighting: Failure analysis of white LEDs. Journal of Crystal Growth 268 (3-4): 449-456.
Copyright 2004 Elsevier B.V. A pre-print of this paper is being distributed electronically with permission from Elsevier B.V. One print or electronic copy may be made for personal use only. Systematic or multiple reproduction, distribution to multiple locations via electronic or other means, duplication of any material in this paper for a fee or for commercial purposes, or modification of the content of the paper are prohibited under United States and international laws.
Solid-State Lighting: Failure Analysis of White LEDs N. Narendran *, Y. Gu, J.P. Freyssinier, H. Yu, and L. Deng Lighting Research Center, Rensselaer Polytechnic Institute, 21 Union Street, Troy, NY 12180. U.S.A. * Corresponding author. email:
[email protected] tel: 518-687-7176 fax: 518-687-7120
Abstract Long life, on the order of 50,000 to 100,000 hours, is one of the key features of lightemitting diodes (LEDs) that has attracted the lighting community to this technology. White LEDs have yet to demonstrate this capability. The goal of the study described in this manuscript was to understand what affects the long-term performance of white LEDs. Different types of LEDs have different degradation mechanisms. As a starting point, this study considered a commonly available commercial package, the 5 mm epoxyencapsulated phosphor-converted (YAG:Ce) white LED. Based on past studies, it was hypothesized that junction heat and the amount of short-wavelength emission would influence the degradation rate of 5 mm type white LEDs, mainly due to yellowing of the epoxy encapsulant. Two groups of white LEDs were life-tested. The LEDs in one group had similar junction temperatures but different amplitudes for the short-wavelength radiation, and the LEDs in the second group had similar amplitudes for the shortwavelength radiation but different junction temperatures. Experimental results showed that the degradation rate depends on both the junction temperature and the amplitude of short1
wavelength radiation. However, the temperature effect was much greater than the shortwavelength amplitude effect. Furthermore, the phosphor medium surrounding the die behaves like a lambertian scatterer. As a result, some portion of the light circulates between the phosphor layer and the reflector cup, potentially increasing the epoxyyellowing issue. To validate this theory, a second experiment was conducted with LEDs that had the phosphor layer both close to the die and further away. The results showed that the LEDs with the phosphor layer away from the die degraded at a slower rate.
PACS: 85.60.Jb; 85.60.-q; 85.60.Bt Keywords: A1. Degradation; A1. Reliability; B1. Nitrides; B2. Semiconducting materials; B3. Light emitting diodes; B3. White LEDs
1. Introduction Since the first demonstration of the high-brightness blue light-emitting diode (LED) and subsequently the white LED, the interest in using solid-state light sources for general illumination has been rapidly growing [1, 2]. Presently, many manufacturers around the world are producing white LEDs. One of the most common methods for producing white light with LEDs is to use a cerium doped yttrium aluminum garnet (YAG:Ce) phosphor with a gallium nitride (GaN) based blue LED. Typically, the phosphor is embedded inside 2
an epoxy resin that surrounds the LED die. Some portion of the short-wavelength radiation emitted by the GaN LED is down-converted by the phosphor, and the combined light is perceived as white by the human visual system.
Long life, on the order of 50,000 to 100,000 hours, is one of the key features of LEDs that has attracted the lighting community to this technology. White LEDs have yet to demonstrate this capability. Early devices that took the form of indicator-style packages, 5 mm and surface mount devices (SMD), degraded very rapidly and reached a 50% light output level within 10,000 hours, even at drive currents recommended by their manufacturers [3, 4]. However, some of the recent white LED packages that were designed specifically for illumination applications exhibit slower degradation rates than the indicator devices [4, 5, 6, 7, 8]. The goal of the study presented here is to understand what affects the long-term performance of white LEDs.
LEDs rarely fail catastrophically; instead, their light output degrades slowly over time. The cause of slow light output degradation was investigated in this study. Different types of LEDs have different degradation mechanisms, and thus different light output degradation rates. As a starting point, this study considered the 5 mm epoxy-encapsulated phosphor-converted (YAG:Ce) white LED. Although many studies have investigated the 3
degradation of InGaN-type LEDs, very few studies have analyzed the degradation of packaged white LEDs [9, 10, 11, 12]. According to the few that have studied the packaged devices (blue and white LEDs), the primary reason cited for the rapid degradation of light output is the yellowing of the epoxy encapsulant [3, 13, 14, 15]. Excessive heat at the p-n junction is pointed to as the main cause of epoxy yellowing [13, 14]. Ambient temperature and the ohmic heating at the bandgap add up to create the heat at the LED junction.
Polymeric materials and epoxies also yellow over time due to photodegradation. This topic has been studied extensively by many polymer chemists. Although ultraviolet (UV) radiation with wavelengths less than 300 nm has the strongest effect on the yellowing of polymer materials in photodegradation, it has been shown that even visible light in the range of 400 nm to 500 nm induces photodegradation [16]. The amount of photodegradation depends on the amount of radiation and time of exposure. Therefore, even visible light of sufficient quantity can cause polymer and epoxy materials to degrade [17].
Another observation made from past studies is that the 5 mm type phosphor-converted white LED degrades faster than the similar type of blue LED [4]. If heat and the amount of short-wavelength radiation were the only reasons for the yellowing of the epoxy, then the 4
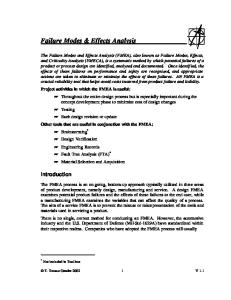
blue LED should degrade faster than the white LED because the total amount of shortwavelength radiation would be much higher for the blue LED compared with the white LED at the same drive current. The main difference between a 5 mm type blue and a similar white LED is the phosphor that is mixed in with the epoxy. Therefore, the presence of phosphor could be a reason for the excess degradation. An obvious question then is: Is the phosphor degrading? If the YAG:Ce phosphor were degrading, then the energy emitted by the phosphor should decrease with respect to the exciting short-wavelength emission. This in turn would result in a chromaticity shift toward blue as a function of time. However, literature shows that for 5 mm white LEDs, the chromaticity of the white light as a function of time shifts toward yellow rather than blue [3]. Furthermore, YAG:Ce phosphors are considered very stable and do not degrade easily [7]. Therefore, phosphor degradation is an unlikely scenario. A possible explanation for the additional degradation of white LEDs is that the phosphor particles mixed into the epoxy emit light isotropically and also scatter the unconverted short-wavelength light, as illustrated in Fig. 1. Therefore, at any given time only a fraction of the light will travel outward from the phosphor layer; the balance is redirected toward the phosphor layer, the reflector cup, or the die. Since the radiant energy travels through the epoxy region of the white LED more often than in the blue LED, the epoxy would yellow more.
5
Based on past studies, the authors of this manuscript hypothesized that the light output degradation of white LEDs caused by the yellowing of the epoxy depends on three factors: the heat at the p-n junction, the amount of short-wavelength radiation, and the location of the phosphor layer. By placing the phosphor layer far from the die, light is more likely to escape the device rather than being trapped where it will cause excessive yellowing of the epoxy.
2. Experiment Two laboratory experiments were conducted to verify the above mentioned hypotheses. The first experiment investigated the effects of junction temperature and short-wavelength emission on the degradation rate of white LEDs, and the second experiment studied the effect of placing the phosphor layer away from the die and the epoxy surrounding it.
2.1 Experiment 1 The goal of the first experiment was to investigate the relative effects of junction temperature and short-wavelength emission on the degradation rate of white LEDs. Two groups of white LEDs were life-tested. The LEDs in one group had similar junction temperatures but produced different amounts of short-wavelength radiation, and the LEDs
6
in the second group produced similar amounts of short-wavelength radiation but different junction temperatures.
The LEDs were tested in specially designed life-test chambers that had two functions: one, to keep the ambient temperature constant, and two, to act as light-integrating boxes to enable light output measurements [5]. Fig. 2 illustrates the experimental setup. Several life-test chambers were built and placed inside a temperature-controlled room.
The chambers measured 23 cm on each side. The interior of the chamber was painted matte white. A 2.5 cm diameter round aperture was cut into the front panel of each chamber and was fitted with a transparent acrylic window to enable spectral measurements. These apertures were covered with black fabric during the life test to keep external light from entering the box. Each chamber contained one LED array mounted at the center of the inside top surface. A photodiode that continuously measured the light output was attached to the center of the left panel, which had a small white baffle that blocked the direct light so that only the reflected light reached the photodiode. A resistance temperature detector (RTD) placed on top of the baffle, which was also located at the midpoint in the vertical direction, measured the ambient temperature within the chamber and controlled the heater through the temperature controller (T-CTL). This 7
ensured that the temperature inside the box remained within + 1oC. The heater was attached to a raised aluminum plate with a matte-white cover that sat on the bottom of the chamber. To estimate the LED junction temperature, a thin wire thermocouple (TC, Jtype) was soldered to the cathode pin of one LED in the array. Junction temperature of the LED was estimated from the cathode pin temperature, the power dissipated at the p-n junction, and the thermal resistance coefficient of the white LEDs [18]. For each chamber, an external LED driver controlled the current flow through the LEDs. A halogen light source placed inside the top left of each chamber was used to calibrate the chamber at regular intervals throughout the life test to ensure that the light output degradation was only from the LEDs and not due to degrading paint inside the box. Outside the chambers, two sensors measured the ambient temperature of the laboratory. A multimeter measured the input current and voltage of each LED. A computer-controlled data acquisition system gathered six channels of information (light output, board temperature, voltage, current, power, and power factor) every hour for each box.
Fifty-four white LEDs (Nichia NLPB-500) were selected from the same batch, acquired in April 2003. Six LEDs with the same peak wavelength for the short-wavelength emission (around 462 nm) were connected in series to form an array. Altogether, nine LED arrays
8
were constructed and each had its own life-test chamber. The operating conditions of the nine arrays are shown in Table 1.
As mentioned earlier, the arrays were divided into two groups. Group 1 (Arrays 1 – 4) had similar junction temperatures (approximately 95oC) but produced different shortwavelength amplitudes (ranging from 89% to 124% of the measured emission amplitude at the standard condition, 20 mA, 25oC ambient temperature). Group 2 (Arrays 2 and 5 – 9) produced similar short-wavelength amplitudes (approximately 114% of the emission amplitude at the standard condition), but had different junction temperatures (ranging from 69oC to 115oC). The operating conditions of the different arrays are summarized in Table 1. These conditions were achieved by adjusting the LED drive current and the ambient temperature inside the chambers.
Usually, LEDs undergo rapid changes during an initial period of several hundred hours, and then settle into a more systematic degradation pattern. Therefore, the LED arrays were initially seasoned for 400 hours at their respective operating conditions prior to collecting data. The junction temperatures of each array remained fairly constant over time with small fluctuations (no more than 2oC), mainly caused by the fluctuations of the room temperature and the ambient temperature in the thermal chambers. 9
2.1.1 Results of Experiment 1 Fig. 3 shows the relative light output as a function of time for the LED arrays in Group 1, which had similar junction temperatures but different short-wavelength amplitudes. For each array, the relative light output over time was normalized to its initial value. The horizontal axis is on a log scale. The light output decrease over time is exponential in nature and therefore, the light output, L, can be expressed as: L = e -α t
(1)
where α is the light output degradation rate or the decay constant, and t is the operation time measured in hours.
Exponential curve fits yielded different decay constants for each LED array. Fig. 4 illustrates the variation of the decay constant as a function of short-wavelength amplitude of the LED emission. A higher decay constant means a faster degradation rate. As the short-wavelength amplitude increased, the decay constant also showed an increasing trend (Fig. 4). Therefore, as hypothesized, the light output degradation of 5 mm type white LEDs exhibits an increasing trend with increased short-wavelength radiation.
10
Fig. 5 shows the relative light output as a function of time for the LED arrays of Group 2, which had similar short-wavelength amplitudes but different junction temperatures. Here, too, the light output decrease over time is exponential in nature. As before, exponential curve fits yielded the decay constants for each LED array. Fig. 6 illustrates the variation of the decay constant as a function of junction temperature. With increasing junction temperature, the decay constant increased exponentially (Fig. 6). As hypothesized, the light output degradation rate of 5 mm type white LEDs increased with increased junction temperatures.
2.2 Experiment 2 The goal of the second experiment was to investigate the impact of placing the phosphor away from the die and the epoxy. Three LED arrays, each containing sixteen 5 mm LEDs, were housed in separate aluminum cylinders, each with a 5 cm diameter, as shown in Fig. 7. Two of the arrays were assembled using blue LEDs, and one was assembled with white LEDs. All of the LEDs were purchased in June 2003 from a single manufacturer (white: NSPW510BS; blue: NSPB510S). The inside surfaces of the cylinders were painted white. Two cylinders, one with a blue LED array and another with a white LED array, were fitted with a 5 cm round transparent glass window. The third cylinder with a blue array was fitted with a similar glass window coated with a YAG:Ce phosphor on one side. This glass 11
window was installed with the phosphor side facing the LED array. The light source assemblies were mounted vertically facing downward. The LED arrays were housed inside three chambers, similar to the ones used earlier, and were life-tested.
The experiment was conducted twice, once with a set of LED arrays operating at 60 mA and then with a second set of LED arrays operating at 40 mA. All LEDs were seasoned for a few hundred hours at their respective operating currents prior to collecting data. Light output data were recorded twice each day. Data for the 60 mA drive current were recorded for approximately 650 hours. Then the experiment was repeated with the second set of LED arrays operating at a 40 mA constant current.
2.2.1 Results of Experiment 2 Fig. 8 illustrates the relative light output of the LED arrays as a function of time. As hypothesized, the white LED array had the highest depreciation rate while the blue and blue-plus-phosphor arrays had lower depreciation rates. As it can be seen in the plot, placing the phosphor layer close to the die causes the LEDs to degrade faster.
Fig. 8 shows that the blue-plus-phosphor LEDs degraded at a rate slightly higher than the blue LEDs at 60 mA. This may be due to the fact that the phosphor layer was not 12
hermetically sealed and moisture could have degraded the phosphor. At 40 mA, both degraded at the same rate for a while, and then the blue-plus-phosphor LEDs started to slow down with respect to the blue. When the pin temperatures of the two LED arrays were examined, they showed a few degrees change in temperature during this period. Therefore, the deviation is possibly due to the fact that the light output change as a function of temperature is different for the two LED arrays.
3. Discussion Although junction heat and amplitude of short-wavelength radiation influenced the yellowing of the epoxy, and hence, the light output degradation rate of these types of white LEDs, the junction temperature had a much greater effect than the short-wavelength amplitude. One aspect that needs further investigation is the interaction between junction temperature and the amount of short-wavelength radiation on the degradation of these types of white LEDs. The authors of this manuscript are presently studying this issue, and the results will be published at a later time.
Results obtained thus far show that the lumen maintenance of white LEDs can be improved by using epoxy materials that have lower photodegradation characteristics, by extracting the heat more efficiently from the die to keep it cooler, and by not placing the 13
phosphor layer very close to the die. Some white LEDs in the marketplace have exploited the first two facts and have shown dramatic improvements in lumen maintenance [5, 6]. It should be noted that there are other components that can also cause light output reduction, including degradation of the die attaché epoxy and discoloration of the metal reflector due to thermal effects. Once the photodegradation phenomenon is addressed, the degradation of the semiconducting element will become the primary cause for long-term lumen depreciation. By that time, the useful life of white LEDs will have significantly improved, and the white LED will be closer to delivering its long-life promise.
Acknowledgements The authors would like to thank the U.S. Department of Energy and the University of California at Santa Barbara for their support in the form of a grant (DOE Grant DE-FC2601NT41203). Dr. Madis Raukas of OSRAM SYLVANIA is thanked for supplying the glass plates with YAG:Ce phosphor coatings. Richard Pysar of the LRC is thanked for designing and implementing the LED life-test apparatus. Jennifer Taylor of the LRC is thanked for helping us to prepare this manuscript.
14
References 1. S. Nakamura, T. Mukai, M. Senoh, Appl. Phys. Lett. 64 (1994) 1687. 2. S. Nakamura and G. Fasol, in: The Blue Laser Diode, GaN Based Light Emitters and Lasers, Springer, Berlin, 1997. 3. N. Narendran, J. Bullough, N. Maliyagoda, A. Bierman, J. Illum. Eng. Soc. 30(1) (2001) 57. 4. N. Narendran, L. Deng, Proc. IESNA Annual Conference (2002) 157. 5. N. Narendran, L. Deng, R.M. Pysar, Y. Gu, H. Yu, Proc. SPIE 5187 (2004) 267. 6. D.A. Steigerwald, J.C. Bhat, D. Collins, R.M. Fletcher, M.O. Holcomb, M. J. Ludowise, P.S. Martin, S. Rudaz, IEEE Journal on Selected Topics in Quantum Electronics 8(2) (2002) 310. 7. R. Mueller-Mach, G.O. Mueller, M.R. Krames, T. Trottier, IEEE Journal on Selected Topics in Quantum Electronics 8(2) (2002) 339. 8. M.R. Krames et al., Phys. Stat. Sol. (a) 192(2) (2002) 237. 9. T. Egawa, H. Ishikawa, T. Jimbo, M. Umeno, Appl. Phys. Lett 69(6) (1996) 830. 10. L. Sugiura, J. Appl. Phys. 81(4) (1997) 1633. 11. L. Sugiura, J. Appl. Phys. 70(10) (1997) 1317. 12. M. Fukuda, Reliability and Degradation of Semiconductor Lasers and LEDs, Artech House, Boston, 1991. 13. D.L. Barton, M. Osinski, P. Perlin, C.J. Helms, N.H. Berg, Proc. SPIE 3279 (1998) 17. 14. D. Barton, M. Osinski, IEEE LEOS 2 (1998) 440. 15. F.M. Steranka et al., Phys. Stat. Sol. (a) 194(2) (2002) 380. 16. J. Akhavan, E. Koh, S. Waring, E. Kronfli, Polymer 42 (2001) 7711. 17. A. Torikai, H. Hasegawa, Polymer Degradation and Stability 63 (1999) 441. 18. Y. Gu, N. Narendran, Proc. SPIE 5187 (2004) 107. 15
Phosphor particle
Light
Phosphor particle Die Epoxy with phosphor
scatter Reflector cup
Die attach epoxy
Fig. 1. Schematic of a 5 mm LED.
LEDs TC rtd
LED DRVR T-CTL
9" x 9"
LO
HEATER
Fig. 2a. Photo of the life-test setup.
Fig. 2b. Schematic of the setup.
16
Relative Light Output
1.000 A = 1.24 0.800
A = 1.14 A = 0.99
0.600
A = 0.89 0.400 10
100
1000
10000
Time (hrs)
Fig. 3. Light output variation as a function time for the LED arrays in Group 1.
Decay constant
0.001000 0.000800 0.000600 0.000400 0.000200 0.000000 0.80
0.90
1.00
1.10
1.20
1.30
1.40
Relative Amplitude of Short Wavelength Radiation Fig. 4. Decay constant α as a function of short-wavelength amplitude for the LED arrays in Group 1.
17
Relative Light Output
1.000
Tj = 69°C Tj = 79°C Tj = 85°C
0.800
Tj = 96°C Tj = 107°C 0.600
Tj = 115°C
0.400 10
100
1000
10000
Time (hrs)
Fig. 5. Light output variation as a function time for the LED arrays in Group 2.
Decay constant
0.00100 0.00080 0.00060 0.00040 0.00020 0.00000 60
70
80
90
100
110
120
Junction Temperature (deg C)
Fig. 6. Decay constant α as a function of junction temperature for the LED arrays in Group 2.
18
Blue LED Array
Blue LED Array
White LED Array
Glass Window
Glass Window with Phosphor coating
Glass Window
Fig. 7. Photo of an LED array enclosed in an aluminum cylinder, and the schematics of the three LED arrays used in Experiment 2.
Relative light output
1.0 0.9 0.8 0.7 0.6 0.5 0
200
400
600
800
1000
1200
Time (hours) Blue @ 40 mA
Blue+ph @ 40 mA
White @ 40 mA
Blue @ 60 mA
Blue+ph @ 60 mA
White @ 60 mA
Fig. 8: Lumen depreciation data for the three LED arrays at 40 mA and 60 mA. Table 1. Life-test conditions for each LED array. Group #
Group 1
Group 2
Array #
1 2 3 4 5 6 7 2 8 9
Ambient Drive current Relative amplitude of temperature (°C) (mA) short-wavelength emission 35 45 55 65 35 40 45 45 65 70
59 43 35 28 31 36 36 43 39 41
1.24 1.14 0.99 0.89 1.09 1.14 1.15 1.14 1.15 1.13
Junction temperature (°C) 95.9 96.0 94.8 94.7 68.7 78.6 84.5 96.0 106.5 114.5
19