Skagit County Consortium Tri‐County Consolidated Plan Island, Skagit, Whatcom 2015‐2017
May 15, 2015
Consolidated Plan 2015‐2017
Skagit County Consortium
1
Contents Executive Summary ....................................................................................................................................................... 4 ES‐05 Executive Summary ‐ 24 CFR 91.200(c), 91.220(b) .......................................................................................... 4 The Process .................................................................................................................................................................... 9 PR‐05 Lead & Responsible Agencies 24 CFR 91.200(b) ............................................................................................. 9 PR‐10 Consultation ‐ 91.100, 91.200(b), 91.215(l) .................................................................................................. 10 PR‐15 Citizen Participation ...................................................................................................................................... 20 Needs Assessment ....................................................................................................................................................... 21 NA‐05 Overview ...................................................................................................................................................... 21 NA‐10 Housing Needs Assessment ‐ 24 CFR 91.205 (a,b,c) ..................................................................................... 22 NA‐15 Disproportionately Greater Need: Housing Problems – 91.205 (b)(2) ......................................................... 30 NA‐20 Disproportionately Greater Need: Severe Housing Problems – 91.205 (b)(2) ............................................. 33 NA‐25 Disproportionately Greater Need: Housing Cost Burdens – 91.205 (b)(2) ................................................... 36 NA‐30 Disproportionately Greater Need: Discussion – 91.205(b)(2) ...................................................................... 38 NA‐35 Public Housing – 91.205(b) ........................................................................................................................... 39 NA‐40 Homeless Needs Assessment – 91.205(c) .................................................................................................... 46 NA‐45 Non‐Homeless Special Needs Assessment ‐ 91.205 (b,d) ............................................................................ 49 NA‐50 Non‐Housing Community Development Needs – 91.215 (f) ........................................................................ 52 Housing Market Analysis ............................................................................................................................................. 55 MA‐05 Overview ..................................................................................................................................................... 55 MA‐10 Number of Housing Units – 91.210(a)&(b)(2) ............................................................................................. 61 MA‐15 Housing Market Analysis: Cost of Housing ‐ 91.210(a) ................................................................................ 64 MA‐20 Housing Market Analysis: Condition of Housing – 91.210(a) ...................................................................... 68 MA‐25 Public and Assisted Housing – 91.210(b) ..................................................................................................... 71 MA‐30 Homeless Facilities and Services – 91.210(c) .............................................................................................. 76 MA‐35 Special Needs Facilities and Services – 91.210(d) ....................................................................................... 80 MA‐40 Barriers to Affordable Housing – 91.210(e) ................................................................................................. 84
Consolidated Plan 2015‐2017
Skagit County Consortium
2
MA‐45 Non‐Housing Community Development Assets – 91.215 (f) ....................................................................... 85 MA‐50 Needs and Market Analysis Discussion ....................................................................................................... 91 Strategic Plan ............................................................................................................................................................... 92 SP‐05 Overview ....................................................................................................................................................... 92 SP‐10 Geographic Priorities – 91.215 (a)(1) ............................................................................................................ 93 SP‐25 Priority Needs ‐ 91.215(a)(2) ......................................................................................................................... 94 SP‐30 Influence of Market Conditions – 91.215 (b) ................................................................................................ 95 SP‐50 Public Housing Accessibility and Involvement – 91.215(c) ......................................................................... 105 SP‐55 Barriers to affordable housing – 91.215(h) ................................................................................................. 106 SP‐60 Homelessness Strategy – 91.215(d) ............................................................................................................ 109 SP‐65 Lead based paint Hazards – 91.215(i) ......................................................................................................... 111 SP‐70 Anti‐Poverty Strategy – 91.215(j) ................................................................................................................ 112 SP‐80 Monitoring – 91.230 .................................................................................................................................... 113 Expected Resources ................................................................................................................................................... 114 AP‐15 Expected Resources – 91.220(c)(1,2) .......................................................................................................... 114 Annual Goals and Objectives ..................................................................................................................................... 116 Projects .................................................................................................................................................................. 117 AP‐35 Projects – 91.220(d) .................................................................................................................................... 117 AP‐50 Geographic Distribution – 91.220(f) ........................................................................................................... 119 Affordable Housing .................................................................................................................................................... 120 AP‐55 Affordable Housing – 91.220(g) .................................................................................................................. 120 AP‐60 Public Housing – 91.220(h) ......................................................................................................................... 121 AP‐65 Homeless and Other Special Needs Activities – 91.220(i) .......................................................................... 122 AP‐75 Barriers to affordable housing – 91.220(j) .................................................................................................. 124 AP‐85 Other Actions – 91.220(k) ........................................................................................................................... 125 Program Specific Requirements ................................................................................................................................ 127
Consolidated Plan 2015‐2017
Skagit County Consortium
3
Executive Summary ES‐05 Executive Summary ‐ 24 CFR 91.200(c), 91.220(b) 1.
Introduction
The Three Year Consolidated Plan is designed and intended to satisfy the statutory requirements of the Skagit County Consortium and its participating jurisdictions to receive funding allocations from the Department of Housing and Urban Development (HUD) through the HOME Investment Partnerships Program (HOME) and the Community Development Block Grant Program (CDBG). The Plan covers a three‐year period from program years 2015 to 2017. HOME funding is designed to help participating jurisdictions implement local housing strategies designed to increase the supply of decent, affordable housing for low‐ and very low‐income households. CDBG funding is designed to help the participating jurisdictions of the City of Mount Vernon and the City of Anacortes meet these objectives: CDBG objectives Provide decent housing Create suitable living environments Expand economic opportunities
National Objectives Benefit low‐income persons1 Aid in the prevention or elimination of slums or blight Meet a need having a particular urgency
The basic elements of the Consolidated Plan includes:
Public and Stakeholder Input Needs Assessment Housing Market Analysis Strategic Plan First‐Year Action Plan.
The Skagit County Consortium (Consortium) was organized in June 2014 and is comprised of three counties (Skagit, Island, and Whatcom) and 16 towns and cities in the three counties. The Consortium has been structured so that all three counties and 19 of the 21 municipalities within these counties are members. The City of Sedro‐Woolley in Skagit County elected not to join during the formation of the Consortium but may reconsider membership at a later date. The City of Bellingham in Whatcom County already administers its own HOME program. 1
For the purposes of the Strategic Plan Section, the term “low‐income” will include those households with income at or below 80% of the area median income published for each county area by HUD.
Consolidated Plan 2015‐2017
Skagit County Consortium
4
The participating municipalities include: Island County: Oak Harbor, Langley, Coupeville Skagit County: Anacortes, Mount Vernon, Burlington, Hamilton, Concrete, Lyman, La Conner Whatcom County: Ferndale, Lynden, Sumas, Blaine, Everson, Nooksack Skagit County has been designated as the lead entity for the Consortium.
2.
Summary of the objectives and outcomes identified in the Plan Needs Assessment Overview
The three‐year plan goals include (A) increasing the supply of affordable rental housing through tenant‐based rental assistance (TBRA) targeted toward 240 very low‐income households experiencing homelessness, and (B) increasing the supply of affordable owner‐occupied housing through direct financial assistance to 10 low‐income homebuyers.
Skagit County HOME Consortium Goals and Objectives 2015-2017 Goal
Objective
Outcome indicator
Increase supply of affordable rental housing
Provide decent affordable housing
Tenant-based Housing unit rental assistance
Increase supply of affordable owner-occupied housing
Provide decent affordable housing
Direct financial assistance to homebuyers
Households
Administration and planning
Administration
NA
NA
3-Year (goals, housing targets, funding)
Unit of measure
Goal
50‐ 80% AMI
>30‐ 50% AMI
>80‐ 100% AMI
Total
0‐30% AMI
>30‐ 50% AMI
Owner >50‐ 80% AMI
>80‐ 100% AMI
Total
NUMBER OF HOUSEHOLDS Substandard Housing ‐ Lacking complete plumbing or kitchen facilities Severely Overcrowded ‐ With >1.51 people per room (and complete kitchen and plumbing) Overcrowded ‐ With 1.01‐1.5 people per room (and none of the above problems) Housing cost burden greater than 50% of income (and none of the above problems) Housing cost burden greater than 30% of income (and none of the above problems) Zero/negative Income (and none of the above problems)
345
190
445
110
1,300
130
14
85
70
585
125
140
175
25
520
39
20
19
18
190
424
300
365
190
1,510
69
65
370
155
1,005
7,710
3,350
715
125 11,950
3,645
3,190
3,085
1,205 12,705
910
3,745
4,955
1,075 11,195
770
1,870
4,235
3,860 21,510
755
‐
‐
550
‐
‐
‐
755
‐
550
Table 7 – Housing Problems Table Data Source:
2007‐2011 CHAS
Consolidated Plan 2015‐2017
Skagit County Consortium
24
2. Housing Problems 2 (Households with one or more Severe Housing Problems: Lacks kitchen or complete plumbing, severe overcrowding, severe cost burden) 0‐ 30% AMI
>30‐ 50% AMI
Renter >50‐ >80‐ 80% 100% AMI AMI
Total
0‐ 30% AMI
>30‐ 50% AMI
Owner >50‐ >80‐ 80% 100% AMI AMI
Total
NUMBER OF HOUSEHOLDS Having 1 or more of four 8,600 3,975 1,695 450 15,275 3,880 3,295 3,565 1,450 14,480 housing problems Having none of four 2,665 5,145 10,110 5,295 36,790 1,435 4,795 11,955 9,745 89,825 housing problems Household has negative 755 ‐ ‐ ‐ 755 550 ‐ ‐ ‐ 550 income, but none of the other housing problems Table 8 – Housing Problems 2 Data Source:
2007‐2011 CHAS
3. Cost Burden > 30% 0‐30% AMI
Renter >30‐50% >50‐80% AMI AMI
Total
0‐30% AMI
Owner >30‐ >50‐ 50% 80% AMI AMI
Total
NUMBER OF HOUSEHOLDS Small Related 2,645
2,560
2,510
8,325 1,460 1,435
3,015
15,305
Large Related
525
670
265
1,544 114 425 890
2,968
Elderly
1,290
1,315
1,125
4,272 1,995 2,345
2,310
10,395
Other
5,035
2,955
2,090
10,715 970 920
1,435
6,260
12,020
9,120
11,805
Total need by income
52,815 5,860 8,090 15,520 104,855
Table 9 – Cost Burden > 30% Data Source:
2007‐2011 CHAS
4. Cost Burden > 50% 0‐30% AMI
Total
0‐30% AMI
Owner >30‐ >50‐ 50% 80% AMI AMI
Total
NUMBER OF HOUSEHOLDS Small Related 2,375
1,150
215
3,740 1,290 1,025
1,325
5,005
Large Related
400
200
25
625 110 360 290
964
Elderly
1,050
735
265
2,260 1,550 1,140 860
4,300
Consolidated Plan 2015‐2017
Renter >30‐50% >50‐80% AMI AMI
Skagit County Consortium
25
Other Total need by income
4,515
1,360
295
12,020
9,120
11,805
6,210 765 715 685
2,660
52,815 5,860 8,090 15,520 104,855
Table 10 – Cost Burden > 50% Data Source:
2007‐2011 CHAS
5. Crowding (More than one person per room) 0‐30% AMI
>30‐ 50% AMI
Renter >50‐ 80% AMI
>80‐ 100% AMI
Total
0‐ 30% AMI
>30‐ 50% AMI
Owner >50‐ >80‐ 80% 100% AMI AMI
Total
NUMBER OF HOUSEHOLDS Single family households Multiple, unrelated family households Other, non‐family households Total need by income
464
340
430
155
1,509
103
55
360
154
1,001
75
80
125
24
394
4
30
29
19
162
10
15
65
40
205
4
‐
‐
4
23
12,020 9,120 11,805 5,750 52,815 5,860 8,090 15,520 11,195 104,855 Table 11 – Crowding Information
Data Source:
2007‐2011 CHAS
Describe the number and type of single person households in need of housing assistance. The largest percentage of LMI households with a housing problem in the Consortium area concerns either Severe Cost Burden or Cost Burden. Data is provided in the Cost Burden >30% Table and the Cost Burden >50% Table (also known as Severe Cost Burden) concerning the types of households affected. The types of household detailed in these Tables include Small Related (four or fewer related persons), Large Related (five or more related persons), Elderly (household with at least one person 62‐74 years old), and Other. The “other” category would include, for example, households with at least one frail elderly (aged 75 and older), single‐person households, and households composed of unrelated members. Because single‐person households are not broken out separately, it is difficult to know how many of the “other” households represent single‐person households. For households categorized as “other,” Cost Burden and Severe Cost Burden occur the most frequently in households at the 0‐30% AMI income level regardless of whether the household rents or owns the home. Estimate the number and type of families in need of housing assistance who are disabled or victims of domestic violence, dating violence, sexual assault and stalking. Consolidated Plan 2015‐2017
Skagit County Consortium
26
Based on estimates from the Consortium region’s 2014 Point‐in‐Time Homeless Count, there are 246 severely mentally ill adults who are homeless; and 101 homeless adults with a chronic substance abuse disorder. Additionally, there were 192 homeless survivors of domestic violence.
What are the most common housing problems? The overwhelming housing problem is severe cost burden. There are 22,700 LMI households (12,585 renter and 10,115 owner) that are estimated to pay more than 50% of their income on housing costs. The other housing problems identified, though not nearly as prevalent as cost, are severe overcrowding (affecting 440 LMI renter households, and 78 owners), and substandard housing ‐‐ lacks kitchen or plumbing – (affecting 980 LMI renters and 229 LMI owners).
Are any populations/household types more affected than others by these problems? These problems affect renters more frequently than homeowners. They also tend to be concentrated toward the lower end of the LMI income continuum, especially for renters.
Consolidated Plan 2015‐2017
Skagit County Consortium
27
Describe the characteristics and needs of Low‐income individuals and families with children (especially extremely low‐income) who are currently housed but are at imminent risk of either residing in shelters or becoming unsheltered 91.205(c)/91.305(c)). Also discuss the needs of formerly homeless families and individuals who are receiving rapid re‐housing assistance and are nearing the termination of that assistance Approximately 13% of total households in the Consortium region have children age six and younger; however, among LMI households, it is 16%. Approximately 50% of all households with children six or younger present (9,919 out of 19,802) are low‐income (LMI). LMI households with small children are divided among income levels as follows: 0‐30%AMI (27%), 30‐50% AMI (28%), and 50‐80% AMI (44%).. It is clear that a significant number of households with children in the Consortium area also have an extremely low income level. If combined with other risk factors, these households may be more vulnerable to homelessness. Risk factors may include: Severe housing cost burden – Homelessness is primarily a problem associated with housing affordability, the combination of very low‐income and relatively high housing cost comprise a significant risk factor. Medical problems – if one or more adults in an LMI household are on disability, it is unlikely that that household will be able to adequately cover all the expenses associated with raising children, in addition to medical and housing costs. Criminal history – An adult with a criminal history has a great deal of difficulty finding a job. Addiction and mental illness – Adults with a history of addiction or mental illness also find it difficult to find and maintain employment. Poor credit/ poor rental history – Having poor credit and/or poor rental history reduces the options of low‐income families when they do face a crisis. They are often unable to borrow money from traditional lenders like banks, and if forced to move, they have difficulty finding a new place to live. Opportunity Council and Community Action of Skagit County provide rapid re‐housing assistance in the region. Rapid re‐housing clients who are nearing termination of assistance may request additional assistance due to continued lack of employment by working age adults in the household. They may also need assistance with more intensive employment services to help them become job‐ready. Assistance with child care is a common need that is also related to successful employment. Throughout the period of assistance, it is also common for housing case managers to help clients access a variety of mainstream benefits and community‐based social and health services. Finally, it is useful for rapid rehousing programs to provide follow‐up check‐ins after program exit. The families and individuals should have continued contact with someone familiar with the case who can assist, support, encourage, and mentor them as problems arise.
Consolidated Plan 2015‐2017
Skagit County Consortium
28
If a jurisdiction provides estimates of the at‐risk population(s), it should also include a description of the operational definition of the at‐risk group and the methodology used to generate the estimates: Households are at‐risk of homelessness when the housing cost burden is severe, meaning, housing costs equal or exceed 50% of total household income and the total income of the household is at or below 50% AMI (very low‐income).
Specify particular housing characteristics that have been linked with instability and an increased risk of homelessness According to HUD, the risk of homelessness increases when household income is below 30% AMI, and the household must move into an emergency shelter or similar setting, and one of the following extenuating circumstances is present: the household has moved for economic reasons at least two times in the last 60 days, the household members are living in someone else’s home due to economic hardship, they will lose current housing within three weeks, they live in a hotel/motel not paid through charity or a government program, they live in severely overcrowded conditions, or they are leaving publicly‐funded institutional care.
Discussion Addressing the housing needs, especially those associated with risks of homelessness, makes the following efforts high priorities for the Consortium’s Consolidated plan:
increase the availability of rent assistance to create more affordable rental opportunities within the existing inventory of housing; increase the supply of affordable housing (including the supply of permanent supportive and other special needs housing); preserve the existing housing stock of affordable housing; and develop new resources to increase supply and maintain affordable housing stock through new and creative partnerships.
Consolidated Plan 2015‐2017
Skagit County Consortium
29
NA‐15 Disproportionately Greater Need: Housing Problems – 91.205 (b)(2) Introduction In this section, the Consortium examines specific categories of needs to determine whether individual races or ethnic groups have disproportionately greater needs concerning housing problems. A disproportionately greater need is recognized to exist when the percentage of persons in a category of need who are members of a particular racial or ethnic group is at least 10 percentage points higher than the percentage of persons in category as a whole. Households with no/negative income are listed for reference in the tables but are not included in the totals. Results will be seen in the discussion section.
0%‐30% of Area Median Income Housing Problems
Has one or more of four housing problems*
Has none of the four housing problems
Jurisdiction as a whole 7,150 1,522 White 5,644 1,269 Black / African American 75 0 Asian 292 20 American Indian, Alaska Native 212 109 Pacific Islander 4 0 Hispanic 727 90 Table 12 ‐ Disproportionally Greater Need 0 ‐ 30% AMI Data Source:
Household has no/negative income, but none of the other housing problems 833 578 94 33 34 10 79
2007‐2011 CHAS
*The four housing problems are: 1. Lacks complete kitchen facilities, 2. Lacks complete plumbing facilities, 3. More than one person per room, 4.Cost Burden greater than 30%
30%‐50% of Area Median Income Housing Problems
Has one or more of four housing problems
Has none of the four housing problems
Jurisdiction as a whole 7,245 2,973 White 5,954 2,724 Black / African American 45 10 Asian 158 48 American Indian, Alaska Native 177 98 Pacific Islander 4 0 Hispanic 714 69 Table 13 ‐ Disproportionally Greater Need 30 ‐ 50% AMI Data Source:
Household has no/negative income, but none of the other housing problems 0 0 0 0 0 0 0
2007‐2011 CHAS
*The four housing problems are: 1. Lacks complete kitchen facilities, 2. Lacks complete plumbing facilities, 3. More than one person per room, 4.Cost Burden greater than 30%
Consolidated Plan 2015‐2017
Skagit County Consortium
30
50%‐80% of Area Median Income Housing Problems
Has one or more of four housing problems
Jurisdiction as a whole
8,784
White
Household has no/negative income, Has none of the four but none of the housing problems other housing problems 8,739 0
7,419
7,564
0
Black / African American Asian
79 248
0 172
0 0
American Indian, Alaska Native
162
267
0
Pacific Islander Hispanic
39 724
45 502
0 0
Table 14 ‐ Disproportionally Greater Need 50 ‐ 80% AMI Data Source:
2007‐2011 CHAS
*The four housing problems are: 1. Lacks complete kitchen facilities, 2. Lacks complete plumbing facilities, 3. More than one person per room, 4.Cost Burden greater than 30%
80%‐100% of Area Median Income Housing Problems
Jurisdiction as a whole White
Has one or more of four housing problems 5,118 4,583
Black / African American Asian American Indian, Alaska Native Pacific Islander Hispanic
Household has no/negative income, Has none of the four but none of the housing problems other housing problems 6,757 0 6,021 0
80
54
0
132 74
90 146
0 0
0
10
0
187
293
0
Table 15 ‐ Disproportionally Greater Need 80 ‐ 100% AMI Data Source:
2007‐2011 CHAS
*The four housing problems are: 1. Lacks complete kitchen facilities, 2. Lacks complete plumbing facilities, 3. More than one person per room, 4.Cost Burden greater than 30%
Discussion Housing Problems: Disproportionally Greater Need at 0‐30% AMI At 0%‐30% AMI, there are 7,150 homes affected with Housing Problems out of 8,672 (82%). Disproportionately greater need (at least 10 points higher than 82%) exists for: • • •
Black/African Americans (75 out of 75 households for 100%) Asians (292 out of 312 households for 94%), Pacific Islanders (4 out of 4 households for 100%).
Consolidated Plan 2015‐2017
Skagit County Consortium
31
Housing Problems: Disproportionally Greater Need at 30‐50% AMI At 30‐50% AMI, there are 7,245 homes affected with Housing Problems out of 10,208 (71%). Disproportionately greater need (at least 10 points higher than 71%) exists for: • • •
Black/African Americans (45 out of 55 households for 82%) Pacific Islanders (4 out of 4 households for 100%). Hispanic (714 out of 783 households for 91%).
Housing Problems: Disproportionally Greater Need at 50‐80% AMI At 50‐80% AMI, there are 8,784 homes affected with Housing Problems out of 17,523 (50%). Disproportionately greater need (at least 10 points higher than 50%) exists for: •
Black/African Americans (79 out of 79 households for 100%).
Housing Problems: Disproportionally Greater Need at 80‐100% AMI At 80‐100% AMI, there are 5,118 homes affected with Housing Problems out of 11,875 (43%). Disproportionately greater need (at least 10 points higher than 43%) exists for: • •
Black/African Americans (80 out of 134 households for 60%) Asians (132 out of 222 households for 59%).
Consolidated Plan 2015‐2017
Skagit County Consortium
32
NA‐20 Disproportionately Greater Need: Severe Housing Problems – 91.205 (b)(2)
Introduction In this section pertaining to severe housing problems, as in the previous section pertaining to housing problems, the Consortium will examine specific categories of needs to determine whether individual races or ethnic groups have disproportionately greater needs. A disproportionately greater need is recognized to exist when the percentage of persons in a category of need who are members of a particular racial or ethnic group is at least 10 percentage points higher than the percentage of persons in category as a whole. Households with no/negative income are listed for reference in the tables but are not included in the totals. Results will be seen in the discussion section.
0%‐30% of Area Median Income Severe Housing Problems*
Jurisdiction as a whole White Black / African American Asian American Indian, Alaska Native Pacific Islander Hispanic Data Source:
Has one or more of four housing problems
Has none of the four housing problems
6,165 2,487 4,839 2,065 75 0 207 105 177 137 4 0 678 139 Table 16 – Severe Housing Problems 0 ‐ 30% AMI
Household has no/negative income, but none of the other housing problems 833 578 94 33 34 10 79
2007‐2011 CHAS
*The four housing problems are: 1. Lacks complete kitchen facilities, 2. Lacks complete plumbing facilities, 3. More than 1.5 persons per room, 4.Cost Burden greater than 50%
30%‐50% of Area Median Income Severe Housing Problems*
Has one or more of four housing problems
Has none of the four housing problems
Jurisdiction as a whole 3,939 6,269 White 3,314 5,358 Black / African American 40 20 Asian 58 149 American Indian, Alaska Native 32 234 Pacific Islander 0 4 Hispanic 385 398 Table 17 – Severe Housing Problems 30 ‐ 50% AMI Data Source:
2007‐2011 CHAS
Consolidated Plan 2015‐2017
Household has no/negative income, but none of the other housing problems 0 0 0 0 0 0 0
Skagit County Consortium
33
50%‐80% of Area Median Income Severe Housing Problems*
Has one or more of four housing problems
Has none of the four housing problems
Jurisdiction as a whole 3,344 14,150 White 2,853 12,115 Black / African American 0 79 Asian 58 357 American Indian, Alaska Native 67 367 Pacific Islander 25 59 Hispanic 299 931 Table 18 – Severe Housing Problems 50 ‐ 80% AMI Data Source:
Household has no/negative income, but none of the other housing problems 0 0 0 0 0 0 0
2007‐2011 CHAS
80%‐100% of Area Median Income Severe Housing Problems*
Has one or more of four housing problems
Has none of the four housing problems
Jurisdiction as a whole 1,356 10,528 White 1,237 9,398 Black / African American 0 129 Asian 24 198 American Indian, Alaska Native 54 161 Pacific Islander 0 10 Hispanic 23 452 Table 19 – Severe Housing Problems 80 ‐ 100% AMI Data Source:
Household has no/negative income, but none of the other housing problems 0 0 0 0 0 0 0
2007‐2011 CHAS
Discussion Severe Housing Problems: Disproportionally Greater Need at 0‐30% AMI At 0%‐30% AMI, there are 6,165 homes affected with Severe Housing Problems out of 8,652 (71%). Disproportionately greater need (at least 10 points higher than 71%) exists for: • • •
Black/African Americans (75 out of 75 households for 100%) Pacific Islanders (4 out of 4 households for 100%). Hispanic (678 out of 817 households for 83%).
Consolidated Plan 2015‐2017
Skagit County Consortium
34
Severe Housing Problems: Disproportionally Greater Need at 30‐50% AMI At 30‐50% AMI, there are 3,939 homes affected with Severe Housing Problems out of 10,208 (39%). Disproportionately greater need (at least 10 points higher than 39%) exists for: • •
Black/African Americans (40 out of 60 households for 67%) Hispanic (385 out of 783 households for 49%).
Severe Housing Problems: Disproportionally Greater Need at 50‐80% AMI At 50‐80% AMI, there are 3,344 homes affected with Severe Housing Problems out of 17,494 (19%). Disproportionately greater need (at least 10 points higher than 19%) exists for: •
Pacific Islander (25 out of 84 households for 30%).
Severe Housing Problems: Disproportionally Greater Need at 80‐100% AMI At 80‐100% AMI, there are 1,356 homes affected with Severe Housing Problems out of 11,884 (11%). Disproportionately greater need (at least 10 points higher than 11%) exists for: •
American Indian, Alaska Native (54 out of 214 households for 25%)
Consolidated Plan 2015‐2017
Skagit County Consortium
35
NA‐25 Disproportionately Greater Need: Housing Cost Burdens – 91.205 (b)(2) Assess the need of any racial or ethnic group that has disproportionately greater need in comparison to the needs of that category of need as a whole.
Introduction: In this section pertaining to housing cost burden, as in the previous sections pertaining to housing problems, the Consortium will examine specific categories of needs to determine whether individual races or ethnic groups have disproportionately greater needs. A disproportionately greater need is recognized to exist when the percentage of persons in a category of need who are members of a particular racial or ethnic group is at least 10 percentage points higher than the percentage of persons in category as a whole. Households with no/negative income are listed for reference in the tables but are not included in the totals. Results will be seen in the discussion section.
Housing Cost Burden Housing Cost Burden Jurisdiction as a whole White Black / African American Asian American Indian, Alaska Native Pacific Islander Hispanic Data Source:
50%
22,225 19,729 224 638
1,190 322 156 22 3,082 1,290 Table 20 – Greater Need: Housing Cost Burdens AMI
2007‐2011 CHAS
Discussion: Cost Burden: Disproportionally Greater Need at 0‐30% AMI At 0%‐30% AMI, there are 66,017 homes affected with Housing Cost Burden out of 102,440 (64%). Disproportionately greater need (at least 10 points higher than 64%) exists for: •
Pacific Islanders (156 out of 207 households for 75%).
Cost Burden: Disproportionally Greater Need at 30‐50% AMI At 30‐50% AMI, there are 22,225 homes affected with Housing Cost Burden out of 102,440 (22%). Disproportionately greater need (at least 10 points higher than 22%) exists for: •
Black/African Americans (224 out of 695 households for 32%)
Cost Burden: Disproportionally Greater Need at 50‐80% AMI Consolidated Plan 2015‐2017
Skagit County Consortium
36
At 50‐80% AMI, there are 14,198 homes affected with Housing Cost Burden out of 102,444 (14%). •
There are no race or ethnic group that have a disproportionate need related to cost burden in this income group.
Consolidated Plan 2015‐2017
Skagit County Consortium
37
NA‐30 Disproportionately Greater Need: Discussion – 91.205(b)(2) Are there any Income categories in which a racial or ethnic group has disproportionately greater need than the needs of that income category as a whole? A summary of groups affected by disproportionately greater needs can be seen below. NA‐15 Housing Problems • • • •
At 0‐30% AMI: Black/ African American, Asian, Pacific Islander. At 30%‐50% AMI: Black/ African American, Pacific Islander, and Hispanic At 50%‐80%AMI: Black/ African American. At 80%‐100% AMI: Black/ African American, Asian.
NA‐20 Severe Housing Problems • • • •
At 0‐30% AMI: Black/ African American, Pacific Islander, and Hispanic. At 30%‐50% AMI: Black/ African American, and Hispanic At 50%‐80%AMI: Pacific Islander. At 80%‐100% AMI: American Indian/Alaska Native.
NA‐25 Housing Cost Burden • •
At 0‐30% AMI: Pacific Islander. At 30%‐50% AMI: Black/ African American.
If they have needs not identified above, what are those needs? No additional needs have been identified.
Are any of those racial or ethnic groups located in specific areas or neighborhoods in your community? Island County compared to Skagit and Whatcom counties has a higher proportion of people who are Black/African American, Asian, and Filipino. Skagit County has a relatively high proportion of people of Hispanic ethnicity. Whatcom County has a higher proportion of people who are Native American or Alaska Native.
Consolidated Plan 2015‐2017
Skagit County Consortium
38
NA‐35 Public Housing – 91.205(b) Introduction The Skagit County Consortium region is home to nine Public Housing Agencies. Five of these are Tribally Designated Housing Entities (TDHE) serving Native American communities in Skagit and Whatcom Counties.
Anacortes Housing Authority Housing Authority of Island County Housing Authority of Skagit County Lummi Housing Authority Nooksack Indian Tribe
Samish Indian Nation Swinomish Housing Authority Upper Skagit Tribe Whatcom County Housing Authority
Description of Public Housing Authorities that operate within the participating Consortium jurisdictions Anacortes Housing Authority The Anacortes Housing Authority owns, partnerships and/or manages 183 units of affordable housing within the City of Anacortes. Anacortes Housing Authority owns and manages 112 HUD subsidized “public housing” units. Anacortes Housing Authority has a partnership and manages the remaining 71 units, which consist of 46 tax credit units at Bayview Apartments, which have 24 units with Project Based Section 8 and 25 tax credit units at The Wilson Hotel. Rents at the Bayview Apartments and The Wilson Hotel are well below market rents in the area. Housing Authority of Island County The Housing Authority of Island County owns and manages 148 units of affordable housing within Island County and is in the process of constructing a 26 unit LIHTC project. 110 of these units are federally subsidized Public Housing for seniors (62+) and disabled. Those units receive funding from the US Department of Housing and Urban Development (HUD). The remaining 38 units are broken out as follows: 12 unit senior condominium complex (55 and older), 10 unit mental health permanent supportive housing, and a 16 unit Women & children’s emergency & transitional housing. The Housing Authority of Island County also administers the HUD Section 8 rental assistance program, the HOME/TBRA program via WA State Dept. of Commerce. Housing Authority of Skagit County The Housing Authority of Skagit County owns and manages 263 units of affordable housing within Skagit County. 60 of these units receive rental subsidies through the U.S. Department of Agriculture, and occupancy is restricted to farmworker households. 80 units were developed through Low‐Income Housing Tax Credits and are available to eligible farmworker households. Of the remaining 123 units, 85 units are located at the Burlington Terrace Apartments, which is centrally located in Burlington, WA with easy access to I‐5, schools, shopping and other amenities. The final 38 units are located in the President Apartments, a historic hotel located in downtown Mount Vernon. Rents at both of these apartment Consolidated Plan 2015‐2017
Skagit County Consortium
39
complexes are well below market rents in the area. The Housing Authority of Skagit County does not own or manage any HUD subsidized “public housing” units. The Housing Authority manages a Housing Choice Voucher Program for all of Skagit County including VASH and Non‐Elderly Disabled Programs. Numbers provided in the accompanying tables reflect the entire county‐wide Housing Choice Voucher Program. Whatcom County Housing Authority The Bellingham/Whatcom County Housing Authority (BWCHA) assist approximately 1,738 households with Housing Choice Voucher Program (HCV) Section 8 (S8) that includes 274 project based units and tenant based rental assistance. Included are 45 Veteran Affairs Supportive Housing Vouchers tenant and project‐ based, 75 Mainstream V for households with disabilities and 75 Non‐elderly disabled households. BWCHA administers the Housing Opportunities for Persons with HIV/AIDs Program (HOPWA) for a four county area that includes Whatcom County. Annually, approximately 12 households in Whatcom County are provided funding assistance directly related to housing needs. BHA also administers funding for the Shelter Plus Care Program working with local sponsor agencies to provide rental assistance and supports to approximately 200 households annually. The Housing Authority manages approximately 600 units of Public Housing overall. There are 209 units in the county and unincorporated area that includes: 1 single family scattered site home, 32 public housing units, 24 rural development (agricultural), 11 rural development senior housing units, 61 units of low income housing tax credits units, and 50 Low Income Housing Tax Credit (LIHTC) senior units. There are also 30 public housing units in the unincorporated area of Bellingham. BWCHA’s current activities outside of Bellingham include recently completed moderate to significant rehabilitation of 61 LIHTC family units and on‐going renovations and updates of the 61 Public Housing units.
Totals in Use
Number of units vouchers in use
Certificate
Mod‐ Rehab
Public Housing
Total
Project ‐based
0
0
222
611
59
Vouchers Special Purpose Voucher Veterans Tenant Family Affairs Disabled ‐based Unification Supportive * Program Housing
801
37
0
Table 21 ‐ Public Housing by Program Type *includes Non‐Elderly Disabled, Mainstream One‐Year, Mainstream Five‐year, and Nursing Home Transition
273
Alternate Data Source Name: Housing Authorities of Island, Skagit, Whatcom counties, and Anacortes Housing Authority
Consolidated Plan 2015‐2017
Skagit County Consortium
40
Characteristics of Residents
Vouchers Special Purpose Voucher Veterans Tenant Family Affairs ‐based Unification Supportive Program Housing 18 22 0
Certificate
Mod‐ Rehab
Public Housing
Total
Project ‐based
# Homeless at admission
0
0
0
74
0
# of Elderly Program Participants (>62)
0
0
76
305
0
119
3
0
# of Disabled Families
0
0
35
557
1
366
10
0
# of Families requesting accessibility features
0
0
0
540
0
540
0
0
# of HIV/AIDS program participants
0
0
0
0
0
0
0
0
# of DV victims
0
0
0
0
0
10
0
0
Table 22 – Characteristics of Public Housing Residents by Program Type
Alternate Data Source Name: Housing Authorities of Island, Skagit, Whatcom counties, and Anacortes Housing Authority
Race of Residents
Race
White Black/African American Asian American Indian/ Alaska Native Pacific Islander Other
Vouchers Special Purpose Voucher Veterans Tenant Family Affairs ‐based Unification Disabled* Supportive Program Housing 772 40 0 371
Certificate
Mod‐ Rehab
Public Housing
Total
Project ‐based
0
0
120
1,301
8
0
0
6
34
0
19
3
0
6
0
0
2
15
0
5
0
0
8
0
0
0
15
0
5
2
0
10
0 0
0 0
2 0
9 1
0 0
5 1
2 0
0 0
0 0
*includes Non‐Elderly Disabled, Mainstream One‐Year, Mainstream Five‐year, and Nursing Home Transition Table 23 – Race of Public Housing Residents by Program Type Alternate Data Source Name: Housing Authorities of Island, Skagit, Whatcom counties, and Anacortes Housing Authority
Consolidated Plan 2015‐2017
Skagit County Consortium
41
Ethnicity of Residents
Ethnicity
Hispanic Not Hispanic
Certificate
Mod‐ Rehab
Public Housing
0 0
0 0
3 127
Total
220 1,151
Project ‐ based 8 0
Vouchers Special Purpose Voucher Veterans Tenant ‐ Family Affairs based Unification Disabled* Supportive Program Housing 191 3 0 15 615 44 0 366
*includes Non‐Elderly Disabled, Mainstream One‐Year, Mainstream Five‐year, and Nursing Home Transition Table 24 – Ethnicity of Public Housing Residents by Program Type Alternate Data Source Name: Housing Authorities of Island, Skagit, Whatcom counties, and Anacortes Housing Authority
Consolidated Plan 2015‐2017
Skagit County Consortium
42
Section 504 Needs Assessment: Describe the needs of public housing tenants and applicants on the waiting list for accessible units: Anacortes Housing Authority: The Anacortes Housing Authority owns and manages 112 public housing units. The Harbor House is a 50 unit complex designed for persons who are elderly and/or disabled. AHA has three ADA accessible 2‐bedroom units and one 3‐bedroom unit. Housing Authority of Island County: The Housing Authority of Island County owns 110 public housing units. The wait for these units can be three to six years depending on the area of the island the prospective tenant chooses to reside. Brookhaven (Langley) is the most requested and has the longest waiting list. If prospective applicants are willing to accept a studio/efficiency unit, their wait times may be shortened. Housing Authority of Skagit County: The Housing Authority of Skagit County does not own or manage any public housing units. Whatcom County Housing Authority: The Bellingham Housing Authority Manages 209 units of public and affordable housing in Whatcom County. There are seven accessible units, two at LIHTC properties, four public housing units located in the county, and one rural development unit.
Most immediate needs of residents of Public Housing and Housing Choice voucher holders Anacortes Housing Authority: There are 119 households (197 persons) on the Public Housing waiting list. Of these 18 are elderly households , 13 are elderly & disabled, 44 are non‐elderly disabled households and the remaining 44 have not reported being elderly or disabled. The most immediate need to address the waiting list is increased funding for affordable single and family housing. Housing Authority of Island County: There are 60 households on the Section 8 waiting list, the waiting list will open on April 1 for 60 days (closing 31 May 2015), and we anticipate we will receive 500 applications. Of these 20% (12) are elderly households, 40% are non‐elderly disabled households and the remaining 40% have not reported being elderly or disabled. The most immediate need to address the waiting list is increased funding for affordable family housing. The households already on the waiting list have been waiting for over 6 years. Although we are opening our waiting list for a 60 day period, applicants should not expect immediate assistance, this is only providing an opportunity to get on the list since it has been closed since March 2009. Housing Authority of Skagit County: There are 1786 households (4600 Family members) on the Section 8 waiting list. Of these 13% (227) are elderly households, 17% (309) are non‐elderly disabled households and the remaining 70% (1250) have not reported being elderly or disabled. The most immediate need to address the waiting list is increased funding for affordable family housing. Whatcom County Housing Authority: Affordable housing units are an immediate need. Public Housing Waitlist are long and new HCV S8 families are finding it difficult to locate a safe decent housing situation. Security deposits and Consolidated Plan 2015‐2017
Skagit County Consortium
43
transportation are also of concern for families. Vacancy rates are very low in Whatcom County and lack of affordable unit construction over the past 6 years, is contributing to the difficulty for very low income families with vouchers to locate units. In addition, owner/agents require 1st month’s rent and security deposits that very low income families must seek assistance for. Since the fall of 2014, the Housing Authority has received a significant number of rent increase notifications for HCV S8 families residing in the County. Approximately 71% of the HCV S8 households are elderly, elderly/disabled and disabled living on fixed incomes. Some of these HCV S8 families are choosing to pay a little more out of pocket to stay where there is access to transportation, local services and schools. There are some families that may have affordable rents in the far reaches of the County, but still have transportation needs to meet medical and other social service appointments in Bellingham that are not available in the County. Gas prices have certainly impacted choices for those with vehicles and where public transportation is limited.
How do these needs compare to the housing needs of the population at large Anacortes Housing Authority: The population at large includes 57 households with a disability and 18 elderly while on Public Housing waiting list. This is primarily because 44 households on the Public Housing waiting list are for non‐elderly disabled households. Housing Authority of Island County: The population at large includes 15.6% households with a disability while the Section 8 waiting list includes only 8%. This is primarily because 5% of all the Island County Section 8 vouchers are specifically for non‐elderly disabled households. Housing Authority of Skagit County: The population at large includes 15.6% households with a disability while the Section 8 waiting list includes only 8%. This is primarily because 37% of all the Skagit County Section 8 vouchers are for non‐elderly disabled households. Whatcom County Housing Authority: The same concerns exist for the public at large. More affordable units are needed. The Housing Authority and its programs have limited resources to provide rentals and rental assistance to low income families that need it. But also affordability for young families in low to moderate income ranges moving toward homeownership is still very difficult in this economy. Those families too are competing for affordable rentals and seeking to be near work, services and schools that support their families until they have the ability to make other choices.
Discussion Anacortes Housing Authority: The Anacortes Housing Authority operates 112 public housing units. However, the Anacortes Housing Authority provides an enormous amount of housing assistance through the management of Bayview Apartments Tax Credit/Project Base Section 8 program and Wilson Hotel Tax Credit program. Additionally, the Anacortes Housing Authority owns and operates housing facilities that are extremely important resources for the community. During the consultation process for this plan, it is clear that the Anacortes Housing Authority is eager to partner with the City of Anacortes and others to develop the resources needed to implement the housing goals of the plan.
Consolidated Plan 2015‐2017
Skagit County Consortium
44
Housing Authority of Island County: The Housing Authority of Island County operates public housing for seniors and persons with disabilities, as well as other Housing Trust Fund Projects. The Housing Authority provides an enormous amount of housing assistance through the management of Housing Choice vouchers and in the future, VASH vouchers. The Housing Authority of Island County was recently invited to apply for 14 VASH vouchers. The application has been submitted, we are waiting for approval from HUD. Additionally, the Housing Authority is building its first LIHTC project, Sunny View Village, which is targeted to working families that reside on the south end of Whidbey Island. Housing Authority of Skagit County: The Housing Authority of Skagit County does not operate public housing. However, the Housing Authority provides an enormous amount of housing assistance through the management of Housing Choice vouchers and VASH vouchers. Additionally, the Housing Authority owns and operates housing facilities that are extremely important resources for the community. During the consultation process for this plan, it is clear that the Housing Authority is eager to partner with the City of Mount Vernon and others to develop the resources needed to implement the housing goals of the plan.
Consolidated Plan 2015‐2017
Skagit County Consortium
45
NA‐40 Homeless Needs Assessment – 91.205(c) Introduction: Washington State passed legislation that requires county auditors to charge an additional surcharge on recorded documents. These funds are collected to support local strategies to prevent or reduce homelessness. The county governments within the Consortium are the lead agencies for administering these and other funds and for creating and updating each jurisdiction’s 10‐Year Plan to End Homelessness as required by state law. Much of the information for this section of the needs assessment is derived from the most recent homeless census conducted in 2014 by each of the three counties, and each county’s Housing Inventory Chart, which is maintained by the Washington State Department of Commerce based on input from each county lead agency.
Homeless Needs Assessment Population Persons in Households with Adult(s) and Child(ren) Persons in Households with Only Children Persons in Households with Only Adults Chronically Homeless Individuals Chronically Homeless Families Veterans Unaccompanied Child Persons with HIV
Estimate the # of persons experiencing homelessness on a given night Sheltered Unsheltered 330
125
9
1
209
335
47
150
9 16 9 1
8 40 1 0
Table 25 ‐ Homeless Needs Assessment
Alternate Data Source Name: Island, Skagit, and Whatcom County Point‐in‐time Counts 2014 ‐ HMIS data
For persons in rural areas who are homeless or at risk of homelessness, describe the nature and extent of unsheltered and sheltered homelessness within the jurisdiction: Families and individuals in rural areas who are homeless or at risk of homelessness experience the worst combination of difficult circumstances among homeless populations. There are few, if any, emergency shelters available. The few shelters available usually cater to specific populations such as domestic violence. In addition, there are relatively few jobs and limited public transportation. The rental housing stock is small, and yet the rents are relatively high. This combination of circumstances makes it difficult for providers to offer quality program assistance in the more rural areas of the region.
Consolidated Plan 2015‐2017
Skagit County Consortium
46
If data is not available for the categories "number of persons becoming and exiting homelessness each year," and "number of days that persons experience homelessness," describe these categories for each homeless population type (including chronically homeless individuals and families, families with children, veterans and their families, and unaccompanied youth): Each of the three counties in the Consortium region have homeless housing coordinated entry systems at various stages of development. Whatcom County’s system has been operating since 2008, Skagit County’s since 2013, and Island County’s is still in the early stages of development. Therefore it is not yet possible to estimate these statistics uniformly throughout the region. We expect to be able to do that in 2016. Meanwhile, we can report from Whatcom County’s system that approximately 100 households per month received a new homeless housing intake assessment, for a total in 2014 of approximately 1,200 households. On average in Whatcom County, across all homeless populations, the average length of time homeless is 100 days from intake to housing enrollment. This varies considerably by subpopulations: for people fleeing domestic violence, the average length of homelessness is 65 days, for veterans 27 days, for families 101 days. Estimate the number and type of families in need of housing assistance for families with children and the families of veterans. The 2014 Point‐in‐Time Count found 152 homeless families with children in the region, 112 were sheltered and 40 were unsheltered. The Count also found 51 single, unaccompanied, homeless veterans, 12 of whom were sheltered, 39 were unsheltered. The Count also found five homeless families with children that included a veteran, one of which was unsheltered. Describe the Nature and Extent of Homelessness by Racial and Ethnic Group. Data on homelessness by racial and ethnic group is not collected during the annual Point‐in‐Time Count. The local homeless management information system (HMIS) will be used in the future to provide more detailed demographic data on homeless persons and families throughout the region; however, to date, the capacity to provide such estimates with accuracy is still being developed. Describe the Nature and Extent of Unsheltered and Sheltered Homelessness. In 2014, according to the PIT Count, 653 homeless households were encountered. Half (50%) were unsheltered and the other half were sheltered. Of the sheltered households, 52% were residing in emergency shelter and 48% in transitional housing. Families with children are far more likely to be sheltered (74%) compared to households without children (41%). Comparing individual counties, Whatcom County had 58% of the 653 homeless households, Skagit had 30%, and Island had 11%. For most categories of homeless populations, Whatcom has a majority of the homeless households. However, Whatcom’s percentage of unsheltered households is less than half of the region’s total (49%); and for unsheltered families with children, Whatcom’s share is only 35% of households (Skagit 45% and Island 20%). Discussion: Local homeless service providers are hard at work implementing their recently updated 10‐Year Plans to End Homelessness. The plans call for more coordination, planning, and data‐driven programming and decision
Consolidated Plan 2015‐2017
Skagit County Consortium
47
making. The new and improved coordinated entry programs within each of the three counties promise to deliver on the HEARTH Act goals related to reducing the number of people who experience homelessness, reducing repeat episodes of homelessness, and reducing the time that people spend in a state of homelessness. Service providers will continue to deploy a diverse set of tools that include interim housing (shelter and transitional housing), rapid rehousing, and supportive housing that may be specialized to meet the needs of certain populations: youth, minors, individuals and families who are chronically homeless, and people re‐entering the communities from institutions such as jail, prison, psychiatric hospitals, and inpatient addiction treatment.
Consolidated Plan 2015‐2017
Skagit County Consortium
48
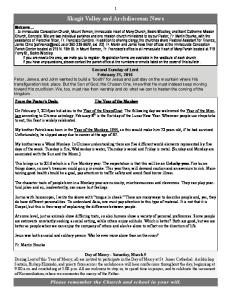
NA‐45 Non‐Homeless Special Needs Assessment ‐ 91.205 (b,d) Introduction: The non‐homeless special needs population includes the elderly and frail elderly, persons with disabilities, persons with substance use and mental health needs, victims of domestic violence, persons with HIV/AIDS, veterans and youth. Describe the characteristics of special needs populations in your community Special Needs populations may find it difficult to find employment, reliable transportation, and childcare. They often have difficulty paying for essential needs such as food, rent, utilities, health care, and medicine. Special needs populations are diverse. They differ greatly in their needs, some needing more assistance from community‐based service providers and others less. Special needs populations often need assistance with medications, food, clothing and daily living assistance. A critical need for each population is stable and sustainable housing that is affordable and in good condition. Non‐homeless special needs elderly and frail elderly: The 2010 Census identifies 59,955 people over the age of 64 living in the region, 15% of the region’s population. Significant increases in the number of persons between the ages 55 ‐ 69 occurred between 2000 and 2010, a 77% increase compared to only a 16% population increase overall. This indicates that the needs, including housing needs, will increase significantly as this baby boom cohort continues to age. 90 years and over
Female
Male
85 to 89 years 80 to 84 years 75 to 79 years 70 to 74 years
Baby boomers
Baby boomers 65 to 69 years 60 to 64 years 55 to 59 years 50 to 54 years 45 to 49 years
2010
40 to 44 years
2000
35 to 39 years 30 to 34 years 25 to 29 years 20 to 24 years 15 to 19 years 10 to 14 years 5 to 9 years Under 5 years (20,000)
(15,000)
Consolidated Plan 2015‐2017
(10,000)
(5,000)
‐
5,000
10,000
Skagit County Consortium
15,000
20,000
49
Persons with disabilities: Based on estimates from the Consortium region’s 2014 Point‐in‐Time Homeless Count, there are 246 severely mentally ill adults who are homeless; and 101 homeless adults with a chronic substance abuse disorder. According to the region’s public housing agencies, there are 500 housing vouchers being used currently by household that include at least one person who is disabled. Substance use and mental health: Substance use and mental health are frequently identified as high priority issues. Some indicators of the severity of these special needs in the Consortium region include:
The percentage of adults at or below 200% of the Federal poverty level who are in need of substance abuse treatment and eligible for subsidized treatment services ranges from 8.7% in Skagit County to 11.7% in Whatcom County; however, for the whole Consortium region, only 35% of these adults received treatment, leaving a treatment gap of 65%. This is about equal to the statewide treatment gap (66%). The treatment gap for individual counties are: Island – 83%; Skagit – 46%; and Whatcom – 69%. (Source: WA DBHR Trends Report 2010). The rate of adult treatment admissions for heroin addiction increased substantially in all three Consortium counties between the years 2004 and 2009. In Island County the rate of heroin treatment admissions from 9 per 100,000 population in 2004 to 13 in 2009. In Skagit, from 140 to 265, and in Whatcom from 49 to 187. (Source: WA DBHR Trends Report 2010). During the 2013 homeless census, 101 homeless persons in the Consortium region self‐reported having a substance abuse disability and 246 reported having a mental illness.
Domestic violence: Domestic violence is one of several primary factors associated with homelessness. During the 2013 homeless census, 192 homeless persons reported being a survivor of domestic violence.
What are the housing and supportive service needs of these populations and how are these needs determined? A single type of housing will not work for all those in need of housing assistance. Some groups do better in group settings in which they can find mutual support. Others may do better in individual settings that are more integrated into neighborhoods; those living with acute disabilities may need housing that includes daily supportive services. A diverse inventory of special needs housing should be the goal of communities in the Consortium region. While there may be general consensus by service providers about the type, location and intensity of service needs for certain special needs populations; service providers and their clients also value consumer choice in housing and services. These preferences are best accommodated by having a diverse mix of housing. Therefore, housing determinations are based on both general and specific, client‐centered criteria.
Discuss the size and characteristics of the population with HIV/AIDS and their families within the Eligible Metropolitan Statistical Area: Washington State Department of Health reports that there are 363 persons in the Consortium region presumed to be living with HIV/AIDS as of December 31, 2013 (WA State Dept. of Health, HIV Surveillance Semiannual Report, June 2014). Consolidated Plan 2015‐2017
Skagit County Consortium
50
Public Size and Characteristics of Population with HIV / AIDS Consortium region residents living with HIV/AIDS have access to services from Bellingham‐based Evergreen Wellness Advocates, a grassroots community effort that began in 1985 to meet the needs of people living with HIV and AIDS. The organization now services in 11 Western Washington counties, including Island, Skagit and Whatcom, with a range of programs and services, including:
Case management Women's program Volunteer program Emergency financial assistance (Barney Wood Memorial Fund) Community education and forums Outreach and prevention
Discussion: The rapidly growing elderly population presents a challenge to the community to prepare for housing and other special needs unique to older adults. The housing cost burden for the elderly population, particularly renters, is already high and is projected to increase in both prevalence and magnitude. Other special needs populations are best accommodated by having some level of consumer choice in housing type (e.g. congregate living versus scattered site) and location. They are also best served by having supportive services that are tailored to the needs of individual tenants, including having the option to obtain housing stability without the prerequisite of mandatory service participation as one would find in a “housing‐first” or harm reduction supportive housing model.
Consolidated Plan 2015‐2017
Skagit County Consortium
51
NA‐50 Non‐Housing Community Development Needs – 91.215 (f) NOTE: This section of the plan is limited to describing the non‐housing community development needs of the cities of Mount Vernon and Anacortes because they are the only jurisdictions that receive Community Development Block Grant (CDBG) funds that can be used for non‐housing needs.
Describe the jurisdiction’s need for Public Facilities: Mount Vernon: Public facilities needs – as they relate to the priorities of the consolidated plan – are described in detail in the City’s Downtown and Waterfront Master Plan. Topping the list of necessary public facilities is the completion of the floodwall, which is the primary means of flood hazard mitigation necessary for the safety of residents and to encourage private redevelopment investments that are needed to realize the City’s vision for Downtown. Other public facilities needed include pedestrian and circulation improvements, streetscape improvements, and public restrooms. Anacortes: Anacortes’s most pressing public facility needs include a community center, boys & girls club/teen center. Much community input has presented the need for a centralized community center that can provide multiple services to the community at large. Also, the local chapter of the Boys & Girls Club was recently dislocated from its long‐standing location and re‐located in the basement of City Hall. This location is definitely not ideal as it is far from the schools with children bused to the location and does not adequately accommodate the needs of the children and staff. Teens in the Anacortes area are sorely lacking a place to go after school that is safe and provides a positive atmosphere to foster learning and develop skills to help them become quality adults. Much community input has been expressed for these type of facilities.
How were these needs determined? Mount Vernon: A key element of the master planning process was creation of a Citizen Advisory Group (CAG) comprised of downtown business leaders, property owners, and other local stakeholders. In addition to CAG meetings, the public involvement process included four public meeting/open houses and seven City Council briefings. Anacortes: Since 2014, the City has been conducting an extensive update of the 2016 Comprehensive Plan (Comp Plan). The Comp Plan serves a wide range of purposes and functions including promotion of the health, safety and welfare of the public. A Citizen’s Advisory Committee was established to oversee the development of the Comp Plan and is made up of business leaders, property owners and other local stakeholders. This Committee is compiling and reviewing the vast public input from the four community workshops to date and various city‐wide surveys regarding all aspects in future development of the City. In addition, in 2014, the Port of Anacortes prepared the North and West Basin Concept Plan as part of their Comprehensive Plan to obtain community input on the needs and desires to develop the marina and core downtown areas. The most predominant needs presented through this processes has been a community center and children/teen activity centers. Consolidated Plan 2015‐2017
Skagit County Consortium
52
Describe the jurisdiction’s need for Public Improvements: Mount Vernon: The City’s Downtown and Waterfront Master Planning process identified a common vision for the Downtown target area, which includes amenities such as:
Adequate parking Streetscape and sidewalk improvements Art and water features Permanent Farmer’s Market Children’s museum
Art and history museum Outdoor cinema Public art River activities Public dock
Public restrooms
Anacortes: The 2016 Comprehensive Plan update process and the Port of Anacortes’s North and West Basin Concept Plan identified the following common elements for the City:
Street repair throughout the city Sidewalk installation and repair South Commercial streetscape Maritime museum Pedestrian connectivity between Cap Sante Marina and downtown Boat launches for both non‐motorized and motorized boats
Waterfront events center Small boat center Increasing walkability throughout city Improve vehicular mobility throughout city Improved parking throughout city Multi‐use plaza, lawn, dog park and children’s play area
How were these needs determined? Mount Vernon: Through the Downtown and Waterfront Master Plan process described above. Anacortes: Through the 2016 Comp Plan update and the North and West Basin Concept Plan described above.
Describe the jurisdiction’s need for Public Services: Mount Vernon: The City provides CDBG funding assistance for public (human) services to low‐income persons and households in the City. The City has typically funded public service in two areas: homeless Shelter Services, and basic needs Anacortes: The City provides the full 15% CDBG funding for public services to low income persons and households within the city. These funds are typically provided to an emergency family shelter and basic needs.
Consolidated Plan 2015‐2017
Skagit County Consortium
53
How were these needs determined? Mount Vernon: The needs have been determined through the process of stakeholder consultation, Citizen Participation, and public comment. Anacortes: The needs are determined through stakeholder consultation, citizen participation and public comment.
Consolidated Plan 2015‐2017
Skagit County Consortium
54
Housing Market Analysis MA‐05 Overview Housing Market Analysis Overview: Introduction Housing affordability and access to adequate housing are driven largely by trends in population dynamics and labor market conditions, which vary considerably, even within this relatively small, three‐ county region. Therefore, the drafters of this plan were fortunate to receive assistance from HUD’s Region 10 Director of the Economic and Market Analysis Division (EMAD). The following market overview of each of the three counties in the Consortium region is excerpted from very recent EMAD reports.
Island County Income In Island County, the inflation‐adjusted median wage increased at an average annual rate of 0.4 percent from 2001 through 2013 compared with 1.7 percent from 1990 through 2000. Population As of December 1, 2014, the population of Island County was estimated at 80,125, increasing at an average annual rate of 0.4 percent since 2010. The relatively slow pace of population growth since 2010 was primarily because of weak labor market conditions in 2010 and 2011 and the recovery which didn’t begin until mid‐2012 when jobs increased at annual rate of just 0.4 percent through May of 2013. As the labor market continues to recover, population growth is forecast to increase at an average annual rate of 0.7 percent to 81,925 by December 2017. Both owners and renters paid a greater percentage of income on housing in 2013 compared with 2000. Monthly owner costs of greater than 30 percent of income increased from 34.3 percent in 2000 to 46.7 percent in 2010 compared with 31.3 percent to 39.0 in Washington State. Gross rents of greater than 30 percent of income were 34.3 percent in 2000 increasing to 45.6 percent in 2010 compared with 39 percent to 50.8 percent in Washington. Slightly outpacing population growth, household growth is expected to increase in response to improving labor market conditions averaging an annual rate of growth of 0.9 percent, or 300 households, during the 3‐year forecast period. Sales Housing Market Sales housing market conditions are balanced to soft in Island County but improving. As of December 1, 2014, the owner vacancy rate was 3.5 percent compared with 3.0 percent as reported in the 2010 Consolidated Plan 2015‐2017
Skagit County Consortium
55
Census. Sales of existing homes increased 9 percent to 1,900 during the 12‐month period ending October 2014 (CoreLogic). The average price of an existing home sold was $277,000, an increase of 7 percent from a year earlier. New home sales increased 49 percent to 110 and the average price of a new home sold decreased 3 percent to $276,100. For the second consecutive year, the Washington Center for Real Estate Research (WCRER) Housing Affordability Index declined for Island County. During the first quarter of 2014 the Index for all buyers was 158.5 and the First‐Time Homebuyer Affordability Index was 96.5 compared with 168 and 100.3 in the first quarter of 2013. Rental Market As of December 1, 2014, the rental market was balanced in Island County with vacancy rate of 4.3 percent. Interviews with property managers and apartment leasing agents indicated that both the single family and apartment segments of the market were tight. According to the 5‐year 2009‐2013 American Community Survey, the median contract rent in Island County was $951. The median contract rent increased at an average annual rate of 4 percent from April 2000 Census to the 5‐year 2009‐2013 period. Based on preliminary data, no permits were issued for multifamily construction during the 12 months ending November 2014 and none were issued for the previous 12‐month period. Building permit activity from 2008 to 2013 was at its lowest level since the early 1980s. The most active period of multifamily construction in Island County since 2000 was from 2001 through 2004 when permits averaged 90 units a year. Since 2008, the only multifamily permit issued was in for a duplex in 2012. Construction of rental housing did not keep pace with the increase in renter households from 2000‐2009. Estimated total additions to rental housing from 2000‐2009: 725 Total change in renter households from 2000‐2009: 1,200 According to data from CBRE EA, all 120 multifamily units completed since 2000 were for senior renters. An improving economy and a tight rental market are the primary factors contributing to expected demand of 110 units a year during the forecast period.
Consolidated Plan 2015‐2017
Skagit County Consortium
56
County Skagit
Island Sales Housing Market Owner vacancy rate Existing home average price (2014) New home average price (2014) Housing Affordability Index ‐ all buyers (Q4 2014) Housing Affordability Index ‐ first‐time buyers (Q4 2014) Rental Housing Market Rental vacancy rate (Fall 2014) Median contract rent (2013) Median contract rent (2000) Annual percent increase in contract rent (2000‐2013) Expected future demand for new rental units per year (2015‐2017)
Whatcom
3.50% 2.50% 2.20% 277,000 245,500 257,100 276,100 295,500 326,500 140.1
144.4
135.8
87.3
70.9
75.0
4.30% 3.50% 5.00% $ 951 $ 807 $ 750 $ 597 $ 583 $ 540 4.6%
3.0%
110
170
3.0% 500
Skagit County Income In Skagit County, the inflation‐adjusted median wage increased at an average annual rate of 0.6 percent from 2001 through 2013 compared with 0.9 percent from 1990 to 2000. Population As of July 1, 2014, the population of Skagit County was estimated at 119,600, increasing at an average annual rate of 0.5 percent, or 525 persons, since 2010. The relatively slow pace of population growth since 2010 was primarily because the labor market recovery did not begin in Skagit County until 2013. Since 2000, population growth was greatest during the period 2003 to 2008 averaging 1.5 percent annually. As the labor market continues to recover, population growth is forecast to increase at an average annual rate of 1.0 percent to 123,225 by June 2017. Weak labor market conditions resulted in household growth not keeping up with population growth leading to reduced household formation during the period. Both owners and renters paid a greater percentage of income on housing in 2013 compared with 2000. Monthly owner costs of greater than 30 percent of income increased from 35.4 percent in 2000 to 42.8 percent in 2010 compared with 31.3 percent to 39.0 in Washington State. Gross rents of greater than 30
Consolidated Plan 2015‐2017
Skagit County Consortium
57
percent of income were 32.2 percent in 2000 increasing to 53.8 percent in 2010 compared with 39 percent to 50.8 percent in Washington (2000 Census, ACS 3‐year 2009‐2013). In tandem with population growth, household growth is expected increase in response to improving labor market conditions averaging an annual rate of growth of 0.9 percent, or 425 households, during the 3‐year forecast period. Sales Housing Market Sales housing market conditions are slightly soft in Skagit County but are improving. As of July 1, 2014, the owner vacancy rate was 2.5 percent compared with 2.6 percent as reported in the 2010 Census. Sales of resale homes increased 11 percent to 1,575 during the 12‐month period ending June 2014 (CoreLogic). The average price of a resale home sold was $245,500, an increase of 5 percent from a year earlier. New home sales increased 21 percent to 204 and the average price of a new home sold increased 16 percent to $295,500. After increasing for five consecutive years, the Washington Center for Real Estate Research (WCRER) Housing Affordability Index declined during 2013. During the first quarter of 2014 the Index for all buyers was 150.1 and the First‐Time Homebuyer Affordability Index was 77.1 compared with 183.7 for all buyers and 123.6 for first‐time buyers in the first quarter of 2013. Based on preliminary data, during the 12 months ending June 2014, 254 permits were issued for single family construction, relatively unchanged from the 259 permits issued for the same period a year earlier. Permits issued for single family construction averaged 211 from 2009 through 2011 compared with the peak average of 875 from 2005 through 2007. The pace of single‐family home construction from 2000 to 2010 far outpaced the growth in owner households.
Estimated total additions to the Skagit County housing inventory from 2000 – 2009: 8,900 Estimated total additions to owner‐occupied housing from 2000‐2009: 7,670 Total increase in owner households from 2000‐2009: 3,400
The demand for new market rate sales housing is expected to improve for the next 3 years averaging 300 units a year. Some portion of demand can be expected to be met by other vacant units. Rental Market As of July 1, 2014, the rental market was tight in Skagit County with vacancy a rate of 3.5 percent. Interviews with property managers and apartment leasing agents indicated that both the single family and apartment segments of the market were tight. According to WCRER, the average apartment rent as of September 2013 was $793 and the average vacancy rate was 2.8 percent for the 1,358 apartments surveyed in Mount Vernon and Anacortes.
Consolidated Plan 2015‐2017
Skagit County Consortium
58
According to U.S. Census reports, no permits were issued for multifamily construction in 2013 and only 51 units were issued permits from 2010 through 2012. Construction of rental housing did not keep pace with the increase renter households from 2000‐2009.
Estimated total additions to renter housing from 2000‐2009: 1,215 Total change in renter households from 2000‐2009: 3,125 According to data from CBRE EA, 53 percent of the 606 multifamily units completed since 2000 have been for senior renters, 29 percent for subsidized projects for families and farmworkers and 19 percent were condominiums.
An improving economy and a tight rental market are the primary factors contributing to expected demand of 170 units a year during the forecast period.
Whatcom County Income In Whatcom County, the inflation‐adjusted median wage increased at an average annual rate of 0.6 percent from 2001 through 2013 compared with 0.9 percent from 1990 to 2000. Population and Households As of November 1, 2014, the population of Whatcom County (excluding Bellingham) was estimated at 125,225, increasing at an average annual rate of 0.9 percent, or 1,075 persons, since 2010. The relatively slow pace of population growth since 2010 was primarily because the labor market recovery did not begin to show robust growth in Whatcom County until 2012. As the labor market continues to recover and retirees continue to locate in Whatcom County, population growth is forecast to increase at an average annual rate of 1.1 percent to 129,425 by October 2017. Weak labor market conditions resulted in a shift in household tenure from owners to renters. In 2010, 74.5 percent of households were owner occupied whereas by November 2014 the percentage of owner occupied households fell to 73.1 percent. Both owners and renters paid a greater percentage of income on housing in 2013 compared with 2000. Monthly owner costs of greater than 30 percent of income increased from 27.8 percent in 2000 to 29.5 percent in 2009‐13 compared with 31.3 percent to 38.0 in Washington State. Gross rents of greater than 30 percent of income were 36.8 percent in 2000 increasing to 46.0 percent in 2009‐13 compared with 39 percent to 50.7 percent in Washington (2000 Census, ACS 5‐year 2009‐2013). In tandem with population growth, household growth is expected increase in response to improving labor market conditions averaging an annual rate of growth of 1.1 percent, or 550 households, during the 3‐year forecast period. Sales Housing Market
Consolidated Plan 2015‐2017
Skagit County Consortium
59
Sales housing market conditions are balanced in Whatcom County. As of November 1, 2014, the owner vacancy rate was 2.2 percent compared with 2.3 percent as reported in the 2010 Census. Sales of existing homes increased 5.4 percent to 1,493 during 2014 (Northwest Multiple Listing Service). The average price of a home sold was $257,100 during 2014, an increase of 6.1 percent from a year ago. New home sales increased 4.2 percent to 150 and the average price of a new home sold decreased 1.1 percent to $326,500. The average annual increase of the median value of a home far outpaced growth in wages from 2000 – 2013. Based on preliminary data, during 12 months ending November 2014, 271 permits were issued for single family construction, a 6 percent increase from the same period a year ago. Permits issued for single family construction averaged 350 from 2009 through 2011 compared with the peak average of 1,350 from 2003 through 2005. The demand for new market sales housing is expected to improve for the next 3 years averaging 500 units a year. Some portion of demand can be expected to be met by other vacant units. Rental Market As of November 1, 2014, the rental market was balanced in Whatcom County with a vacancy rate of 5.0 percent. According to Census data, the median contract rent in Whatcom County was $750 (5‐year ACS 2009‐2013). From 2000 to 2009‐2013, the median contract rent increased by 39.1 in Whatcom remainder compared with 43.1 percent in Bellingham city. Like sales housing prices, the average annual growth in contract rent exceeded growth in wages. Based on preliminary data, 154 permits were issued for multifamily construction in 2013, but only 51 units were issued permits from 2010 through 2012. Building permit activity from 2009 through 2012 was at the lowest level since the early 1980s. Construction of rental housing did not keep pace with the increase renter households from 2000‐2009. Estimated total additions to renter housing from 2000‐2009: 800 Total change in renter households from 2000‐2009: 2,575 According to data from CBRE EA, or the 220 multifamily units completed since 2000, 107 were assisted living apartments and 113 were condominiums. An improving economy and a tight rental market are the primary factors contributing to expected demand of 90 units a year during the forecast period.
Consolidated Plan 2015‐2017
Skagit County Consortium
60
MA‐10 Number of Housing Units – 91.210(a)&(b)(2) Introduction A large majority (70%) of the Consortium region’s housing stock is single‐family (detached or attached) units, and 20% is multi‐family housing with two or more units. The rest are mobile homes, boats, RV’s or other types of housing units. Just 5.6%% of the region’s housing stock is in buildings with 20 or more units. 74% of the owner‐occupied housing stock is in housing units with 3 or more bedrooms; however, only 34% of the rental stock is 3+ bedrooms. 25% of the rental stock are studio or 1‐bedroom units.
All residential properties by number of units Property Type Number 1‐unit detached structure 122,826 1‐unit, attached structure 4,681 2‐4 units 11,736 5‐19 units 13,800 20 or more units 10,195 Mobile Home, boat, RV, van, etc 17,661 Total 180,899 Table 26 – Residential Properties by Unit Number Data Source:
% 68% 3% 6% 8% 5% 10%
2007‐20011 ACS Data
Unit Size by Tenure
Owners Number
No bedroom 1 bedroom 2 bedrooms 3 or more bedrooms Total Data Source:
%
346