Research Articles
Shared Risk and Protective Factors for Overweight and Disordered Eating in Adolescents Dianne R. Neumark-Sztainer, PhD, MPH, RD, Melanie M. Wall, PhD, Jess I. Haines, PhD, MHSc, RD, Mary T. Story, PhD, RD, Nancy E. Sherwood, PhD, Patricia A. van den Berg, PhD Background: Weight-related problems, including obesity, eating disorders, and disordered eating, are major public health problems in adolescents. The identification of shared risk and protective factors for these problems can guide the development of relevant interventions to a broad spectrum of weight-related problems. This paper examines the prevalence and co-occurrence of overweight, binge eating, and extreme weight-control behaviors (vomiting, diet pills, laxatives, and diuretics) in adolescents and identifies shared risk and protective factors from within the socioenvironmental, personal, and behavioral domains for these three adverse weight-related outcomes. Methods:
Data were collected at Time 1 (1998 –1999) and Time 2 (2003–2004) on 2516 adolescents participating in Project EAT (Eating Among Teens). Data were analyzed in 2006 –2007.
Results:
Weight-related problems were identified in 44% of the female subjects and 29% of the male subjects. About 40% of overweight girls and 20% of overweight boys engaged in at least one of the disordered eating behaviors (binge eating and/or extreme weight control). Weight-teasing by family, personal weight concerns, and dieting/unhealthy weight-control behaviors strongly and consistently predicted overweight status, binge eating, and extreme weight-control behaviors after 5 years. Family meals, regular meal patterns, and media exposure to messages about weight loss were also associated with weight-related outcomes, although the strength and consistency of associations differed across outcomes and gender.
Conclusions: Weight-specific socioenvironmental, personal, and behavioral variables are strong and consistent predictors of overweight status, binge eating, and extreme weight-control behaviors later in adolescence. These findings support the need for research to determine if decreasing weight-related social pressures, personal weight concerns, and unhealthy weight-control behaviors can contribute to reductions in obesity in children and adolescents. (Am J Prev Med 2007;33(5):359 –369) © 2007 American Journal of Preventive Medicine
Introduction
W
eight-related problems, including obesity, eating disorders, and disordered eating behaviors such as unhealthy weight-control practices and binge eating, are major public health problems in adolescents given their high prevalence and adverse health consequences.1– 6 Research suggests
From the Division of Epidemiology and Community Health (NeumarkSztainer, Haines, Story, Sherwood, van den Berg) and the Division of Biostatistics (Wall), School of Public Health, University of Minnesota; HealthPartners Research Foundation (Sherwood), Minneapolis, Minnesota; and Department of Ambulatory Care and Prevention, Harvard Medical School (Haines), Boston, Massachusetts Address correspondence and reprint requests to: Dianne NeumarkSztainer, PhD, MPH, RD, Division of Epidemiology and Community Health, School of Public Health, University of Minnesota, 1300 South Second Street, Suite 300, Minneapolis MN 55454. E-mail: neumark@ epi.umn.edu. The full text of this article is available via AJPM Online at www.ajpm-online.net; 1 unit of Category-1 CME credit is also available, with details on the website.
that these weight-related problems can occur simultaneously, increase in severity over time, and lead to the onset of different weight-related problems.7–9 These observations suggest a need for developing interventions to simultaneously prevent a spectrum of weight-related problems.10 –14 Such an integrated approach could have advantages in terms of cost effectiveness, practicality, and consistency of public health messages.13 Behavioral research suggests that interventions will be more successful if they address factors that have been found to influence targeted outcomes.15 Thus, if effective integrated prevention approaches are to be developed, it is essential to identify predictors of multiple weight-related problems, both shared risk and protective factors. A review of the literature suggests that little research has investigated the shared risk and protective factors for obesity and eating disorders, although there is some theoretic and empiric support for the existence of such factors.14 For example, dieting
Am J Prev Med 2007;33(5) © 2007 American Journal of Preventive Medicine • Published by Elsevier Inc.
0749-3797/07/$–see front matter doi:10.1016/j.amepre.2007.07.031
359
can be a precursor to an eating disorder16 –20 and can also increase risk for binge eating and weight gain over time.8,21 Additionally, media use may increase risk for unhealthy weight-control behaviors and eating disorders through its negative effect on body image.22,23 Media use, particularly television viewing, also may increase risk for obesity through the encouragement of sedentary behaviors and promotion of high-calorie foods.24 –26 The authors are unaware of any large populationbased studies on adolescents that have presented a comprehensive analysis of shared risk and protective factors for both obesity and disordered eating. While it is possible to review the obesity and eating-disorders literature to identify shared risk and protective factors, comparisons across studies can be difficult to interpret due to methodologic differences in study populations, time frames, assessment of variables, and data analysis. Many of these limitations could be addressed by examining risk and protective factors for a broad spectrum of weight-related problems within the same study. The current study examines the prevalence of adolescent overweight, binge eating, and use of extreme weight-control behaviors, and their simultaneous occurrence. This study further examines 5-year longitudi-
nal associations among socioenvironmental, personal, and behavioral variables and these three weight-related problems, to identify shared risk and protective factors for the occurrence of these problems. The aim of this paper is to inform the development of interventions to prevent a broad spectrum of weight-related problems. If risk and protective factors relevant to multiple weight-related problems in adolescents can be identified, the next step will be to design interventions to address those shared risk and protective factors, and thus target multiple weight-related problems simultaneously. Since the aim is to inform the development of prevention interventions, the focus is on factors that are commonly addressed within either obesity or eating-disorder interventions,27,28 are potentially modifiable, and are suitable for addressing within health promotion programs for home, school, or community settings (Figure 1).
Methods Study Design and Population Project EAT-II (Eating Among Teens-II) is a longitudinal, follow-up study of Project EAT-I (Eating Among Teens-I), a
Personal factors
Socioenvironmental factors Weight-related norms Maternal weight concerns/behaviors Paternal weight concerns/behaviors Peer dieting behaviors Weight-teasing by family Weight-teasing by peers Media exposure Magazines on weight loss Television viewing
Body image and weight concerns Body dissatisfaction Weight concern Weight importance Psychological well-being Self-esteem Depressive symptoms Nutrition knowledge/attitudes Nutrition knowledge Perceived benefits—healthy eating Self-efficacy—healthy eating
Behavioral factors
Home food environment Family meal frequency Family meal atmosphere Healthy food availability
Weight-control practices Dieting Only healthy weight control Unhealthy weight control
Relationships Family connectedness Friend connectedness
Eating patterns Breakfast Lunch Dinner Fruit/vegetable intake Sugared beverages Diet soda pop
Weight-related outcomes Overweight Binge eating Extreme weight control
Physical activity/inactivity MVPA Team sports Weight-related sports Sedentary behaviors
Figure 1. Socioenvironmental, personal, and behavioral factors hypothesized to predict weight-related outcomes after 5 years in adolescents. MPVA, moderate-to-vigorous physical activity.
360
American Journal of Preventive Medicine, Volume 33, Number 5
www.ajpm-online.net
study of socioenvironmental, personal, and behavioral factors potentially relevant to dietary intake and weight-related outcomes in adolescents.7,8 The study population includes 2516 ethnically and socioeconomically diverse adolescents (1386 girls and 1130 boys). Project EAT-I surveyed adolescents from 31 primarily urban (27 inner-city and 4 inner-ring suburban) schools in the Minneapolis/St. Paul MN area during the 1998 –1999 academic year. Both middle school and high school students were included to capture adolescents at different ages. Participants completed in-class surveys and anthropometric measures. Five years later (2003–2004), Project EAT-II resurveyed participants by mail. Of the original study population (N⫽4746), 1074 (22.6%) were lost to follow-up for various reasons, primarily missing contact information at Time 1 (n⫽411) and/or no address found at Time 2 (n⫽591). Of the remaining 3672 participants contacted by mail, 2516 completed surveys, representing 53.0% of the original cohort and 68.4% of participants contacted for Project EAT-II. A third of the participants were in middle school in Project EAT-I (mean age⫽12.8⫾0.8 years at Time 1 and 17.2⫾0.6 years at Time 2) and two thirds of the participants were in high school in Project EAT-I (mean age⫽15.8⫾0.8 years at Time 1 and 20.4⫾0.8 years at Time 2). Study protocols were approved by the University of Minnesota’s Institutional Review Board Human Subjects Committee.
Survey Tool Development and Measures The development of the Project EAT survey was guided by focus groups with adolescents,29 a theoretic framework (Social Cognitive Theory) for understanding factors influencing eating and weight-related behaviors,30,31 a review of existing instruments,32–36 reviews by experts in the area, and several pilot tests of the survey. The survey was designed to assess issues of relevance to a broad spectrum of weight-related problems. Measures used in the current study to assess
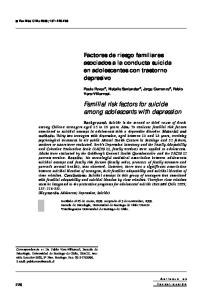
Figure 2. The intersection of weight-related problems: Overweight status, extreme weight-control behaviors and binge eating with loss of control in female adolescents (N⫽1311).
November 2007
Figure 3. The intersection of weight-related problems: Overweight status, extreme weight control behaviors and binge eating with loss of control in male adolescents (N⫽1069). weight status, binge eating, extreme weight-control behaviors, and predictors of these three weight-related problems, are described in the Appendix37–50 (see Appendix online at www.ajpm-online.net).
Statistical Analyses Descriptive statistics were conducted to assess the crosssectional prevalence of overweight, binge eating, or engaging in extreme weight-control behaviors at Time 2. Venn diagrams were used to represent the overlap of these behaviors, where differential circle areas approximately represented differential sizes of groups (Figures 2 and 3). Analyses were conducted on adolescents with non-missing data for weight status, binge eating, and extreme weight control behaviors (females, N⫽1311; males, N⫽1069). To identify shared risk and protective factors, longitudinal relationships between potential predictors at Time 1 and outcomes at Time 2 were examined using two models for each predictor/outcome combination separately. The “partially adjusted” model was a logistic regression of the Time-2 outcome on the Time-1 predictor adjusted for sociodemographic characteristics (age, race/ethnicity, and socioeconomic status [SES]). Time-1 overweight, binge eating, and extreme weight-control behaviors also were included for investigation as potential predictors of the Time-2 outcomes using the partially adjusted model. The “fully adjusted” model was additionally adjusted for Time-1 weight status and the respective Time-1 outcome (e.g., models predicting Time-2 binge eating adjusted for Time-1 binge eating and Time-1 weight status). The partially adjusted models allowed for a prediction of weight-related outcomes at Time 2, given specific predictors at Time 1. The fully adjusted models allowed for a prediction of change in weight-related outcomes over the 5-year period study period. Odds ratios (ORs) above 1 suggest that the predictor variable is a risk factor for the weight-related outcome, while
Am J Prev Med 2007;33(5)
361
362
Table 1. Associations between Time 1 socioenvironmental, personal, and behavioral factors and Time 2 weight-related problems for girlsa
American Journal of Preventive Medicine, Volume 33, Number 5
Partially adjustedb Overweight status OR
www.ajpm-online.net
Socioenvironmental factors Weight-related norms Maternal weight concerns/behaviors Paternal weight concerns/behaviors Peer dieting behaviors Weight-teasing by family Weight-teasing by peers Media exposure Magazines on weight loss Television viewing Home food environment Family meal frequency Family meal atmosphere Healthy food availability Relationships Family connectedness Friend connectedness Personal factors Body image and weight concerns Body dissatisfaction Weight concern Weight importance Weight status Psychological well-being Self-esteem Depressive symptoms Nutritional knowledge/attitudes Nutritional knowledge Perceived benefits—healthy eating Self-efficacy—healthy eating Behavioral factors Weight-control practices Dieting (yes/no) Only healthy weight control Unhealthy weight control Extreme weight control Binge eating Eating patterns Breakfast (times/week) Lunch (times/week) Dinner (times/week)
Binge-eating
Fully adjustedc Extreme weight control
Overweight status
Binge-eating
Extreme weight control
p value
OR
p value
OR
p value
OR
p value
OR
p value
OR
p value
1.87 1.54 0.97 2.71 2.92
⬍0.001 ⬍0.001 0.613 ⬍0.001 ⬍0.001
1.25 1.12 1.19 2.15 1.65
0.029 0.325 0.025 ⬍0.001 0.013
1.46 1.30 1.20 1.81 1.67
⬍0.001 0.002 0.001 ⬍0.001 ⬍0.001
1.43 1.25 0.92 2.00 1.55
⬍0.001 0.027 0.214 ⬍0.001 0.016
1.14 1.07 1.11 1.69 1.22
0.252 0.588 0.198 0.016 0.371
1.29 1.20 1.18 1.41 1.15
0.003 0.042 0.005 0.039 0.407
1.18 1.03
0.017 ⬍0.001
1.45 1.00
⬍0.001 0.614
1.59 1.01
⬍0.001 0.179
1.08 1.02
0.367 0.058
1.34 0.99
0.006 0.265
1.43 1.01
⬍0.001 0.247
0.96 1.01 0.82
0.129 0.907 0.069
0.91 0.74 0.61
0.009 0.007 0.003
0.91 0.81 0.86
0.001 0.014 0.218
0.99 1.07 1.01
0.664 0.513 0.956
0.90 0.75 0.67
0.012 0.015 0.021
0.93 0.83 0.99
0.018 0.037 0.963
0.97 0.75
0.085 0.007
0.95 0.73
0.061 0.039
0.96 0.87
0.030 0.237
0.97 0.81
0.243 0.106
1.06 0.80
0.517 0.176
1.02 0.98
0.827 0.849
1.06 1.89 1.27 18.10
⬍0.001 ⬍0.001 ⬍0.001 ⬍0.001
1.04 1.66 1.30 1.78
⬍0.001 ⬍0.001 0.007 0.005
1.06 2.04 1.54 2.26
⬍0.001 ⬍0.001 ⬍0.001 ⬍0.001
1.02 1.39 1.00 —
0.026 ⬍0.001 0.966 —
1.02 1.47 1.16 —
0.110 0.001 0.162 —
1.05 1.81 1.33 —
⬍0.001 ⬍0.001 ⬍0.001 —
0.95 1.00
0.006 0.846
0.89 1.13
⬍0.001 ⬍0.001
0.93 1.03
⬍0.001 0.140
0.98 1.00
0.440 0.895
0.93 1.09
0.009 0.004
0.97 1.00
0.118 0.858
1.08 1.04 1.00
0.008 0.049 0.891
0.98 0.97 0.94
0.627 0.308 0.007
1.03 1.06 0.99
0.398 0.019 0.622
1.09 1.04 1.03
0.017 0.124 0.136
0.96 0.95 0.95
0.378 0.083 0.045
1.01 1.05 1.00
0.832 0.061 0.867
1.25 2.70 4.44 1.09 1.54
⬍0.001 ⬍0.001 ⬍0.001 0.643 0.026
1.42 2.71 5.35 1.87 3.15
⬍0.001 0.045 ⬍0.001 0.008 ⬍0.001
1.50 1.51 3.81 3.19 2.20
⬍0.001 0.179 ⬍0.001 ⬍0.001 ⬍0.001
1.82 1.56 1.77 — —
⬍0.001 0.182 0.066 — —
2.07 4.64 8.04 — —
0.002 0.025 0.002 — —
2.19 1.45 3.07 — —
⬍0.001 0.267 ⬍0.001 — —
0.92 0.95 0.93
0.002 0.069 0.046
0.94 0.90 0.90
0.090 0.008 0.045
0.90 0.89 0.90
⬍0.001 ⬍0.001 0.008
0.96 0.99 0.95
0.204 0.682 0.247
0.95 0.89 0.89
0.150 0.008 0.030
0.92 0.91 0.93
0.002 0.005 0.082
(continued on next page)
0.016 0.090 0.987 0.471 1.07 1.12 1.00 1.00 0.794 0.251 0.125 0.659 0.99 0.90 1.60 1.00 0.97 0.93 0.92 1.01
Results The Intersection of Weight-Related Problems
Bolded odds ratios are statistically significant at the p⬍0.05 level. Adjusted only for sociodemographics: age, race, and socioeconomic status. c Adjusted for Time 1 outcomes, Time 1 weight status, and sociodemographics. MVPA, moderate-to-vigorous physical activity. b
a
0.99 0.92 1.36 1.00 0.046 0.038 0.645 0.002 0.95 0.88 1.09 1.01
0.802 0.332 0.270 0.509
1.05 1.07 0.99 1.00
0.039 0.270 0.944 0.431
0.342 0.351 0.723 0.090
0.872 0.979 0.014 0.168
p value OR
1.00 1.00 1.31 1.24 0.106 0.105 0.865 ⬍0.001
p value OR
0.94 1.09 1.03 2.06 0.259 0.117 0.130 0.054 0.97 0.93 1.21 1.42 0.690 0.927 0.018 0.005
p value OR p value
0.99 1.00 1.29 1.51
OR p value
0.044 0.184 0.959 ⬍0.001 0.92 1.07 0.99 2.46
OR
0.168 0.044 0.065 ⬍0.001
p value OR
0.97 0.93 1.21 1.70
Fruit/vegetable intake (times/week) Fast food (times/week) Sugared beverages (servings/day) Diet soda pop (servings/day) Physical activity/inactivity MVPA (hours/week) Team sports (number) Weight-related sports (yes/no) Sedentary behaviors (hours/week)
Extreme weight control Binge-eating Overweight status
Binge-eating
Extreme weight control
Overweight status
Fully adjustedc Partially adjustedb Table 1. (continued)
November 2007
ORs below 1 suggest that the predictor variable is a protective factor for the outcome. All ORs and p values are presented; greater attention is directed toward those that are statistically significant (p⬍0.05) or highly statistically significant (p⬍0.01 or ⬍0.001). All analyses were stratified by gender and conducted using SAS software, version 9.1. Data analysis for the current study was done in 2006 –2007. To account for differential response rates across sociodemographics in the longitudinal sample, data were weighted using the response propensity method,51 where the inverse of the estimated probability that an individual responded at Time 2 is used as the weight. The weighting method resulted in estimates representative of the demographic make-up of the original Project EAT-I sample. The weighted ethnic/racial and SES proportions were: 48.5% Caucasian, 19.0% African American, 19.2% Asian, 5.8% Hispanic, 3.5% Native American and 3.9% mixed or other race. Thirty-seven percent of the sample was of low or low–middle SES. After adjusting for sociodemographics and weighting, there were no significant differences found for overweight status, binge eating, or extreme weightcontrol behaviors at Time 1 between responders and nonresponders at Time 2.
Among girls (N⫽1311), 27.5% (n⫽361) were overweight, 22.1% (n⫽290) reported extreme weight-control behaviors, and 10.5% (n⫽138) reported binge eating with loss of control at Time 2 (Figure 2). Among all girls, 44% (n⫽577) had at least one of the three problematic weight-related outcomes and 13.4% (n⫽176) had more than one problematic outcome. Among overweight girls (N⫽361), 10.0% (n⫽36) reported both binge eating and extreme weight control behaviors, 6.4% (n⫽23) reported binge eating only, and 23.5% (n⫽85) reported extreme weight control behaviors only. Among boys (N⫽1069), the prevalence of overweight was similar to that found in girls (25.2%, n⫽269), but extreme weight-control behaviors (6.5%, n⫽70) and binge eating with loss of control (2.6%, n⫽28) were less commonly reported by boys than girls. There were also lower levels of intersection among the different weight-related problems in boys, as compared to girls (Figure 3). Among all boys, 29.2% (n⫽312) had at least one of the three problematic weight-related outcomes and 4.7% (n⫽50) had more than one problematic outcome. Among overweight boys (N⫽269), 1.9% (n⫽5) reported both binge eating and extreme weight-control behaviors, 3.7% (n⫽10) reported binge eating only, and 12.3% (n⫽33) reported extreme weight-control behaviors only.
Longitudinal Predictors of Weight-Related Problems in Girls In girls, several Time-1 socioenvironmental, personal, and behavioral variables were found to be significant Am J Prev Med 2007;33(5)
363
Figure 4. Risk and protective factors at Time 1 found separately to predict multiple weight-related outcomes at Time 2 (after 5 years) in fully adjusted models. Factors are included that significantly (p⬍0.05) predicted two or more outcomes in the same direction in either boys (B) or girls (G). Factors marked with an asterisk predicted all three weight-related outcomes for marked gender (e.g., dieting predicted all three outcomes in girls but only two in boys). Factors were risk factors unless marked as protective (protective). Adjusted for Time 1 weight-related outcomes, Time 1 weight status, and age, race, and socioeconomic status.
predictors of all three of the Time-2 problematic weight-related outcomes in partially adjusted models. Socioenvironmental predictors included maternal weight concerns/behaviors, weight-teasing by family and peers, and exposure to magazine articles on weight loss. Regarding personal factors, all of the body image and weight-concern variables were risk factors, and selfesteem was a protective factor. Behavioral risk factors included dieting, unhealthy weight-control behaviors, binge eating, and diet soda intake, whereas morefrequent dinner intake was protective (Table 1). In fully adjusted models, variables predictive of increases in all three Time-2 weight-related outcomes over the 5-year study period in girls were: weight-teasing by family, weight concern, and dieting (Table 1 and Figure 4). For example, girls who reported being teased about their weight at Time 1 were at about twice the risk for being overweight 5 years later (OR⫽2.00), and at about 1.5 times the risk for binge eating (OR⫽1.69) and extreme weight-control behaviors (OR⫽1.41) 5 years later. Thus, the strongest and most consistent predictors included weight-specific variables from each of the three domains: socioenvironmental (weightteasing by family), personal (weight concern), and behavioral (dieting). Other Time-1 variables that predicted two of three weight-related outcomes in the same direction included: maternal and paternal weight concerns/behavior, body dissatisfaction, and exposure to magazines on weight loss (risk factors), and frequent family meals, positive atmosphere at family meals, and frequent lunch intake (protective factors). For example, girls who reported a more positive meal atmosphere at Time 1 were at about three fourths the risk for binge eating (OR⫽0.75) and extreme weight-control behaviors (OR⫽0.83) at Time 2, but at neither increased nor decreased risk for being overweight. 364
Longitudinal Predictors of Weight-Related Problems in Boys In boys, Time-1 predictors of all three Time-2 weightrelated outcomes in partially adjusted models included: maternal weight concerns/behaviors, peer dieting behaviors, weight concern, weight status, dieting, and unhealthy and extreme weight-control behaviors (Table 2). In fully adjusted models, weight concern and unhealthy weight-control behaviors predicted increases in all three Time-2 weight-related outcomes. Maternal weight concerns/behaviors, dieting, and healthy weightcontrol behaviors predicted two of the three weightrelated outcomes. Thus, although fewer predictors of change in weight-related outcomes were found among boys than girls, a similar pattern was found in which the strongest and most consistent predictors were Time 1 weight-specific variables from within each of the socioenvironmental, personal, and behavioral domains (Table 2 and Figure 4).
Discussion The prevalence of weight-related problems, including overweight, binge eating, and extreme weight-control behaviors, was found to be high among adolescents, indicating a need for interventions aimed at their prevention, early identification, and treatment. The large number of overweight adolescents reporting extreme weight control and binge eating behaviors suggests that obesity prevention and treatment interventions might do well to broaden their focus to address a fuller spectrum of weight-related problems. The identification of a number of shared risk and protective factors for overweight, binge eating, and extreme
American Journal of Preventive Medicine, Volume 33, Number 5
www.ajpm-online.net
weight-control behaviors (see Figure 4) can guide the content development of interventions that simultaneously address these weight-related problems. Such interventions should target weight-specific variables from within the socioenvironmental (e.g., weightteasing by family), personal (e.g., weight concerns) and behavioral (e.g., unhealthy weight-control behaviors) domains. Nearly half (44%) of the girls and one third (29%) of the boys had one of the three problematic weightrelated outcomes examined in this study. These numbers are alarming, particularly considering that lessextreme unhealthy weight-control behaviors (e.g., meal skipping, fasting, and smoking for weight control) or binge eating without feeling a loss of control are not included in these totals. The high prevalence of weight-related problems found in the current study is consistent with findings from studies conducted with different adolescent populations.1,52,53 These findings further show that adolescents may simultaneously experience multiple weight-related problems; of particular note is the high percentage of overweight girls (nearly one fourth) reporting extreme weight-control behaviors. Variables identified as shared longitudinal risk factors for the development of weight-related problems in girls and boys included weight-related pressures within an adolescent’s social environment, personal weight and body concerns, and use of dieting and unhealthy weight-control behaviors. These findings are consistent with other studies that suggest the negative effects of weight-related social pressures,54 –56 body image concerns,57,58 and dieting17,59,60 on specific weight-related outcomes. Of all the variables examined, weightspecific variables were the strongest and most consistent predictors of overweight status, binge eating, and extreme weight control, even in analyses adjusted for Time-1 outcomes and weight status. These predictors were not only similar for different weight-related outcomes, but also operated in the same direction; for example, among girls, weight-teasing by family members and dieting behaviors predicted increases in overweight status, binge eating, and extreme weight-control behaviors. Weight-specific variables from within each of the socioenvironmental, personal, and behavioral domains contributed to the development of the problematic weight-related outcomes, suggesting the importance of addressing weight-specific variables across several domains within prevention interventions. With regard to variables less specific to weight, associations with outcomes were less consistent. Psychological well-being showed some associations with adverse weight-related outcomes. In partially adjusted models, self-esteem was protective against all problematic weight-related outcomes in girls, while depressive symptoms increased risk for binge eating in girls and risk for both overweight status and binge eating in boys. November 2007
Among girls, but not boys, frequent family meals and a positive atmosphere at family meals were protective against binge eating and extreme weight control behaviors, and increases in these behaviors over time. Having regular meals was also protective, although associations were not always consistent across different weightrelated outcomes and genders. These findings are in line with other studies that found associations among individual weight-related outcomes and psychological well-being,61 family meals,62,63 and meal patterns.64 – 66 Strengths of the current study that enhance the validity of the conclusions include the large and diverse study population; the broad array and theoreticallydriven selection of socioenvironmental, personal, and behavioral independent variables; the assessment of different weight-related outcomes; and the long followup period that captured major transitional stages during adolescence. This is the first study of which the authors are aware that has simultaneously and comprehensively examined risk and protective factors for different weight-related outcomes in a population-based sample of adolescents. Since interventions are more likely to succeed if they address factors found to predict the targeted outcomes, findings from the current study have the potential to inform the development of interventions to improve the overall weight-related health of adolescents. For example, although intervention studies are needed to better establish whether relationships found in the current longitudinal study are of a causal nature, these findings suggest that if interventions are developed to reduce negative weight-related norms at home, a decrease may be seen in the prevalence of overweight, binge eating, and extreme weight-control behaviors among youth. Study limitations also need to be taken into account in interpreting the findings. Although the study population was large and diverse, it was drawn from one Midwestern state, thus extrapolations to other populations should be done carefully. Furthermore, there was attrition from the original study population, although results from Time 2 were weighted to better reflect the baseline study population. Because of the comprehensive nature of the Project EAT survey, many of the measures of predictor variables and weight-related outcomes were brief in order to avoid respondent overburden. Clinical measures of eating disorders were not included and height and weight were based on self-report at Time 2, because data were collected via mailed surveys. However, at Time 1 both measured and self-reported BMI were assessed and found to be highly correlated (r⫽0.85 for girls and r⫽0.89 for boys).67 Further research is needed to replicate findings from the current study. Associations found in the current study should be further explored using a combination of qualitative and quantitative research methodologies. Research examining the impact of interventions on Am J Prev Med 2007;33(5)
365
366
Table 2. Associations between Time 1 socioenvironmental, personal, and behavioral factors and Time 2 weight-related problems for boysa
American Journal of Preventive Medicine, Volume 33, Number 5
Partially adjustedb Overweight status OR
www.ajpm-online.net
Socioenvironmental factors Weight-related norms Maternal weight concerns/behaviors Paternal weight concerns/behaviors Peer dieting behaviors Weight-teasing by family Weight-teasing by peers Media exposure Magazines on weight loss Television viewing Home food environment Family meal frequency Family meal atmosphere Healthy food availability Relationships Family connectedness Friend connectedness Personal factors Body image and weight concerns Body dissatisfaction Weight concern Weight importance Weight status Psychological wellbeing Self-esteem Depressive symptoms Nutritional knowledge/attitudes Nutritional knowledge Perceived benefits-healthy eating Self-efficacy—healthy eating Behavioral factors Weight-control practices Dieting (yes/no) Only healthy weight control Unhealthy weight control Extreme weight control Binge eating Eating patterns Breakfast (times/week) Lunch (times/week) Dinner (times/week)
Binge-eating p value
Fully adjustedc Extreme weight control OR
p value
Overweight status OR
p value
Binge-eating
p value
OR
OR
1.56 1.38 1.20 4.14 4.35
⬍0.001 ⬍0.001 0.007 ⬍0.001 ⬍0.001
1.75 0.99 1.40 1.26 2.58
0.007 0.974 0.035 0.694 0.020
1.32 1.18 1.52 1.97 1.70
0.041 0.266 0.001 0.071 0.072
1.29 1.21 1.12 2.27 1.92
0.012 0.084 0.189 0.006 0.004
1.61 0.87 1.31 0.98 1.99
1.39 1.02
⬍0.001 0.027
1.12 1.00
0.619 0.943
1.61 1.02
⬍0.001 0.191
1.18 1.01
0.136 0.477
0.98 0.90 0.87
0.446 0.293 0.306
1.05 1.54 0.73
0.517 0.135 0.362
0.91 0.70 0.65
0.064 0.038 0.060
0.99 1.02 1.06
0.99 1.07
0.574 0.533
0.91 0.52
0.059 0.015
0.93 1.43
0.023 0.084
1.06 2.55 1.23 17.70
⬍0.001 ⬍0.001 0.010 ⬍0.001
1.04 2.18 1.42 2.64
0.067 ⬍0.001 0.085 0.011
1.06 1.96 1.52 3.44
0.96 1.05
0.078 0.048
0.91 1.24
0.108 ⬍0.001
1.09 1.05 1.03
0.004 0.049 0.096
0.89 0.97 1.08
4.41 2.63 6.45 2.58 2.65
⬍0.001 ⬍0.001 ⬍0.001 0.005 0.010
0.89 0.88 0.91
⬍0.001 ⬍0.001 0.073
p value
Extreme weight control OR
p value
0.029 0.544 0.107 0.966 0.121
1.18 1.05 1.55 1.00 0.90
0.272 0.735 ⬍0.001 0.999 0.767
1.04 1.00
0.855 0.783
1.43 1.01
0.015 0.573
0.705 0.875 0.718
1.05 1.56 0.73
0.547 0.130 0.379
0.94 0.80 0.82
0.297 0.224 0.413
1.02 1.25
0.416 0.113
0.90 0.50
0.041 0.011
0.94 1.70
0.107 0.020
⬍0.001 ⬍0.001 0.002 ⬍0.001
1.01 1.56 1.03 —
0.407 ⬍0.001 0.803 —
1.03 2.08 1.28 —
0.243 0.004 0.239 —
1.03 1.50 1.41 —
0.121 0.013 0.017 —
0.93 1.08
0.051 0.057
0.99 1.02
0.807 0.440
0.92 1.24
0.151 ⬍0.001
0.97 1.03
0.420 0.452
0.081 0.542 0.075
1.09 1.08 1.00
0.087 0.043 0.982
1.09 1.04 1.03
0.030 0.131 0.120
0.87 0.96 1.08
0.039 0.416 0.079
1.10 1.05 0.98
0.078 0.210 0.510
3.52 1.62 8.20 4.54 2.17
0.002 0.560 0.005 0.010 0.300
2.90 3.70 9.78 2.82 5.13
⬍0.001 0.011 ⬍0.001 0.026 ⬍0.001
1.81 1.80 3.13 — —
0.004 0.031 ⬍0.001 — —
2.99 1.21 6.11 — —
0.014 0.829 0.021 — —
1.59 3.28 5.56 — —
0.125 0.024 0.001 — —
0.88 1.00 0.99
0.083 0.978 0.936
0.90 0.84 0.79
0.022 0.003 ⬍0.001
0.92 0.93 0.90
0.012 0.121 0.100
0.89 1.02 1.02
0.121 0.843 0.905
0.94 0.89 0.82
0.225 0.069 0.008
(continued on next page)
0.343 0.419 0.864 0.266 1.05 1.10 0.94 1.01 0.266 0.280 0.173 0.606 0.92 0.83 0.55 1.00 0.053 0.183 0.307 0.966 1.07 1.12 1.30 1.00 Bolded odds ratios are statistically significant at the p⬍0.05 level. Adjusted only for sociodemographics: age, race, and socioeconomic status. Adjusted for Time 1 outcomes, Time 1 weight status, and sociodemographics. d Moderate-to-vigorous physical activity. c
b
a
1.01 1.00 0.99 1.01 0.91 0.80 0.56 1.01 1.00 0.95 1.19 1.00
0.945 0.464 0.404 0.133
0.200 0.199 0.174 0.470
0.907 0.997 0.977 0.097
0.373 0.181 0.782 0.643 0.95 0.88 0.94 0.83 0.849 0.160 0.743 0.901 1.01 1.15 1.11 0.93 0.098 0.270 0.508 0.946 1.06 1.06 0.91 1.02 0.96 0.84 1.14 0.98 1.02 1.12 1.10 1.13
Fruit/vegetable intake (times/week) Fast food (times/week) Sugared beverages (servings/day) Diet soda pop (servings/day) Physical activity/inactivity MVPAd (hours/week) Team sports (number) Weight-related sports (yes/no) Sedentary behaviors (hours/week)
1.04 0.97 1.00 1.47
0.171 0.521 0.997 0.054
0.760 0.225 0.754 0.832
0.470 0.057 0.519 0.962
p value OR p value OR p value OR p value OR p value OR p value OR
Extreme weight control Overweight status
Binge-eating
Extreme weight control
Overweight status
Binge-eating
Fully adjustedc Partially adjustedb Table 2. (continued) November 2007
different weight-related outcomes and on mediating variables such as body satisfaction will inform the understanding of shared risk and protective factors and how best to intervene to address multiple weightrelated outcomes. Findings from the current study provide justification for the implementation of interventions addressing weight-related problems in adolescents and suggest a need for interventions that target multiple weightrelated outcomes. The findings further provide direction for the design and implementation of such interventions and suggest a need for decreasing weight-related pressures within an adolescent’s social environment, decreasing weight concerns, and decreasing unhealthy weight control practices while promoting healthier alternatives. These findings suggest that it may be effective to implement interventions that encourage adolescents and their parents to avoid talking about dieting and weight, not allow any weight jokes at home, refrain from purchasing and reading magazines that focus on weight loss, appreciate the positive aspects of their bodies, and stay away from unhealthy weight-control practices. Support for a lifestyle that is based around healthful eating and physical activity behaviors, and not around weight per se, may prove to be most effective in decreasing the high prevalence of overweight youth, without leading to an increase in an unhealthy weight preoccupation and disordered eating behaviors. This study was supported by Grant R40 MC 00319 from the Maternal and Child Health Bureau (Title V, Social Security Act), Health Resources and Services Administration, Department of Health and Human Services (D. Neumark-Sztainer, Principal Investigator). No financial disclosures were reported by the authors of this paper.
References 1. Ogden CL, Carroll MD, Curtin LR, McDowell MA, Tabak CJ, Flegal KM. Prevalence of overweight and obesity in the United States, 1999 –2004. JAMA 2006;295:1549 –55. 2. Johnson JG, Cohen P, Kasen S, Brook JS. Childhood adversities associated with risk for eating disorders or weight problems during adolescence or early adulthood. Am J Psychiatry 2002;159:394 – 400. 3. Fagot-Campagna A, Pettitt DJ, Engelgau MM, et al. Type 2 diabetes among North American children and adolescents: An epidemiologic review and a public health perspective. J Pediatr 2000;136:664 –72. 4. Fairburn CG, Harrison PJ. Eating disorders. Lancet 2003;361:407–16. 5. Hoek H, van Hoeken D. Review of the prevalence and incidence of eating disorders. Int J Eat Disord 2003;34:383–96. 6. Misra M, Aggarwal A, Miller KK, et al. Effects of anorexia nervosa on clinical, hematologic, biochemical, and bone density parameters in communitydwelling adolescent girls. Pediatrics 2004;114:1574 – 83. 7. Neumark-Sztainer D, Story M, Hannan PJ, Croll J. Overweight status and eating patterns among adolescents: Where do youth stand in comparison to the Healthy People 2010 Objectives? Am J Public Health 2002;92:844 –51. 8. Neumark-Sztainer D, Story M, Hannan PJ, Perry CL, Irving LM. Weightrelated concerns and behaviors among overweight and non-overweight adolescents: Implications for preventing weight-related disorders. Arch Pediatr Adolesc Med 2002;156:171– 8.
Am J Prev Med 2007;33(5)
367
9. Neumark-Sztainer D, Wall M, Eisenberg ME, Story M, Hannan PJ. Overweight status and weight control behaviors in adolescents: Longitudinal and secular trends from 1999 –2004. Prev Med 2006;43:52–9. 10. Irving LM, Neumark-Sztainer D. Integrating primary prevention of eating disorders and obesity: Feasible or futile? Prev Med 2002;34:299 –309. 11. Neumark-Sztainer D. Obesity and eating disorder prevention: An integrated approach? Adolesc Med 2003;14:159 –73. 12. Neumark-Sztainer D. Preventing the broad spectrum of weight-related problems: working with parents to help teens achieve a healthy weight and a positive body image. J Nutr Educ Behav 2005;37(Suppl 2):133– 40. 13. Neumark-Sztainer D. Can we simultaneously work toward the prevention of obesity and eating disorders in children and adolescents. Int J Eat Disord 2005;38:220 –7. 14. Haines J, Neumark-Sztainer D. Prevention of obesity and eating disorders: A consideration of shared risk factors. Health Educ Res 2006;21:770 – 82. 15. Perry C. Creating health behavior change: How to develop community-wide programs for youth. Thousand Oaks CA: Sage Publications, 1999. 16. Shisslak CM, Crago M, Estes SL. The spectrum of eating disturbances. Int J Eat Disord 1995;18:209 –19. 17. Patton GC, Selzer R, Coffey C, Carlin JB, Wolfe R. Onset of adolescent eating disorders: Population-based cohort study over 3 years. BMJ 1999;318:765– 8. 18. Santonastaso P, Friederici S, Favaro A. Full and partial syndromes in eating disorders: A 1-year prospective study of risk factors among female students. Psychopathology 1999;32:50 – 6. 19. Stice E. A prospective test of the dual-pathway model of bulimic pathology: Mediating effects of dieting and negative affect. J Abnorm Psychol 2001; 110:124 –35. 20. Killen JD, Taylor CB, Hayward C, et al. Weight concerns influence the development of eating disorders: A 4-year prospective study. J Consult Clin Psychol 1996;64:936 –940. 21. Stice E, Presnell K, Shaw H, Rohde P. Psychological and behavioral risk factors for obesity onset in adolescent girls: A prospective study. J Consult Clin Psychol 2005;73:195–202. 22. van den Berg P, Neumark-Sztainer D, Hannan PJ, Haines J. Dieting advice from magazines– helpful or harmful? Five year associations with weightcontrol behaviors and psychological outcomes in adolescents. Pediatrics 2007;119:e30 –7. 23. Utter J, Neumark-Sztainer D, Wall M, Story M. Reading magazine articles about dieting and associated weight control behaviors among adolescents. J Adolesc Health 2003;32:78 – 82. 24. Gortmaker SL, Peterson K, Wiecha J, et al. Reducing obesity via a school-based interdisciplinary intervention among youth: Planet Health. Arch Pediatr Adolesc Med 1999;153:409 –18. 25. Dwyer JT, Stone EJ, Yang M, et al. Predictors of overweight and overfatness in a multiethnic pediatric population. Am J Clin Nutr 1998;67:602–10. 26. Robinson TN. Reducing children’s television viewing to prevent obesity: A randomized controlled trial. JAMA 1999;282:1561–7. 27. Summerbell C, Waters E, Edmunds L, Kelly S, Brown T, Campbell K. Interventions for preventing obesity in children. Cochrane Database Syst Rev 2005;(3):CD001871. 28. Stice E, Shaw H. Eating disorder prevention programs: A meta-analytic review. Psychol Bull 2004;130:206 –27. 29. Neumark-Sztainer D, Story M, Perry C, Casey MA. Factors influencing food choices of adolescents: Findings from focus-group discussions with adolescents. J Am Diet Assoc 1999;99:929 –37. 30. Bandura A. Social learning theory. Englewood Cliffs NJ: Prentice Hall, 1977. 31. Bandura A. Social foundations of thought and action: A social cognitive theory. Englewood Cliffs NJ: Prentice-Hall, 1986. 32. Neumark-Sztainer D, Story M, Resnick MD, Blum RW. Lessons learned about adolescent nutrition from the Minnesota Adolescent Health Survey. J Am Diet Assoc 1998;98:1449 –56. 33. Yanovski SZ. Questionnaire on eating and weight patterns-revised (QEWP-R). Obes Res 1993;1:319 –24. 34. Pingitore R, Spring B, Garfield D. Gender differences in body satisfaction. Obes Res 1997;5:402–9. 35. Blum RW, Harmon B, Harris L, Bergeisen L, Resnick MD. American Indian-Alaska Native youth health. JAMA 1992;267:1637– 44. 36. Jeffery RW, French SA. Preventing weight gain in adults: The pound of prevention study. Am J Public Health 1999;89:747–51. 37. Must A, Dallal GE, Dietz WH. Reference data for obesity: 85th and 95th percentiles of body mass index (wt/ht2) and tricep skinfold thickness. Am J Clin Nutr 1991;53:839 – 46.
368
38. Must A, Dallal GE, Dietz WH. Reference data for obesity: 85th and 95th percentiles of body mass index (wt/ht2)—A correction. Am J Clin Nutr 1991;54:773. 39. Yanovski SZ. Binge eating disorder: Current knowledge and future directions. Obes Res 1993;1:306 –24. 40. Neumark-Sztainer D, Croll J, Story M, Hannan PJ, French S, Perry C. Ethnic/racial differences in weight-related concerns and behaviors among adolescent girls and boys: Findings from Project EAT. J Psychosom Res 2002;53:963–74. 41. Thompson JK, Cattarin J, Fowler B, Fisher E. The Perception of Teasing Scale (POTS): A revision and extension of the Physical Appearance Related Teasing Scale (PARTS). J Pers Assess 1995;65:146 –57. 42. Utter J, Neumark-Sztainer D, Jeffery R, Story M. Couch potatoes or french fries: Are sedentary behaviors associated with body mass index, physical activity, and dietary behaviors among adolescents? J Am Diet Assoc 2003; 103:1298 –305. 43. Kandel DB, Davies M. Epidemiology of depressive mood in adolescents: An empiric study. Arch Gen Psychiatry 1982;39:1205–12. 44. Rosenberg M. Society and the adolescent self image. Princeton NJ: Princeton University Press, 1965. 45. Rockett HRH, Breitenbach MA, Frazier AL, et al. Validation of a youth/ adolescent food frequency questionnaire. Prev Med 1997;26:808 –16. 46. Rockett HR, Wolf AM, Colditz GA. Development and reproducibility of a food frequency questionnaire to assess diets of older children and adolescents. J Am Diet Assoc 1995;95:336 – 40. 47. Sallis JF, Buono MJ, Roby JJ, Micale FG, Nelson JA. Seven-day recall and other physical activity self-reports in children and adolescents. Med Sci Sports Exerc 1993;25:99 –108. 48. Godin G, Shephard RJ. A simple method to assess exercise behavior in the community. Can J Appl Sport Sci 1985;10:141– 6. 49. Godin Leisure-Time Exercise Questionnaire. Med Sci Sports Exerc 1997; 29:S36 –38. 50. Brener ND, Collins JL, Kann L, Warren CW, Williams BI. Reliability of the youth risk behavior survey questionnaire. Am J Epidemiol 1995;141: 575– 80. 51. Little RJA. Survey nonresponse adjustments for estimates of means. Int Stat Rev 1986;54:137–9. 52. Grunbaum JA, Kann L, Kinchen S, et al. Youth Risk Behavior Surveillance–– United States, 2003. MMWR Surveill Summ 2004;53(SS-2):1–29. 53. Shisslak CM, Crago M, McKnight KM, Estes LS, Gray N, Parnaby OG. Potential risk factors associated with weight control behaviors in elementary and middle school girls. J Psychosom Res 1998;44:301–13. 54. Levine MP, Smolak L, Hayden H. The relation of sociocultural factors to eating attitudes and behaviors among middle-school girls. J Early Adolesc 1994;14:471–90. 55. Wertheim E, Koerner J, Paxton S. Longitudinal predictors of restrictive eating and bulimic tendencies in three different age groups of adolescent girls. J Youth Adolesc 2001;30:69 – 81. 56. McCabe MP, Ricciardelli LA. A prospective study of pressures from parents, peers, and the media on extreme weight change behaviors among adolescent boys and girls. Behav Res Ther 2005;43:653– 68. 57. Stice E, Shaw HE. Role of body dissatisfaction in the onset and maintenance of eating pathology: a synthesis of research findings. J Psychosom Res 2002;53:985–93. 58. Stice E, Agras WS. Predicting onset and cessation of bulimic behaviors during adolescence: A longitudinal grouping analyses. Behav Therap 1998;29:257–76. 59. Stice E, Cameron RP, Killen JD, Hayward C, Taylor CB. Naturalistic weight-reduction efforts prospectively predict growth in relative weight and onset of obesity among female adolescents. J Consult Clin Psychol 1999; 67:967–74. 60. Field AE, Austin SB, Taylor CB, et al. Relation between dieting and weight change among preadolescents and adolescents. Pediatrics 2003;112:900 – 6. 61. Stice E. Risk and maintenance factors for eating pathology: A meta-analytic review. Psychol Bull 2002;128:825– 48. 62. Mellin AE, Neumark-Sztainer D, Patterson J, Sockalosky J. Unhealthy weight management behavior among adolescent girls with type 1 diabetes mellitus: The role of familial eating patterns and weight-related concerns. J Adolesc Health 2004;35:278 – 89. 63. Ackard D, Neumark-Sztainer D. Family mealtime while growing up: Associations with symptoms of bulimia nervosa. Eat Disord 2001;9:239 – 49. 64. Boutelle K, Neumark-Sztainer D, Story M, Resnick M. Weight control behaviors among obese, overweight, and nonoverweight adolescents. J Pediatr Psychol 2002;27:531– 40. 65. Siega-Riz AM, Popkin BM, Carson T. Trends in breakfast consumption
American Journal of Preventive Medicine, Volume 33, Number 5
www.ajpm-online.net
for children in the United States from 1965–1991. Am J Clin Nutr 1998;67:748S–756S. 66. Fiore H, Travis S, Whalen A, Auinger P, Ryan S. Potentially protective factors associated with healthful body mass index in adolescents with obese and nonobese parents: A secondary data analysis of the third national
November 2007
health and nutrition examination survey, 1988 –1994. J Am Diet Assoc 2006;106:55– 64. 67. Himes JH, Hannan P, Wall M, Neumark-Sztainer D. Factors associated with errors in self-reports of stature, weight, and body mass index in Minnesota adolescents. Ann Epidemiol 2005;15:272–278.
Am J Prev Med 2007;33(5)
369
Appendix. Description of Measures Variables WEIGHT-RELATED OUTCOMES Overweight status Binge eating with loss of control
Extreme weight-control behaviors
SOCIOENVIRONMENTAL VARIABLES Weight-related norms Maternal/paternal weight concerns/ behaviors Peer dieting behaviors Weight-teasing by family members
Weight-teasing by peers Media exposure Magazines on weight loss Television viewing Home food environment Family meal frequency Family meal atmosphere
Healthy food availability
Relationships Family connectedness Friend connectedness PERSONAL VARIABLES Body image and weight concerns Body satisfaction
Weight concern
369.e1
Description of survey item(s) Height and weight were self-reported and body mass index (BMI; kg/m2) was calculated. Adolescents with BMI values above the 85th percentile for gender and age were classified as overweight.1,2 “In the past year, have you ever eaten so much food in a short period of time that you would be embarrassed if others saw you (binge eating)?” and “During the times when you ate this way did you feel you couldn’t stop eating or control what or how much you were eating?” Respondents who answered affirmatively to both of these questions were classified as engaging in binge eating with loss of control.3 “Have you done any of the following things in order to lose weight or keep from gaining weight in the past year?” (1) used laxatives, (2) took diet pills, (3) made myself vomit, and (4) used diuretics. Respondents were categorized as having used extreme weight-control behaviors if they reported any of these behaviors.4 “My mother (father) diets to lose weight or keep from gaining weight.” “My mother (father) encourages me to diet to control my weight.” Four responses ranged from “not at all” to “very much.” Cronbach’s alpha⫽0.77. “Many of my friends diet to lose weight or keep from gaining weight.” Four responses ranged from “not at all” to “very much.” “Have you ever been teased or made fun of by family members because of your weight? If so, how much did this bother you?” Respondents who indicated they had been teased and also bothered by family members teasing them were categorized as having been teased.5 Same questions as above about teasing by other kids. “How often do you read magazine articles in which dieting or weight loss are discussed?” Four response categories ranged from “never” to “often.” “In your free time on an average weekday (Monday–Friday), how many hours do you spend watching TV and videos?” A similar question was asked about weekend use.6,7 “During the past 7 days, how many times did all, or most, of your family living in your house eat a meal together?” “How strongly do you agree with the following statements? (1) I enjoy eating meals with my family; (2) In my family, eating brings people together in an enjoyable way; (3) In my family, mealtime is a time for talking with other family members; and (4) In my family, dinner time is about more than just getting food, we all talk with each other.” Cronbach’s alpha⫽0.73. “How often are the following true? (1) Fruits and vegetables are available in my home; (2) Milk is served at meals at my home; (3) We have fruit juice in my home; (4) Vegetables are served at dinner in my home.” Cronbach’s alpha⫽0.63. “How much do you feel you can talk to your mother (father) about your problems?” “How much do you feel your mother (father) cares about you?” Five response categories. Cronbach’s alpha⫽0.69. “Do you have one or more close friends who you can talk to about your problems?” Response categories were “yes, always,” “yes, sometimes,” and “no.” Body satisfaction scale including 10 items assessing satisfaction with different body parts (height, weight, body shape, waist, hips, thighs, stomach, face, body build, shoulders). Five response categories. Cronbach’s alpha⫽0.92.8 “How strongly do you agree with the following statements? (1) I think a lot about being thinner, and (2) I am worried about gaining weight.” Cronbach’s alpha⫽0.85.
American Journal of Preventive Medicine, Volume 33, Number 5
Variables Weight importance
Psychological wellbeing Depressive symptoms Self-esteem Nutritional knowledge/attitudes Nutritional knowledge Perceived benefits of healthy eating
Self-efficacy for healthy eating
BEHAVIORAL VARIABLES Weight-control practices Dieting Healthy weight-control behaviors
Unhealthy weight-control behaviors
Eating patterns Breakfast frequency Lunch frequency Dinner frequency Fast food Dietary intake Physical activity Moderate-to-vigorous physical activity Number of team sports Weight-related sports participation Sedentary behavior
DEMOGRAPHIC VARIABLES Gender Ethnicity/race
Description of survey item(s) “During the past 6 months, how important has your weight or shape been in how you feel about yourself?” Four responses ranging from “weight and shape were not very important” to “weight and shape were the most important things that affected how I felt about myself.”3 Kandel and Davies’ (1982) six-item scale assessing depressive mood. Cronbach’s alpha⫽0.82.9 Shortened six-item version of Rosenberg’s Self-Esteem Scale. Cronbach’s alpha⫽0.79.10 “For each question below, please select the food you think is better for your health.” Seven pairs of food items (e.g., pretzels and potato chips). Cronbach’s alpha⫽0.63. “The types of food I eat affect . . . (1) my health, (2) how I look, (3) my weight, (4) how well I do in sports, and (5) how well I do in school.” Four responses ranged from “strongly disagree” to “strongly agree.” Cronbach’s alpha⫽0.83. “If you wanted to, how sure are you that you could eat healthy food when you are . . . (1) stressed out, (2) feeling down, and (3) bored?” Six responses ranging from “not at all sure” to “very sure.” Cronbach’s alpha⫽0.85. “How often have you gone on a diet in the past year? By ‘diet’ we mean changing the way you eat so you can lose weight.” Responses were categorized dichotomously. “Have you done any of the following things in order to lose weight or keep from gaining weight during the past year? (1) exercise, (2) ate more fruits and vegetables, (3) ate less high-fat foods, (4) ate less sweets.” Respondents were categorized as having used only healthy weight-control behaviors if they used any of these behaviors but did not use any unhealthy or extreme weight-control behaviors. “Have you done any of the following things in order to lose weight or keep from gaining weight during the past year? (1) fasted; (2) ate very little food; (3) used food substitute (e.g., Slim-Fast); (4) skipped meals; or (5) smoked more cigarettes.” “During the past week, how many days did you eat breakfast?” “During the past week, how many days did you eat lunch?” “During the past week, how many days did you eat dinner?” “In the past week, how often did you eat something from a fast food restaurant (like McDonald’s, Burger King, Hardee’s etc)?” Intake of fruits and vegetables, sugar-sweetened beverages, and diet soda were assessed with the 149-item, semiquantitative Youth and Adolescent Food Frequency Questionnaire.11,12 Modified version of the Leisure-time Exercise Questionnaire.13–15 Two questions assessed hours spent in strenuous or moderate physical activity behaviors in a usual week. “During the past 12 months, on how many sports teams did you play?” Four response categories ranging from “0 teams” to “3 or more teams.”16 “Are you in a sport or activity where it’s important to stay a certain weight (wrestling, gymnastics, ballet, etc.)?” (yes/no) “In your free time on an average weekday (Monday-Friday), how many hours do you spend. . . . (1) watching TV and videos; (2) reading or doing homework; or (3) using a computer (not for homework)?” Similar questions were asked for an average weekend day (Saturday or Sunday).6,7 Are you . . . (1) male (2) female “Do you think of yourself as . . . white, black or African American, Hispanic or Latino, Asian American, Hawaiian or Pacific Islander, or American Indian or Native American.” Subjects could choose more than one category; those responses indicating multiple categories were coded as “mixed/other”.
Am J Prev Med 2007;33(5)
369.e2
Variables
Description of survey item(s)
Age Socioeconomic status
What is your age? Composite variable based primarily on parental level of education, defined by the higher level of either parent. In cases of missing data on educational level for both parents other variables used included eligibility for public assistance, eligibility for free or reduced-cost school meals, and parental employment status.17
Appendix References
8. Pingitore R, Spring B, Garfield D. Gender differences in body satisfaction. Obes Res 1997;5:402–9. 9. Kandel DB, Davies M. Epidemiology of depressive mood in adolescents: An empirical study. Arch Gen Psychiatry 1982;39:1205–12. 10. Rosenberg M. Society and the Adolescent Self Image. Princeton NJ: Princeton University Press, 1965. 11. Rockett HRH, Breitenbach MA, Frazier AL, et al. Validation of a youth/ adolescent food frequency questionnaire. Prev Med 1997;26:808 –16. 12. Rockett HR, Wolf AM, Colditz GA. Development and reproducibility of a food frequency questionnaire to assess diets of older children and adolescents. J Am Diet Assoc 1995;95:336 – 40. 13. Sallis JF, Buono MJ, Roby JJ, Micale FG, Nelson JA. Seven-day recall and other physical activity self-reports in children and adolescents. Med Sci Sports Exerc 1993;25:99 –108. 14. Godin G, Shephard RJ. A simple method to assess exercise behavior in the community. Can J Appl Sport Sci 1985;10:141– 6. 15. Godin Leisure-Time Exercise Questionnaire. Med Sci Sports Exerc 1997; 29:S36 –38. 16. Brener ND, Collins JL, Kann L, Warren CW, Williams BI. Reliability of the Youth Risk Behavior Survey Questionnaire. Am J Epidemiol 1995;141: 575– 80. 17. Neumark-Sztainer D, Story M, Hannan PJ, Croll J. Overweight status and eating patterns among adolescents: Where do youth stand in comparison to the Healthy People 2010 objectives? Am J Public Health 2002;92:844 –51.
1. Must A, Dallal GE, Dietz WH. Reference data for obesity: 85th and 95th percentiles of body mass index (wt/ht2) and tricep skinfold thickness. Am J Clin Nutr 1991;53:839 – 46. 2. Must A, Dallal GE, Dietz WH. Reference data for obesity: 85th and 95th percentiles of body mass index (wt/ht2)—A correction. Am J Clin Nutr 1991;54:773. 3. Yanovski SZ. Binge eating disorder: Current knowledge and future directions. Obes Res 1993;1:306 –24. 4. Neumark-Sztainer D, Croll J, Story M, Hannan PJ, French S, Perry C. Ethnic/racial differences in weight-related concerns and behaviors among adolescent girls and boys: Findings from Project EAT. J Psychosom Res 2002;53:963–74. 5. Thompson JK, Cattarin J, Fowler B, Fisher E. The Perception of Teasing Scale (POTS): A revision and extension of the Physical Appearance Related Teasing Scale (PARTS). J Pers Assess 1995;65:146 –57. 6. Gortmaker SL, Peterson K, Wiecha J, et al. Reducing obesity via a school-based interdisciplinary intervention among youth: Planet Health. Arch Pediatr Adolesc Med 1999;153:409 –18. 7. Utter J, Neumark-Sztainer D, Jeffery R, Story M. Couch potatoes or french fries: Are sedentary behaviors associated with body mass index, physical activity, and dietary behaviors among adolescents? J Am Diet Assoc 2003;103:1298 –305.
369.e3
American Journal of Preventive Medicine, Volume 33, Number 5