J Rehabil Med 2013; 45: 123–129
ORIGINAL REPORT
Reliability of the 12-Step Ascend and Descend Test and its Correlation with Motor Function in People with Chronic Stroke Shamay S. Ng, PhD, Hannah H. Ng, BSc(Hons), Kimmy M. Chan, BSc(Hons), Julia C. Lai, BSc(Hons), Ann K. To, BSc(Hons) and Cindy W. Yeung, BSc(Hons) From the Department of Rehabilitation Sciences, The Hong Kong Polytechnic University, Hong Kong (SAR), China
Objective: To investigate: (i) the intra-rater, inter-rater and test-retest reliability of the 12-step stair test; (ii) its correlation with other stroke-specific impairments; and (iii) the cutoff scores that best discriminate patients with stroke from healthy elderly subjects. Design: Cross-sectional study. Setting: University-based rehabilitation centre. Subjects: Thirty-five subjects with chronic stroke and 29 healthy elderly subjects. Methods: The 12-step ascend and descend test was administered along with the Fugl-Meyer Motor Assessment for the lower extremities (FMA-LE), hand-held dynamometer measurements of hip abductor and knee extensor muscle strength, the Five Times Sit to Stand Test (FTSTST), assessment using the Berg Balance Scale (BBS), activities-specific balance confidence scale (ABC) assessment, the 10-metre walk test, and the Timed “Up and Go” (TUG) test. Results: The 12-step ascend and descend test showed excellent intra-rater, inter-rater and test-retest reliability. The test was positively correlated with FTSTST times, gait velocity, and TUG times, and negatively correlated with FMA-LE scores and BBS scores. A test performance of 15.22 seconds or less was shown reliably to discriminate healthy elderly subjects from stroke survivors. Conclusion: The 12-step ascend and descend test is a reliable clinical test that is inexpensive and easy to implement, and is useful for assessing the stair-walking ability of patients with chronic stroke. Key words: stroke; walking; outcomes measures; rehabilitation. J Rehabil Med 2013; 45: 123–129 Correspondence address: Shamay S.M. Ng, Department of Rehabilitation Sciences, The Hong Kong Polytechnic University, Hong Kong (SAR), China. E-mail:
[email protected] Submitted May 23, 2012; accepted August 29, 2012 INTRODUCTION Stair-walking has been rated as the most difficult and troubling daily motor activity for stroke survivors (1, 2). It is also considered the best predictor of free-living physical activity for community-dwelling people with stroke (3). Stair-walking ability alone predicts 48% of the variance in the daily duration
of time on the feet and 58% of that in activity frequency (3). Reduced mobility, including stair-walking speed, is commonly reported (3), and measuring stair-walking ability is a crucial element in stroke rehabilitation. Testing the stair-walking ability of patients with stroke is inexpensive and easy to administer, so it is widely used in clinical settings. Measurements of stair ascending and descending ability are included in the Motor Assessment Scale (4, 5) and the Barthel Index (4, 5), and this particular item has also been used separately as an independent outcome measure for patients with stroke (6). Two-step, 3-step, 11-step and 12-step stair tests have been developed (7–11). Excellent reliability had been reported with different patient groups, including patients with stroke (7, 8) or total knee replacement (9), frail elderly people (10) and healthy elderly people (11). In a chronic stroke population, Faria et al. (7) reported excellent intra-rater (intraclass correlation coefficient (ICC) range, 0.93–0.96) and inter-rater (ICC range, 0.94–0.97) reliability with an 11-step stair ascend/ descend test. Flansbjer’s group (8) also reported excellent test-retest reliability (ICC = 0.98) with stroke patients for the 12-step stair test. A group led by Almeida (9) reported excellent inter-rater reliability (ICC = 0.94) using an 11-step stair test with patients after total knee replacement. Jette et al. (10) have reported moderate test-retest reliability (ICC = 0.54) with the frail elderly using a 2-step stair test, but Panzer’s group (11) reported rather better test–retest reliability (ICC = 0.63) using a 3-step descent with healthy elderly subjects. Although the reliability of stair testing with stroke survivors has been studied previously (7, 8), there have been no published studies that have attempted to find a correlation between stair-walking ability and stroke-specific impairment assessments, nor has there been any published investigation of the best cut-off score in a 12-step ascend and descend test for discriminating patients with chronic stroke from healthy elderly subjects. The objectives of this study were: (i) to assess the intra-rater, inter-rater and test-retest reliability of a 12-step ascend and descend test; (ii) to explore any correlation between 12-step ascend and descend test performance and other more strokespecific indicators including the Fugl-Meyer lower extremity assessment (FMA-LE), leg strength, 5 times sit-to-stand test
© 2013 The Authors. doi: 10.2340/16501977-1086 Journal Compilation © 2013 Foundation of Rehabilitation Information. ISSN 1650-1977
J Rehabil Med 45
124
S. S. Ng et al.
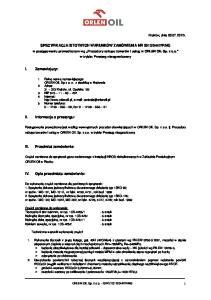
(FTSTST) time, Berg Balance Scale (BBS) score, Activitiesspecific Balance Confidence scale (ABC) score, gait velocity and Timed “Up and Go” test (TUG) time; and (3) to determine the cut-off scores best discriminating patients with stroke from healthy elderly subjects. METHODS Participants This was a cross-sectional study. A sample size of 29 subjects per group was required to achieve 80% power to detect an intra-class correlation coefficient (ICC) of 0.95 at a confidence level of 0.05. A total of 35 people with chronic stroke (27 men, 8 women; mean age 57.26 years (standard deviation (SD) 7.19) ) with a mean duration of 5.80 (SD 2.82) years post-stroke were recruited along with 29 healthy elderly persons (19 men, 10 women; mean age 57.76 years (SD 5.77) ) to participate in the study. The stroke subjects were recruited from a local self-help group for patients with stroke. The healthy subjects were recruited from the community using convenience sampling. Subjects with stroke were included if: (i) they had experienced a single stroke at least 1 year previously; (ii) were able to walk more than 10 metres and climb a flight of 12 stairs independently (with or without a walking aid); (iii) had an Abbreviated Mental Test score of 7 or higher; and (iv) were in generally stable medical condition that allowed them to participate in the testing protocol. Candidates were excluded if they had experienced other neurological conditions aside from stroke, such as Parkinson’s disease, or co-morbid disabilities, such as visual impairment or arthritis, that would affect proper assessment. Age-matched healthy elderly subjects were recruited if they were able to walk 10 m and negotiate a flight of 12 stairs independently with or without an assistive device, and could understand instructions. The ethics committee of the local institution approved the study protocols as meeting all of the guidelines set by the Declaration of Helsinki. Before testing began, all eligible individuals were informed about the purpose and procedures of the study and gave their written consent. Procedures The stroke subjects were tested in two separate sessions 7–10 days apart. In addition to the 12-step ascend and descend test they were required to complete the FMA-LE, a lower limb muscle strength assessment, the FTSTST, a BBS assessment, an ABC scale assessment, the 10-m walking test and the TUG test. The order of testing was randomized by drawing cards. Two min of rest was allowed after each test in order to minimize any effect of fatigue. Each session lasted approximately 1.5 h. The data collection procedures are illustrated in Fig 1. The healthy subjects were tested in one session and were only required to perform the step test, the TUG test and the FTSTST in random order. The testing session lasted approximately 30 min. Outcome measures All outcome measures were recorded by two trained, independent examiners (A and B), and each examiner was blinded to the other’s results. Twelve-step Ascend and Descend Test. The test was administered using a set of 12 steps 14 cm high, 30 cm deep and 153 cm wide with handrails on both sides. The test began with the subject standing behind a marked line 27 cm away from the first step, with one hand (selfselected) on the handrail if he or she felt it necessary to ensure safety. On one rater’s “go” the subject climbed the stairs, turned around on the top platform, and descended using the other handrail (e.g. right-hand up, right-hand down). The subjects were instructed to complete the task at their “comfortable” speed. The ascending time (STUp-12) was recorded from the rater’s “go” to the time when both of the subject’s J Rehabil Med 45
Fig. 1. Data collection procedures. feet had reached the top platform. The total ascending and descending time (STTotal-12) was recorded when both of the subject’s feet had returned to the floor. Fugl-Meyer Lower Extremity Assessment. The FMA-LE is a reliable test (12), with ICC ranging from 0.81 to 0.96 (13), designed to assess motor recovery following stroke. It was used to evaluate the impairments of the lower extremity including reflexes, movement synergies and coordination. The FMA-LE consists of 17 items and each item was scored on a 0–2 scale, giving a maximum possible score of 34 (12). The lower the score, the greater the subject’s motor impairment. Lower limb muscle strength. The maximal isometric voluntary contraction of the hip abductors and knee extensors (in kg) was tested with a Nicholas hand-held dynamometer (model 01160, Lafayette Instrument Co., Lafayette, IN, USA). Good to excellent intra-rater reliability (ICC range, 0.76–0.89) has been reported for such measurements with individuals with chronic stroke (14). During the hip abductor strength measurements the subjects were positioned in supine lying. The dynamometer was placed on the lateral aspect of the femur, 5 cm proximal to the lateral epicondyle. During the knee extensor strength measurements the subjects were positioned in a high sitting position with the hip and knee in 90º of flexion. The dynamometer was placed on the anterior aspect of the tibia, 5 cm proximal from the inferior tip of the medial malleoli. For each muscle, the mean values from 3 trials were used for data analysis. A 2-min rest was given between trials in order to prevent muscle fatigue. Five Times Sit-to-Stand Test. FTSTSTs first served as an outcome measure for functional leg strength (15). Excellent reliability (ICC range 0.97–1.00) have been reported with chronic stroke subjects (16). A standard chair 45 cm high without armrests was used for this test. Subjects were instructed to complete 5 repetitions of the sit-tostand manoeuvre as quickly as possible with their arms crossed on their chest and their back against the chair at the end of each repetition. The time taken for completing the task was recorded. The mean values from 3 trials, with one-minute rest between each trial, were used for data analysis. Berg Balance Scale Assessment. The BBS serves as a clinical test of a subject’s ability to maintain balance (17). Excellent reliability (ICC range, 0.98–0.99) has been demonstrated with stroke survivors (18). The subjects were tested on 14 tasks required in everyday living and the quality and speed of their task completion were rated by an assessor using a 5-point (0–4) scale with a maximum score of 56 (17).
Stair-walking in stroke patients Activities-specific Balance Confidence Scale. The ABC is a selfadministered, questionnaire-based tool to assess subjective balance confidence in performing a wide range of activities that involve changing position or walking, and are related to community living (19). The questionnaire covers 10 items. Its scores range from 0 to 100. High test-retest reliability (ICC = 0.85) has been reported with chronic stroke subjects (20). Ten-M Walk Test. Gait velocity was measured using the time taken to traverse a 10-m walkway. High test-retest reliability (ICC range, 0.90–0.97) has been reported with subjects with chronic stroke (8). The subjects were instructed to walk at their comfortable speed over a 14-m marked distance and were timed over the middle 10 m. Timed “Up and Go” Test. The TUG test was developed to assess the basic functional mobility of frail elderly subjects (21), and it has shown excellent reliability (ICC > 0.95) with stroke survivors (22). The subjects were required to stand up from a chair, walk 3 m, turn around, return to the chair, and sit down. The time taken to complete this task was measured. The mean values from 3 trials, with 1-min rest between each trial, were used for data analysis.
Table II. Mean values of all outcome measures in subject with stroke Observation
Mean (SD)
STUp-12, s STTotal-12, s FMA-LE Muscle strength, kg Hip abductors, affected/unaffected side Knee extensors, affected/unaffected side FTSTST, s BBS ABC scale Gait velocity, m/s TUG, s
11.39 (3.14) 25.45 (7.51) 26.60 (4.46) 15.33 (6.22)/18.09 (5.75) 16.13 (5.53)/19.20 (5.30) 20.57 (6.95) 51.46 (3.46) 75.19 (15.25) 0.88 (0.27) 15.97 (5.40)
SD: standard deviation; STUp-12: the ascending time; STTotal-12: the descending time; FMA-LE: Fugl-Meyer Motor Assessment for the lower extremities; FTSTST: Five Times Sit to Stand Test; BBS: Berg Balance Scale; ABC: activities-specific balance confidence scale; TUG: Timed “Up and Go” Test.
Statistical analysis Descriptive statistics were compiled describing the demographic characteristics of the subjects and the mean values of all the outcome measures. Data analysis was done with the help of SPSS software version 19.0 for Windows. The normality of the data was checked using Shapiro–Wilk statistics, and the homogeneity of its variance was tested with Levene’s test for quality of variance. Non-parametric analyses were performed with the variables that were not normally distributed or not homogeneous, but otherwise the analyses were parametric. ICCs were used to quantify the degree of intra-rater (ICC 3,1), inter-rater (ICC 3,2), and test-retest reliability (ICC2,1). Any correlation between the subjects’ STUp-12 and STTotal-12 times and their stroke-specific impairment scores was established in terms of Spearman’s rho. The cut-off score between healthy elderly subjects and subjects with stroke was determined by plotting the receiver operating characteristics (ROC) curve. The strength of correlation was defined as little or none (rs 0.75) (23). A significance level of 0.05 was set for all analyses.
125
RESULTS Descriptive statistics for all subjects and mean values of all outcome measures are shown in Tables I and II, respectively. Excellent intra-rater (ICC range 0.96–0.99) (Table III), inter-rater (ICC = 1.00) and test-retest reliability (ICC range 0.98–0.99) were observed (Table III). Table IV demonstrates the Spearman’s correlation analyses relating STUp-12 and STTotal-12 times with the other variables. Significant positive correlations were found with FTSTST times (STUp-12: rs = 0.50; STTotal-12: r s = 0.52), gait velocity (STUp-12: rs = 0.71; STTotal-12: rs = 0.74,) and TUG times (STUp-12: rs = 0.73; STTotal-12: rs = 0.76). Significant negative correlations were found with FMA-LE scores (STUp-12: rs = –0.80; STTotal-12: rs = –0.77) and BBS scores (STUp-12: rs = –0.68; STTotal-12: rs = –0.70). STUp-12 performance above or below 7.51 s (p ≤ 0.001) and STTotal-12 performance above or below 15.22 seconds (p ≤ 0.001) were found to best discriminate healthy elderly
Table I. Mean values of demographics in the two subject groups
Parameters
Healthy elderly Healthy elderly Stroke (n = 35) (n = 29) vs stroke Mean (SD) Mean (SD) p-value
Age, years 57.26 (7.19) 27/8 Sex, M/F, n (%) Height, cm 164.81 (7.17) Weight, kg 67.97 (9.87) Body mass index, 24.96 (2.81) kg/m2 Post-stroke duration, 5.80 (2.82) years STUp-12, s 11.39 (3.14) STTotal-12, s 25.45 (7.51) FTSTST, s 20.57 (6.95) TUG, s 15.97 (5.40)
57.76 (5.77) 19/10 164.03 (8.25) 66.95 (13.24) 24.87 (4.60) N/A 6.14 (0.75) 12.65 (2.03) 14.81 (2.56) 9.01 (1.37)
Table III. Intra-tester reliability of STUp-12 and STTotal-12 times for subjects with stroke
0.76 0.30 0.69 0.56 0.94
Rater A Day 1
N/A
Day 2