Session 3.16
Service Delivery and Local Empowerment: Turnaround of Public Utilities Sunday, March 19th, 2006 16:45-18:45, Casa Del Diesmo 4
Fourth World Water Forum México, D.F.
World Bank
Asociación Nacional de Empresas de Agua y Saneamiento
United State s Agency for International Development
BMZ/GTZ (Bundesministerium fur wirschaftliche Zusammenarbeit und Entwicklung / Deutche Gesellschaft fur Technische Zusammenarbeit)
Table of Contents Note from the chair.........................................................................................................................................4 Sao Paolo : How a Pubic Utility Went to the Stock Market to Raise Public Financing………....…………………….. 7 Turning Around the NWSC in Uganda………………………………..………………………………………….….. 10 Turning Around Water and Sanitation Services in Puerto Cortes, Honduras …………………...……………….……14 Regulating Commercial Utilities: Making a Difference in Zambia……………………….……………………………19 Mexico: The Linking Role of the State as an Enabler of Local Operating Capabilities ……………………………… 23 Publications ……………………………………………………………………………………………………………32
Session Conveners World Bank Meike van Ginneken and Gustavo Saltiel
ANEAS Roberto Olivares
USAID Dan Deeley BMZ/GTZ Ingo Baum
Session FT3.16 Service Delivery and Local Empowerment: Turnaround of Public Utilities
2
Note from the Chair Jamal Saghir Director Energy and Water, World Bank
Improving access to water supply and sanitation is essential for sustainable poverty reduction and economic growth. There is a consensus that increased investments in water supply and sanitation must be accompanied by reforms to sustain past and future investments. The enormous challenge to increase access to WSS requires transforming longestablished sector approaches. Urban water supply and sanitation services have traditionally been provided by state-owned, monolithic, mostly national water utilities. In the 1980s and 1990s, a new paradigm emerged to transform utilities into more modern service delivery organizations that emphasize operational and financial sustainability. In many countries, centralized providers were broken up and converted into decentralized public providers operating at the municipal level. Some utilities were able to break out of the vicious spiral of weak performance, low willingness to pay by customers, insufficient funding for maintenance, and deterioration of assets. The private sector started to play an increasing but still limited role in management of the sector. Simultaneously, some public utilities became more autonomous and accountable. A few of them have been able to attract private financing. Most people in developing countries, however, are still dependent on traditional low-performing public utilities or do not have access to piped water supply at all. Going forward it is imperative to learn from the utilities that were transformed into modern service delivery organizations. Only by understanding how they turned around, can we assist others to improve This session – utility managers and policy makers This session will feature a few of champions of public utility reform. The local turnaround stories from Brazil, Honduras, Mexico, Uganda and Zambia that will be presented in this session are proof that it can be done. In the session, we will not only have utility managers, but also hear from policy makers. In the past, many reform programs have placed an inordinate emphasis on utility reform with little or no attention to the institutional environment. This narrow view of reform often dooms programs to failure. WSS sector professionals are increasingly realizing that the vicious spiral is largely a consequence of ineffective political institutions. Services can only be improved if these institutions change. This means that governments have a central role to play in creating an environment which facilitates better utility performance. For instance, the Guanajuato State Water Commission in Mexico is an enabler of local operating capabilities under a federal normative structure. The session will focus on the relationships between utilities and their environment. What are the obstacles or opportunities utility managers face from that environment when they try to improve the performance of their own organizations? What can policy makers – at a local or central level – do to incentivize utilities to do better? How can they increase the autonomy of utilities while maintain their accountability for results? As a basis for the discussion, I would like to share a few observations with you on balancing accountabilities, the process of reform, best fit approaches, and leadership.
Session FT3.16 Service Delivery and Local Empowerment: Turnaround of Public Utilities
3
Balancing accountabilities Well-performing utilities are shielded from day to day political interference. However, they are accountable for the services they provide to policy makers and to their customers. The key to turning around public utilities is in improving the accountability framework between the utility and its environment. Autonomy starts with having considerable control to generate revenue (including tariffs covering at least operation and maintenance and autonomy to collect those revenues), and in the use of these revenues. But autonomy has to go hand in hand with accountability for results. All utilities that are discussed today raise sufficient revenues to cover their day-to-day operations. Also, all of them function within a clear accountability framework. Traditional utilities are often captured by one political actor. Often local governments combine the function of ownership with these of financing, policy making, de facto regulation, and service provision. Separating functions makes the utility accountable to a variety of actors, such as central and local governments, customers, and financial institutions. A web of accountability framework around a utility ensures that not one actor captures the utility. One way of separating functions is to set up a regulator. For instance, the National Water Supply and Sanitation Council (NWSSC) in Zambia is a statutory body that collects, analyzes and publishes performance data on utilities. Most of these utilities have been transformed into autonomous public utilities that function according to commercial principles. Thus the functions of policy making, regulation, and service delivery have been separated. The national government, the NWSSC, and the utilities each operate in their clearly established spheres of responsibility. To a large extent, financial flows determine accountability. Thus diversifying sources of financing is part and parcel of creating balanced accountability. Cost recovery is not only important for financial viability but also to make a utility more accountable to its customers. For instance, the National Water and Sewerage Company in Uganda has increased its accountability to its customers in recent hears by recovering most of it operational and capital costs through consumer tariffs. Private financiers that provide capital investment or equity can also balance the web of accountabilities. For instance, SABESP in Sao Paulo, Brazil is a public utility that went to the stock market to raise financing. This means that SABESP lines of accountability have been diversified and the utility is less prone to capture by its sole owner, the State of Sao Paulo. The commercial regulation that accompanies private finance requires minimum standards of financial management and reporting. The process of reform Reform efforts change the status quo, and inevitably face opposition from those who benefited from the status quo. Often the people who benefited from the status quo are the rich and middle class which are connected to the network. These connected customers might have an interest in maintaining the present situation in which they receive subsidized services at the expense of others. To the extent possible, it is important to pace reforms to take advantage of political windows of opportunity. Sadly, reforms are often triggered by crises, such as a drought, an unacceptable drop in service levels to customers, or a financial crisis. For instance, reforms in the state of Guanajato were triggered by several strong draughts in the early eighties which interrupted water supply in several cities. Political shifts, such as decentralization or elections, can also trigger reform. A third category of triggers include external threats and opportunities, such as a threat of privatization or external donor pressure. Timing of reform is one of the basic challenges of the sector – how to make progress within one political cycle after decades of neglect. It is important to gain buy in to some simple first steps and principles. In order to build consensus on reform, it is important to focus on reforms that create quick improvements in service provision. The presentation by the former mayor of Puerto Cortes in Honduras will shed some light on how to obtain results to keep reforms going.
Session FT3.16 Service Delivery and Local Empowerment: Turnaround of Public Utilities
4
Many reforms have failed because their goals were too ambitious or not matched by the appropriate resources. Mobilizing the financial resources for reforms requires convincing politicians that their efforts will result in benefits from water and sanitation that make sense for the country economically. It is necessary to show that the benefits of change are greater than those of the status quo. From best practice to best fit There is a substantial difference between reforms that are desirable and reforms that are feasible. Universal access to water supply and sanitation may take time to be achieved. Reforms may need to start with what can be done in practice. In other words, successful reform programs are unlikely to be perfect or entirely comprehensive. Reform – in reality – is often an incremental process. The selection of reform measures will have to be based on the best-fit rather than the best-practice. Public sector reform is difficult and intrinsically political. It is not a quick fix or an easy alternative to private sector participation. Public reform requires financial, human and knowledge resources. Efficient service delivery requires political actors to let professionals do the job right by creating an enabling environment. Leadership In the end, the initiation and, eventually, the success of the reform processes depend on people. The importance of leadership has to be stressed. Ideally, leadership will be present at all levels (central government, local government and utility). But one person or a group of people can make a difference. These champions should build coalitions and sustainable institutional frameworks to mitigate the possibility of the reforms being undone. In this session, you will hear five leaders speak about their experiences of turning around public utilities. It is hoped that these examples will generate discussion and inspire others to undertake sensible reforms so that all consumers, including the poor, will receive better services. Making a difference is within reach. Improving water supply and sanitation services is an imperative for us all.
Session FT3.16 Service Delivery and Local Empowerment: Turnaround of Public Utilities
5
Session FT3.16 Service Delivery and Local Empowerment: Turnaround of Public Utilities
6
Sao Paolo: How a Public Utility Went to the Stock Market to Raise Public Financing Dr. Dalmo Nogueira President, SABESP, Brazil
SABESP (São Paulo State Sanitation Company), the utility serving the State of São Paulo in Brazil, is one of the largest utilities in the world, serving 25 mill ion people in 368 municipalities with water supply and sewerage services. In 1994, SABESP went through a financial crisis. A new management model was adopted, based on division by catchment area. With this change, assemblies were formed for municipal representatives. This made the processes more transparent and democratic, and helped to meet the real needs of the population. The company realized that major investments were required to achieve universal water coverage and increase sewage coverage and treatment. It realized that it could not rely on funds from its major shareholder – the State of São Paulo. To attract much needed investment, the company was restructured in such a manner it could access other sources of capital. The steps toward this began by issuing local debt capital market bond. In the mean time the company continued accessing funds from local and international public agencies. In the mid to late 90´s the company sought the international capital market as a source of funds. Today, SABESP is a mixed economy, open capital company. The company operates municipal sanitary services under a concession. The São Paulo State Government is its principal shareholder, with a stake of 50.3%. The remaining 49.7% are in the hands of private stockholders. 22% of stocks are traded on the New York Stock Exchange and 27.7% of stocks are traded on the Brazilian stock exchange (Bovespa). Results are made public on a quarterly basis followed by a public held conference call, where investors, analyst and the general public have direct access to company management. Bringing SABESP to the market and exposing it to the financial community has been essential to achieve business and social goals. The accountability to multiple owners has reduced the political interference by the public owner. It has forced the company to professionalize its management and improve its corporate governance. In 2005, the company achieved water coverage of 100% with very small intermittences and has 78% of sewage coverage of which 63% is treated. In 1995, water coverage on its area of operation was 96% but with frequent intermittences. As for sewage, in 1995 sewage coverage was close to 70% and treatment below 30%.
Session FT3.16 Service Delivery and Local Empowerment: Turnaround of Public Utilities
7
A SABESP § Maior empresa de saneamento da América Latina, estando entre as maiores do mundo
§ Atendemos a Cidade de São Paulo e outros 368 dos 645 municí pios do Estado
Tema: Alternativas de Financiamento para o Saneamento
§ Nossa área de atuação cobre 60% da popula ção urbana do Estado
§ Fornecemos água para 25,6 milhões de pessoas, e prestamos serviços de esgoto para
A Experiência da Sabesp
18,2 milhões de habitantes
§ Adicionalmente, vendemos água tratada Principais Indicadores Operacionais (1)
no atacado para 6 munic í pios na Região
Água
Metropolitana de São Paulo (RMSP),
Dalmo Nogueira Filho
Liga ções (milhões)
com 3,1 milhões de pessoas adicionais
Presidente da SABESP
§ A RMSP foi responsável por 75,7% das nossas receitas de vendas e serviços prestados no primeiro semestre de em 2005.
Esgoto
6,4
4,8
Cobertura (%)
100%
Tratamento (%)
100%
Volume faturado (m3 MM)
437,0
298,2
57.559
36.593
Rede (km)
78% 63% (2)
(1) Data base 30/06/2005 (2) Esgoto tratado como percentual do esgoto coletado
1
Modernidade Financeira e Institucional
Valor Investido x Resultado Obtido
Controle acionário (1)
Investimento realizado até 2004 – R$ 13,6 bilhões a pre ços de setembro/05
21,1% 96%
96%
98%
50,3%
99%
99%
100%
100%
100%
100%
100%
99%
77%
77%
78%
75%
76%
78%
75%
61%
62%
62%
61%
63%
63%
2.780 2.551
70%
28,6%
70% 73%
75% 64%
1.845
60%
• Comprometida com a transparência e governança corporativa • Listada na NYSE em 2002 (ADR nível III)
1.024
possuem
representante
1.186 896 698
no
Conselho
758 636
34%
• Informações financeiras trimestrais (ITR) em Legislação Societ ária e reconciliação anual para US GAAP • Acionistas minoritários Administração
1.126
885
• Entrada no Novo Mercado da Bovespa em 2002
1995
de
1996
1997
1998
1999
2000
Investimentos R$ milhões constantes - IGP-DI
2001
2002
Água
2003
Coleta
2004
2005
Tratamento
2
(1) Data base 31/07/2005.
Financiamentos x Empréstimos
3
Distribuição da Divida Total
81,9% FINANCIAMENTOS
75,9%
Internacional – Mercado de Capitais
EMPRÉSTIMOS
72,6% 62,0%
63,3%
62,5%
38,0%
36,7%
37,5%
16%
46%
32,9% 25,2%
Internacional – Emp . e Financiamentos
8% 67,1%
Doméstico – Emp. e Financiamentos
27,4%
30% Dom éstico – Mercado de Capitais
18,1%
1.998
1.999
2.000
2.001
2.002
2.003
2.004
Fonte: Balanços Publicados 1998 - 2004
4
* 1 ° Semestre de 2005 – Inclui refinanciamento do Eurobônus
Session FT3.16 Service Delivery and Local Empowerment: Turnaround of Public Utilities
5
8
Acesso à Complexidade / Demora
Custos e Prazos - Empréstimos e Financiamentos Mercado de Capitais
Custo (% ao ano)
Prazo
Eurobônus
10,0% a 12,0% + Variação Cambial
5 a 7 anos
Debêntures – 8° Emissão
CDI + 1,5% e IGPM + 10,75%
4 - 5/6 anos
Roteiro para financiamento oficial Congresso Nacional
TROCADE NOTAS
Assinatura Acordo por Troca de Notas
Ministério das Relaç ões Exteriores
(Ago/03)
Presidência da Rep ública
Câmara dos Deputados Comissões
Senado Federal
Decreto Legislativo
Parecer CJ(Sabesp) Decreto Presidencial
Mensagem D.O.U
Assinatura Contratos (empé r stimo e garantias)
Fomento / Multilaterais
Custo (% ao ano)
Prazo
BID
5,9% + Variação Cambial
24 anos
BIRD
1,8% + Libor+ Variação Cambial
25 anos
JBIC
Média 2,0% + Variação Cambial
25 anos
Senado EMPRÉ STIMO
CEF (FGTS)
5,0% a 9,5%
BNDES (FAT)
3,0% + TJLP
GARANTIA DA UNIÃO
Contra Garantia do ESTADO
ESTADO
- Portaria MF 497
SABESP
Aprova ção capacidade de pagamento ESTADO STN
- Pacote Té cnico
NEGOCIA Ç ÃO DAS MINUTAS DE CONTRATOS DE EMPR É STIMO E DEGARANTIAS ACESSÓ RIAS
18 anos
Minutas enviadas pelo JBIC
Aprova ção capacidade de pagamento SABESP
SEAIN envia minuta
SABESP PGFN GESP STN
Comissão de Assuntos Econômicos
STN Autorizaç ão da Pr é- Negociaçã o
Parecer STN
BACEN
Parecer PGFN
Parecer Presidência da Rep ública
PGSP
Ministério da Fazenda
PGFNencaminha: - Parecer PGFN - Parecer PGSP - Parecer STN - Minuta final
P ré -Negocia ção
10 anos
SEAINencaminha Coment ários Finais
Negocia ção JBIC(Japão)
Minutafinal Negociada
6
Acesso à Limitado - Moroso
Condi ções de Efetividade do Contrato
Ato do Senado
JBIC
7
Alternativas - Internacionais Ø Multilaterais / Bancos Oficiais
§ § § § §
ü Endividamento Público ü Acordo Dívida (União, Estado)
IFC – Corporação Financeira Internacional - Fundo Municipal KFW – Kreditanstalt Für Wiederaufbau CAF – Coordenação Andina de Fomento NIB – Banco Nórdico de Investimento FONPLATA – Fundo Financeiro para o Desenvolvimento da Bacia do Plata
Ø Mercado Privado / Capitais
§ §
üContingenciamento de crédito ao Setor Público ü Meta
Eurobônus Sindicalizado
Formas de Captação
Superávit Primário
§ § §
Linhas de Crédito Contra Garantia Seguro de Crédito
8
9
Alternativas - Nacionais Ø
Mercado de Capitais
§ §
FIDC – Fundo de Investimento em Direitos Creditórios FII – Fundo de Investimento Imobiliário
Ø Estruturas § §
PPP – Parceria Público Privado Locação de Ativo
10
Session FT3.16 Service Delivery and Local Empowerment: Turnaround of Public Utilities
9
Session FT3.16 Service Delivery and Local Empowerment: Turnaround of Public Utilities
10
Turning around the NWSC in Uganda: Improving Efficiency, Creating Access, and Creating Financial Sustainability Dr. William Muhairwe Managing Director, National Water and Sewerage Corporation, Uganda The National Water and Sanitation Corporation (NWSC) of Uganda was created in 1972. During the 1970s and 1980s, Uganda was in public turmoil. The performance of the NWSC , like many other institutions, declined. In the late 1980s, NWSC - with donor support - embarked on major rehabilitation and expansion of its water supply and sanitation (WSS) systems. However managerial practices were not improved so poor service provision continued despite improved infrastructure. Reforms were needed to improve services. The NWSC Act of 1995 revised the utility’s objectives, powers and structure. The Act also gave NWSC a certain degree of autonomy, including the power to set tariffs. In practice, however, tariff increases must be approved by the Minister of Water, Lands and Environment. Despite legal reform, by 1998 NWSC’s performance was unsatisfactory. Unaccounted for water was high. The corporation was severely overstaffed; only three of its service areas were breaking even and NWSC could no longer service the debt that resulted from its investment boom. During 1997/8 a new Board of Directors and a new Managing Director was appointed. Having a new management team presented a rare opportunity to implement improvement strategies. In 2000, the Government of Uganda (GoU) introduced a three-year Performance Contract (PC1) with NWSC. NWSC’s debt service obligations were suspended in return for a commitment to operational and financial improvements and an increase in coverage which reflected GoU policy objectives. A 2003 second Performance Contract (PC2) continued suspension of debt service and specified that NWSC’s debt would be restructured to a sustainable level. During the period of these contracts, NWSC’s management has initiated a number of far-reaching internal reforms. More autonomy was transferred to the Area Service Providers, along with defined performance targets . In 2002, automatic tariff indexation was introduced in order to keep the tariff levels in line with inflation. In addition employee commitment was enhanced by improving internal communication and setting tougher performance targets and corresponding incentives. The Ugandan reforms have delivered results. As of July 2004, NWSC was providing water supply services to about 1.5 million people in 15 urban service areas throughout the country, including Kampala, and operating the few sewerage systems that exist. The corporation had begun to generate an operating surplus and services have been expanded and improved. Indicator Water supply coverage Unaccounted water Staff per 1000 connections Tariffs (Ushs/cubic meter)
1999 54% 42% 21 881
2003 63% 39% 11 1015
Session FT3.16 Service Delivery and Local Empowerment: Turnaround of Public Utilities
11
TURNING AROUND THE NWSC: IMPROVING EFFICIENCY, INCREASING ACCESS AND CREATING FINANCIAL SUSTAINABILITY
Content l l l l l l
BY: Dr. William Tsimwa Muhairwe Managing Director, NWSC MARCH, 2006
l l
Who Are We? Reform Drivers Strategic Corrective Action Key Tactical Strategies Implemented Main Performance Drivers Key Achievements:1998-2005 Lessons Learned Conclusion
1
Who Are We?
2
Reform Drivers (as at 1998):
NWSC is a Public Corporation wholly owned by the Government of Uganda, established in 1972 by decree No. 34
Due to poor performance:
l
Its legal position was strengthened by the enactment of NWSC Statute No. 7 of 1995 and NWSC Act of 2000.
Strengths:
l
Under the new legal framework, the powers and structure of NWSC were revised to enable the Corporation operate on a commercial and financially viable basis.
Weaknesses: Large and inefficient labour force, high UfW, (51%), Poor customer care initiatives, low collection Efficiency (71%), huge arrears of about 14 months of debt age, large number of unproductive workforce with conflicting roles etc Opportunities: Government support, relatively stable economy Threats: Debt Servicing obligations, VAT law.
l
The Corporation is mandated to manage water and sewerage services in Urban Areas under its jurisdiction (19 No.)
There was therefore urgent need to improve operational and financial performance of the NWSC
l
NWSC SWOT Analysis (1998) Sound infrastructure, abundant water sources, enabling legislative framework etc
3
Strategic Corrective Action
5
What is our Vision and Mission? Corporate Vision
l
New Board Appointed in 1998
l
New MD in turn appointed
l
Performance Contract with Government of Uganda, detailing roles and obligations
l
R e-thinking Strategies: Commercial and Customer Orientation rebirth; building on strong hardware investments undertaken since late 1980s
Corporate Mission
Management and staff aware that the ship was sinking if nothing was done!
l
l
l
The Vision of National Water and Sewerage Corporation is to be the Pride of the Water in Africa
The Mission of the Corporation is to be a Customer Oriented Organization, providing Excellent Water and Sewerage Services in a cost effective manner.
6
Session FT3.16 Service Delivery and Local Empowerment: Turnaround of Public Utilities
4
12
Key Tactical Strategies Implemented Since 1998
Key Tactical Strategies Implemented Since 1998 (Cont’d)
100 Days l Focused on reversing the operational & financial inefficiencies SEREP l Aimed at restoring customer confidence and thus service enhancement Area & Service Performance Contracts l Aimed at break-even of areas by empowering managers and giving them autonomy to take decisions. Stretch Programme l Aimed at improving operating margins (profits) by reducing bureaucracy, increasing speed, simplicity, worker involvement, and instilling self confidence
One-Minute Management l Focused on individual performance accountability, within a team Internal Delegated Area Management Contracts (IDAMCs) l Aimed at giving more autonomy to Operating Teams, clear role definition, better incentive plans and apportioning more operating risks to Operating Teams “Checkers” System l Focused on strengthening M&E for IDAMCs, emphasizing both processes and outputs Regional Networking through “External Services” • Aimed at sharing experiences with outside companies, on a cost-covering basis.
7
8
Other Strategies
Main Performance Drivers
PSP/OTHER COMMERCIALIZATION ACTIVITIES
Internal l Carefully thought programme design Ø Clear roles and responsibilities Ø Bottom-up approaches to strengthen programme ownership and support Ø SMART Targets and later on STRETCH Targets l Competition for managerial responsibility through business plan preparations and expressions of interest l Incentive systems and equitable gain sharing plans to minimize employee skirting tendencies l Tailor-made M&E arrangements and benchmarking possibilities External l Government Support: Debt Relief and Non-Interference l Donor Support: Financial assistance and technical advice l Customer and Public Confidence
l l l
l l
l
Kampala Revenue Improvement Project (KRIP): 1998 - 2001, Under Gauff J.B.G Kampala Water Supply and Sewerage Area Management Contract: 2002 - 2004: ONDEO Services. Tariff Review - Reduced connection/reconnection fees - Tariff Indexation against Inflation New Connection Policy aimed at giving free access for pipe lengths up to 50m (with a nominal fee of about US$ 30). Computerised all systems (billing, financial, procurement, payroll, voice over IP, lotus notes, customer complaints tracking, call centre etc). Introduced account-debit system with local banks, account -balance checking system with local telephone companies etc.
9
10
Key Achievements:1998-2005
Lessons Learned
(According to NWSC Audited Accounts)
§ Coverage increased from 48% to 68%
l
§ Water network coverage increased by 45% ( 850 Km of water mains extensions; 710Km from internally generated funds and 140Km from external funding)
l
§ New connections per year have increased from 3,317 No to 22,218 No per year: Hence, total number of connections are up from 50,826 to 125,000. § Unaccounted for water has reduced from 51% to 34% (Kampala is 40 % while other Areas: 16%) § Metering Efficiency has increased from 65% to 98% § Connection efficiency has improved from 63% to 91% § Annual Turnover has improved from about US$ 11M to US$30M § Operating Profit after Depreciation has improved from loss of US $ 0.4M to a surplus of US$ 2.2M
l l l l
A hardworking and committed Board of Directors with a good mix o f skills is necessary A dynamic utility management and staff team motivated by clear vision, mission and objectives is key It is necessary to sure government and donor commitment to support key initiatives like the debt freeze, payment of government debts etc More autonomy through decentralisation, strong M&E, comparative competition and financial incentive applications are key Metrics and process benchmarking with utilities in comparable environments helps in strengthening innovation Organisational behaviour change to strong customer and commercial orientation has helped improved financial viability of NWSC
11
Session FT3.16 Service Delivery and Local Empowerment: Turnaround of Public Utilities
12
13
In Conclusion l
l
Public organisations can deliver adequate performance if well managed. Management and staff of NWSC have embraced change as a constant factor and this approach has helped to ensure continuous innovation and hence increased access, efficiency gains and financial sustainability
THIS IS THE END THANK YOU FOR YOUR ATTENTION!
13
Session FT3.16 Service Delivery and Local Empowerment: Turnaround of Public Utilities
14
Turning Around the Water and Sanitation Services in Puerto Cortes in Honduras Dr. Marlon Lara Minister for the Social Investment Fund and former Mayor of Puerto Cortes, Honduras
Puerto Cortés is a port city and one of the most important economic urban areas in Honduras. Water supply services have undergone drastic changes with positive results. Before the mid 1990s, potable water services in Puerto Cortes managed by a national utility (Servicio Autónomo Nacional de Acueductos y Alcantarillados, SANAA). Performance was low and water supply coverage stood at 62%. In the mid 1990s, the responsibility for water supply services was decentralized. The transformation included a series of steps. In 1994, the Municipality of Puerto Cortes acquired control of its drinking water system. In 1995, the administration, operation and maintenance were also decentralized. A municipal water division (Dirección Municipal de Aguas de Cortés – DAMCO) was made responsible for WSS services. In 1999, the municipal water division, DAMCO, was converted into a commercial company (Aguas de Puerto Cortés – APC), the majority of shares in which were owned by the municipality. The company was created with the sole purpose of providing water supply and sanitation (WSS) services. Ownership of infrastructure remained with the municipality. APC signed an agreement with the municipality for the leasing of the WSS infrastructure. APC improved metering, introduced tariff-setting with community participation, and updated the client registry. It also reduced clandestine connections and leaks. Financing from Canada and the InterAmerican Development Bank were key in environmental protection and the institutional transformation which has made water service improvements possible. In the early 2000s, the City of Puerto Cortés sold part of its shares of APC to community organizations. The City currently keeps less than 50% of the ownership of the company. The multiple ownership arrangement has improved the accountability of APC to its customers. At present, APC has reached water supply coverage of 92% of the population. APC produces almost twice as much water per day as SANAA did in the mid 1990s (25,100 m3 compared to 14,500 m3). Service has improved from 12 hours a day to continuous 24 hours service. Unaccounted for water has decreased from 50% to 30%.
Session FT3.16 Service Delivery and Local Empowerment: Turnaround of Public Utilities
15
AGUAS DE PUERTO CORTES S.A. AGUAS DE PUERTO CORTES S.A.
PROCESOS DE DELEGACION DEL SERVICIO DE AGUA POTABLE Y SANEAMIENTO
Caso: Aguas de Puerto Cortes S.A. de C.V C.V..
AGUAS DE PUERTO CORTES S.A.
AGUAS DE PUERTO CORTES S.A.
Evolución Historica de la Empresa PRESTACION DEL SERVICIO DE AGUA POTABLE
ANTECEDENTES DE LA EMPRESA
PUERTO CORTES
•La Empresa AGUAS DE PUERTO CORTES , S.A. De C.V. Fue fundada el 25 De Octubre del año 1,999 , e inicio operaciones el 16 de Noviembre del mismo año con la finalidad de :
SANAA
DAMCO MAYO 1995 A NOV. 1999
HASTA ABRIL 1995 A.P.C.
•Administrar y operar los servicios de Agua y Saneamiento del Municipio de Puerto Cortés.
SITUACION ACTUAL
AGUAS DE PUERTO CORTES S.A.
Socio Mayoritario Municipalidad 95% SOCIOS MINORITARIOS 5% •CAMARA DE COMERCIO •CACEENP / COOMPOL •COMIXPROL / COMIXVEM 8,000 usuarios
FUTURO
SOCIO MINORITARIO 5 – 10% SOCIO MAYORITARIO SECTOR PRIVADO 90 – 95%
•NIVEL LOCAL
VENTA DE
•NIVEL NACIONAL
ACCIONES
•OPERADOR INTERNACIONAL
AGUAS DE PUERTO CORTES S.A.
NOMBRE DE SOCIO
CANTIDAD DE AFILIADOS
MPC CACEENP 6,600 COOMPOL 2,500 COMIXVEM 200 COMIXPROL 1,700 CCIPC 240 TOTAL
CAPITAL ACCIONARIO Lps.
CANTIDAD ACCIONES
% DE PARTICIPACION
95,000.00
950
20
50,000.00
500
16
50,000.00
500
16
50,000.00
500
16
50,000.00
500
16
50,000.00
500
245,000.00
3,450
Session FT3.16 Service Delivery and Local Empowerment: Turnaround of Public Utilities
16 100%
16
AGUAS DE PUERTO CORTES S.A.
AGUAS DE PUERTO CORTES S.A.
GENERALIDADES GENERALIDADES DE DE LA LA EMPRESA EMPRESA
Instalación de Medidores y Consumo por Año
1.- Numero de conexiones urbanas: 10,412 · Domestica / residencial : 9,665 · Comercial: 590 · Industrial: 53 · Publica: 104 2.- Cobertura del servicio de agua potable: El 96.5% de la población de Puerto Cortés posee el suministro de agua por medio de red, equivalente a 59,830 habitantes.
AÑO 1995
MEDIDORES
CONSUMO
EXISTENTES 188
PROMEDIO
1996
521
53
1997
839
43
1998
2870
45
1999 2000
4534 5767
38 39
2002
6395
35
2003
7453
35
2004
8,081
34
AGUAS DE PUERTO CORTES S.A.
AGUAS DE PUERTO CORTES S.A.
BENEFICIOS DEL PROCESO COSTO DE LA INVERSION MUNICIPAL EN AGUA POTABLE Y SANEAMIENTO •
Sistema de agua potable
$
4,410,000.00
• Sistema de Alcantarillado Sanitario $. 21,500,000.00 TOTAL
$
25,910,000.00
ØServicio de de agua agua potable potable continuo continuo las las veinticuatro veinticuatro horas, eficiente y de buena calidad. ØTarifas accesibles a todos los clientes, que permiten la autosostenibilidad autosostenibilidad de la empresa. ØLa Municipalidad recibe recibe de de APC APC lala cantidad cantidad dede $530,000.00 al añ o por el Canon de Arrendamiento, recursos depositados en el Fondo de Fideicomiso en un banco nacional y solamente pueden ser destinados a la inversió inversió n en el sector.
AGUAS DE PUERTO CORTES S.A.
CICLO INTEGRAL DEL PROCESO
AGUAS DE PUERTO CORTES S.A.
REPORTE DE UTILIDADES RETENIDAS 1999-2004 Lps .2,915,066.89
§Cuenca del Rió Tulian (5,088 Hectáreas) §Represas de captación (4)
DISTRIBUCION DE DIVIDENDOS SOCIO
PORCENTAJE
VALOR LPS.
MUNICIPALIDAD
95%
C.C.I.P.C.
1%
29,150.67
§Red de distribución de agua potable (67 Km.)
CACEENP
1%
29,150.67
COOMPOL
1%
29,150.67
§Red de alcantarillado sanitario (92.5 Km.)
COMIXPROL
1%
29,150.67
COMIXVEM
1%
29,150.67
§Planta de tratamiento de agua potable (280 Lt /s)
§Planta de tratamiento de aguas residuales (228 Lt /s)
Session FT3.16 Service Delivery and Local Empowerment: Turnaround of Public Utilities
2,769,313.54
17
AGUAS DE PUERTO CORTES S.A.
AGUAS DE PUERTO CORTES S.A.
Organigrama Aguas de Puerto Cortes
Junta Directiva
APC proceder á a realizar 6,400 conexiones domiciliarias para lo cual requiere el siguiente presupuesto. DETALLE DE INVERSIONES
Gerente General A .- Adquisición de Equipos
Secretaria de Gerencia
Jefe de Producción Agua Potable
Jefe de Alcantarillado Sanitario
Jefe Administrativo
Jefe Aseo Urbano
Lps. 1,067,000.00
B .- Suministro de Materiales Conexiones
4,734,000.00
C .- Mano de Obra
1,836,000.00
D .- Coordinación y Supervisión
______588,000.00
TOTAL
Lps. 8,225,000.00
AGUAS DE PUERTO CORTES S.A.
AGUAS DE PUERTO CORTES S.A.
1.- Traspaso de activos _ Camión Depurador _ Tanque Cisterna _ Vehículo con Cámara de Inspección y Accesorios _ Equipo de Bombeo Estos activos se consideraran como aportes a capital
El financiamiento se realizara por medio de un banco local, el cual será recuperado por la empresa a través de un cobro mensual directo a cada propietario de vivienda En un plazo de 24 meses .
2.- Ampliación Contrato de Arrendamiento por 20 años 3.- Modificación del Contrato de Arrendamiento 4.- La Municipalidad sea Aval del Préstamo
AGUAS DE PUERTO CORTES S.A.
AGUAS DE PUERTO CORTES S.A.
FLUJO DE EFECTIVO
FLUJO DE EFECTIVO Julio 2005 - Julio 2011
Julio 2005 - Julio 2011 jul-05
2006
2007
2008
2009
2010
Jul-2011
INGRESOS
GASTOS
Venta de Agua Servicio de Alcantarillado
10.511,0
Venta de Acciones
1.887,5
3.750,0
Conexiones / Alcantarillado Recolección de Basura
1.789,5
5.768,5
TOTAL FACTURADO OTROS INGRESOS Derechos y Tasas de Servicios
-
14.188,0
29.581,7 3.640,3
6.050,0 48.790,5
30.633,0
32.395,7
34.273,8
36.262,4
19.128,0
7.288,6
11.176,0
15.236,4
18.172,5
9.868,5
3.750,0 6.655,0 48.326,6
7.320,5 50.892,2
-
-
8.052,6
8.857,8
57.562,8
63.292,7
4.871,8 33.868,3
58,8
497,3
536,7
579,2
624,0
527,4
113,1
47,5
95,0
95,0
95,0
95,0
95,0
95,0
Intereses y Comisiones Ingresos Varios
611,8
935,2
779,4
857,3
818,3
837,8
414,1
Total Otros Ingresos
718,1
1.527,5
1.411,1
1.531,5
1.537,3
1.460,2
622,2
-29,5
-82,8
-85,8
-90,7
-96,0
-101,5
-53,6
14.876,6
50.235,2
49.651,9
52.333,0
59.004,1
64.651,4
34.436,9
Rebajas en Facturación TOTAL DE INGRESOS
Gastos de Agua Gasto de Alcantarillado Sanitario Gasto de Recolección de Basura Gasto de Arrendamiento Otros Gastos TOTAL DE GASTOS RENTA NETA ANTES DE IMPUESTO Impuestos RENTA NETA DESPUES DE IMPUESTO
6.723,3 -
4.800,0
14.810,5
15.953,0
16.754,2
17.759,4
18.681,5
9.736,2
3.784,6
4.072,9
4.137,6
4.205,6
4.277,0
2.247,8
5.488,0
6.146,6
6.761,2
6.884,1
7.710,2
4.317,7
14.400,0
17.853,7
20.584,2
22.533,7
23.236,2
12.182,5
454,3
1.009,5
1.086,1
1.167,1
1.216,5
1.296,1
678,3
11.977,6
39.492,6
45.112,3
49.404,3
52.599,3
55.201,0
29.162,5
2.899,0
10.742,6
4.539,6
2.928,7
6.404,8
9.450,4
5.274,4
724,8
2.685,7
1.134,9
732,2
1.601,2
2.362,6
1.318,6
2.174,3
8.057,0
3.404,7
2.196,5
4.803,6
7.087,8
3.955,8
Session FT3.16 Service Delivery and Local Empowerment: Turnaround of Public Utilities
18
AGUAS DE PUERTO CORTES S.A.
VISION
AGUAS DE PUERTO CORTES S.A.
MISION
• PARA EL AÑO 2010 SEREMOS UNA EMPRESA LIDER A NIVEL NACIONAL Y EN CONSTANTE CRECIMIENTO DEDICADA CON EFICIENCIA Y CALIDAD A LA PRESTACION DE SERVICIOS DE AGUA POTABLE Y SANEAMIENTO CON RESPONSABILIDAD SOCIAL EMPRESARIAL.
• NACIMOS PARA PROPORCIONAR SERVICIOS DE AGUA POTABLE Y SANEAMIENTO AL MUNICIPIO DE PUERTO CORTES, GARANTIZANDO EL CUMPLIMIENTO DE LOS PRINCIPIOS BASICOS DE LA RESPONSABILIDAD SOCIAL EMPRESARIAL, OFRECIENDO ALTA CALIDAD Y PRECIOS ACCESIBLES A NUESTROS ABONADOS FOMENTANDO CON ELLO DE MANERA PERMANENTE SALUD , BIENESTAR Y SATISFACCION A LA CIUDADANIA EN UN AMBIENTE LABORAL ARMONICO Y CON BENEFICIOS PARA LOS SOCIOS.
AGUAS DE PUERTO CORTES S.A.
GRACIAS POR SU ATENCION AGUAS DE PUERTO CORTES A .P .C. DIRECCION: PRIMER NIVEL ESTADIO EXCELSIOR BARRIO COPEN TELEFONOS:(504) 665 -0053 (504) 665-6870 FAX (504)665-2794
E-Mail :
[email protected]
Session FT3.16 Service Delivery and Local Empowerment: Turnaround of Public Utilities
19
Session FT3.16 Service Delivery and Local Empowerment: Turnaround of Public Utilities
20
Regulating Commercial Utilities: Making a Difference in Zambia Dr. Osward Chanda Director, National Water Supply and Sanitation Council, Zambia
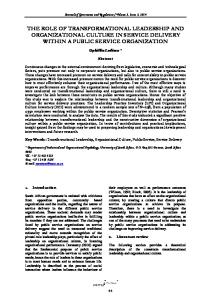
Although Zambia has abundant water resources, a new baseline study indicates that only 47% of the urban population has adequate and sustainable access to clean drinking water and only 43% of the urban population has access to adequate sanitary facilities. In 1994, the Zambian Government embarked in 1994 on a profound Water Sector Reform. A basic part of the reforms was to increase information availability, in order to make it possible to plan objectoriented. Important issues in this reform were commercialization of WSS, Establishment of an effective sector supervision and regulation and setting up a sector-wide information system. An important element of the reforms was the decentralization and commercialization of water supply and sanitation provision. This meant that the function of service provision was transferred from the Ministry to local autonomous and professionally managed public utilities. Stakeholder participation was integrated into the new structures. Private sector involvement was introduced. New legislation gave the institutional set-up the necessary legal backing. The National Water Supply and Sanitation Council (NWSC) was set up as a national regulator, regulating both public and private utilities. The NWSC is a statutory body with its own budget from a 2% fee on utilities’ turnover. It has best practice human resources policies, including transparent selection of staff and private sector salaries. As a result of the reforms and accompanying investment, the average daily supply time for water increased from 8 to 16 hours. Average collection rate is now over 70%. Water quality, customer satisfaction and cost recovery has substantially improved and are still rising.
Session FT3.16 Service Delivery and Local Empowerment: Turnaround of Public Utilities
21
ion es/ arat SepResourcand ly er Wat er Suppion Wat Sanitat ) S (WS
Separation Regulation/ Executive Functions WSS
cost Full overy c e R user ugh throharges c
Osward M Chanda Director-NWASCO
Appropriate Technology for local conditions
Effective Institutions through HRD
Mexico 2006
De Loc volutio n a Andl autho to ente privat rity rpris e es
Increased GRZ Spending on WSS
RESULTS OF WSS REFORMS
decentralisation, commercialisation and PSP Water 1.Water Supply Resources & 2.Sector Leader Sanitation
MLGH
Chart A2: Proportion of Urban Population served by different Service Providers -2004/05
Reports to Parliament
Council
1
MEWD
13%
1% CommercialUtilities Local Authorities Private Providers
86%
CU Private Zambian Company
Private 49% participation on capital
Regulated
Private
Commercial Utilities (Cus)
9 (51 towns)
Local Authorities (L A s)
22
Private Schemes
7
Management, leasing etc. contract
Institutional Institutional set set--up up of Regulation
2002
Power and Responsibility
2005
Total Pop
9,600,000
10,200,000
Urban Pop
4,000,000
5,000,000
181,000
215,000
No. of Connections Coverage Rate Total Production UfW Average Tariff
73%
58%#
290 Mio m3
300 Mio m3
56%
49%
570 ZK
1250 ZK
(14 Cent)
(38 Cent)
Collection Efficiency
58%
74%
O & M Cost Coverage
60%*
75%
* At almost no maintenance works # Includes Peri-urban Areas
Increased consumer satisfaction
Arbitration Arbitration Large Large Autonomy
Small Small size Lean Lean Structure Structure
-- Water + Sanitation Sanitation ACT ACT -- Statutory Instruments Instruments - Minister Minister of EWD - High High Court -Appeal -Appeal -- Statutory not ministerial body -- Own budget from from fees fees -- Transparent selection of staff -- Private sector salaries -- Reports to Parliament / MEWD -- Personnel 14 -- Fees 2% of provider provider ’s Turnover - Part- time Inspectors
Delegated Authority to Water Watch Groups
Session FT3.16 Service Delivery and Local Empowerment: Turnaround of Public Utilities
22
Tools for Tools for regulation regulation
Licensing of providers / SI Determine service areas and key responsibilities
Tariff negotiation
Sustainability and efficiency
Publication of sector reports
Promote comparative competition / efficiency
Trust Fund Fund ––urban urban poor poor Service to the poor Guidelines on Provision Provision of of services services Minimum Service Level Business Plan Investment Plan Tariff adjustment Corporate Governance Reporting by provider Interactive Interactive Information Information System System Baseline Baseline data on Urban poor
WSS ACT 1997
Institutional Setup
Local Local Authority
Delegate Operations
Professional Professional Providers Providers Commercialised/PSP
Gives sufficient Independence & Promote Professionalism Several Commercial Units Allows for Competition Independent Professional Regulatory Agency
ENABLING ENVIRONMENT THROUGH REGULATION vGradual tariff adjustment to cost covering levels vClear Minimum Service Level Requirements with Targets vSupport: performance management systems & Recruitment of Magt vGood Management Information System from Utility to Regulator vPublication of performance results and Rewards
Pro-poor Regulation Defining service area in the license/ jurisdiction of local authority Provider remains responsible for quality and tariffs of other players (NGO, communities) within licensed area
Providers have to offer sufficient adequate outlets Kiosk – commercialized public stand posts Extending service delivery into low income areas is integral part of investment plan from providers
Resistance by professional providers to cover All areas: vTake over and extend low-cost systems vPlay a role in onsite sanitation Less professional LAs + NGOs are left to serve the poor with low-cost technology – and little sustainability
Regulator has to set conducive framework to ensure: •Efficiency •Sustainability •Value for Money
v Standards for sustainble low-cost solutions v Devolution Trust Fund: grant funding to extend infrastructure and introduce management system
Results:
Successful pilot phase – access to safe water for 90,000 additional People Scaling up - Resources mobilised to reach 500,000 people by 2010
Session FT3.16 Service Delivery and Local Empowerment: Turnaround of Public Utilities
23
Session FT3.16 Service Delivery and Local Empowerment: Turnaround of Public Utilities
24
Mexico: The Linking Role of the State as an Enabler of Local Operating Capabilities under a Federal Normative Structure Dr. Ricardo Sandoval Chairman, Guanajato State Water Commission, Mexico
In the early 1980’s, the Mexican Constitution decentralized water supply services to the municipal level. Policy making remained a federal responsibility. The State plays a connecting role between federal and municipal authorities. In the State of Guanajuato, 41 of the 46 municipalities created municipal water departments; the other five created statutory bodies, independent from municipality. The statutory bodies are overseen by an independent council, whose members are chosen from civil society. During the 1990s the water sector in Guanajuato underwent further reform as other municipalities opted to convert their municipal water departments into statutory bodies increasing the total to 39. In 1991, the State Government created the State Water Commission (CEAG) as a regulatory entity to promote improvement in water services. Rather than act as a heavy -handed regulator, CEAG focuses more on providing support for municipal service providers. CEAG supports strengthening seven areas which can restrain or enable sustainable operation of the systems: water sources restoration or preservation; technical and financial support for the development of infrastructure and efficient services; political and technical support for the provision of adequate tariff structures and commercial operations; training and certification of personnel, linked to access to public funds; legal and regulatory support; funding for research and development of technology, as well as the implementation of a network for promoting enabling social values towards a better use of water. Since 1995, CEAG offered additional programs supporting the utilities, often operated on a matching fund basis, with 50%-70% funds provided by the State and the utility providing the balance. Through the State Water Commission, State Government has striven to link municipalities and the Federal Government (CONAGUA) to promote a more efficient exchange of information and budgetary resources. The State Water Commission puts emphasis on promoting the implementation of new processes, beyond the mere construction of infrastructure. Unlike most of the other State governments, Guanajuato has led a trend towards further decentralization. This decentralization effort is supported by the present federal administration and CONAGUA. As a result of the reforms, WSS services have improved in most municipalities in Guanajato.
Session FT3.16 Service Delivery and Local Empowerment: Turnaround of Public Utilities
25
General context The state, between the normative role of Federal Government and the operating responsibilities of Municipalities and water users Water management as a system of exchanges (information, resources, reactions…) The water threat and the strive for improved efficiency and efficacy Decentralization as a key
Guanajuato State Water Program
The linking role of the state as an intermediate enabler of municipal operating capabilities under a federal normative structure
Coordination, not subordination Cooperation, not competition
A model of six “levers” towards IWRM 2
Geographical & hydrological context
Water balance 4,027
Extraction
Recharge
Groundwater
1,557
Extraction
1,364
Runoff
Surface water
2,778
Deficit Deficit
-193 Hm3/year (Sources: CNA 1996, CEAG, 2000)
-1,249
3
99 (2,500 - 50,000 In hab) hab .)
Population
97.37 %
9 5.82 %
2’213,569
96.73 %
8 5.89 %
891,479
81.55 %
33.3% 3 9.30 %
1’520,882
Physical assets
Sustainable services e ltur Cu
8,821
Sewage connections
(50,000 in hab hab.) )
Water connections
Hu Ca man pit al
Towns/cities
A six “levers” model for IWRM
(y. 2000)
Na cap tural ital
Water and sewage coverage
4
4’625,930
Institutions
5
Session FT3.16 Service Delivery and Local Empowerment: Turnaround of Public Utilities
6
26
A six “levers” model for IWRM
Water forever Gather and organize available information Improve knowledge of water behavior and quality
Natural capital: water forever Physical assets: water for everyone Financial capital: Human capital: people for water Institutions: Culture:
Hydrological and hydro geological research Installation of weather and flow measuring stations
Systematize data Set up models for planning Groundwater models Vulnerability maps Hydrological models Socioeconomic integrated models
Continuously update data & information Piezometric, hydrometric and quality monitoring
7
8
9
10
Estaciones de Monitoreo
Sa nt a M a ri a
Río Tamuin CJaral de Berrios
Hidroclimatológico
JALI SCO
C Granja Gpe.
OCA MP O
Operadas por la CEAG
SAN L UIS PO TO SI
HC El Realito
C SanFelipe
SA N
es
EL F I P E
Río Verde G rande
HC za Elnar Capulín
A N D IE G S ODE L A U N IO
n Ma
HC MePaso zqu it ade l la Hormiga X IC H U
A N L U IS D S EL APA Z
chu Xi
SA NLU IS DE LAP AZ
a Rí o Le rm
C La Quemada
V IC T O RI A
AT ARJ EA
DO L OR E S H ID A L GO
LEON
SAN T ACA TAR I N A DOC T O R MO RA
L E ON
GU ANAJUA T O
GU ANA J UAT O
SA N
rb io R ío T u
I L S AO
C Oficinas CEAG
SA NF RAN C IS C O D EL RI U R IS IM A D E P L R IN C O N
ua na ju at o Rí o Tu rbi o Rí o G
IR A PUA TO
O MO N C F ORT
IRAP UATO
SA L AM ANCA
SAN T ACR UZ DEJ UVE NT
PA A S E OE L G RAN DE
S alamanca
AB A S OL O
Q UERE TARO
UEB P L ONU EVO CE L A YA
CE LAYA
I L AG V RAN
H Pericos
C Cortazar HC Estación Hidroclimatológica Automática
ORT C AZA R ENJ P A MO
APA S E OE L AL T O VAL EDE SAN T IA G O UAN H I MA RO
J A RAL D EL P ROGRE SO
U R IR A Y
AL V S AT I ERA
Laguna de Yuriria ARA M VAT I O
C Coroneo ERE J CUA RO
C Estación Climatológica Automática
ORON C EO
H
a
SA N T IA G O
AR T I MO R O
Le rm
CYuriria
Rí o
H Rodeo de San Antonio
Río Lerma Chapala
MICHO ACAN
QU ERETAR O
Río Laja Río L erma
CUE R A MA RO
R ío Moctez uma
O S E IT J U R B ID E
SAN M IGU ELD EA LE NDE
C La Ordeñita
Rio Lerma Sala manc a
MA N UEL D OB L ADO
H Adjuntas
Cat ari n
L L A ENDE
C. La Gavia
ROM I T A
Sa nt a
H La Ordeñaa
T IE RRABL ANC A
R IA N G A U TO OROL M E ON
Estación Hidrométrica Automática
AC A MB A RO
ARA T NDAC UAO
Laguna de C uitz eo Río Lerma Toluca
11
Session FT3.16 Service Delivery and Local Empowerment: Turnaround of Public Utilities
12
27
13
14
3
4
5
6
Session FT3.16 Service Delivery and Local Empowerment: Turnaround of Public Utilities
28
Monitoring well in operation Piezometric constructed well
7
1 3
22
498 725
1 8
624
760
19
17 1478
1277
23 1371
1316
ABASOLO 2546 1310
160
130
100
1523
SIMBOLOGÍA
1602
2387
1694
POZO POBLADO,ZONAURBANA.
4
LAPIEDAD
Rí
a oLe rm
DEVULNERABILIDAD
14225000
14230000
14235000
14240000
14245000
14250000
#
Q a l
T rp rp T
T rp
a p T a p T
a l Q rp T T rp
T rp rp T
ic T a p T
id K id K K id K id K id K id
a p T
ic T
rp T T rp T rp T rp T rp
s s K l a Q
T rp T rT p rp rp T
a p T
T rp T p l- Q ( B - v ) b
p l-Q (B T - v B ) b T lp rp a T p T a p p l-Q (B -B T v b ) T a p a p T T p l-Q (B B - v ) b T p l-Q (B -B v ) T b l- Q p ( B - v b ) T p l- Q ( B - v ) T b l- Q p ( B - v b ) a p T T a p
p a T rp T rp T
5-
T a p
p a T T ic
l a Q rp T
r p T
POZO
m b T
p l-Q (B T - B b ) v
14200000
- Q s T c T s -Q c Q a l T v r
Q a l
T c g T c g
14210000
14215000
14220000
14225000
14230000
14235000
14240000
14245000
a g Q
a l Q
r p T rp T
a l Q
T b c T c g
b Q a T a l
T c g T b c T c g r p T rp T
7 # T b a d a l Q
b c Q
5
T o m
T m b
id K
p l-Q (B -B T v b ) T p l-Q (B -B v )b o m T o m T T o T m m T o m T o m K s d c lQ a m o T c d s K K s d c K c s d
a l Q ic T
p s K j
T Q ic a g Q b c T ic b c Q Q a T g ic c b Q T c b g a Q c b Q T ic T v rT v r g c T o T v r
r v T
c b Q
14250000
T m b T m T m b b
#
T v r
1 5 0
14205000
T s -Q c ' 3
b c Q b Q T c b c
s g c K
b c Q - Q s T c
- Q s T c m b T
s g c K
K c g s
Q a l
T s -Q c
c b Q v r T
T v r s g c K
K c l p E r v T c b Q
T s -Q c T v r
T p l- Q ( B - v ) b
g c T
r v T
p l-Q (B T - B b ) v T e v T s -Q c
T p l-Q (B -B v ) b
K id
K s ig ia T T ig a
g c T #
1 '
s s K T o m
o T T m o m i d K
Q l a - v B ) b
s K T s -Q c
s s K T s -Q c s s K
p l-Q (B T - B b ) v -( B B b ) v K s
- Q s T c
T s -Q c
- Q s T c a l Q
T p l- Q ( B - v ) b T o m
- T s T c p Q l- Q ( B - v ) T -Q b s c 5 '# s -Q c T T s -Q c T o m #1 ' T - Q s c
- Q s T c
l- Q p T ( B - v b )
ip K E
T s -Q c Q b c b c Q Q b c
T o m s K
K T s a ig T ig a ) b (B -B v ) b
r v T
r T v T g c
a l Q
- Q s T c
ig a T
K s K s
T o m p l-Q (B T - B b T v ) m o s -Q c T T o m p l-Q B T -( v B ) b T p l- Q ( B - v ) b T l-Q (B -B p v l a Q T s -Q c T p l-Q T p l- (Q B - v ) b l a Q l- Q p T ( B - v b ) s -Q c T T p l- Q ( B - v ) b o m T - Q s T c T p l- Q ( i d K Q a l s c K d T s -Q c id K m T o T o m e v T s -Q c T e v T s s K - Q s T c p -Q T l T e v -T Q s c - Q s T c #
Q a l T s -Q c
id K s s K K id T o m
T p l-Q (B -B v ) b
1
T s -Q c r p T c T b Q c b T s -Q c T g o c T b a d
- Q s T c
K id T o m T o m
id K
T o m
T p l-Q (B -B T ) o b v m
- Q s T c
T a p ic T
g c T o a l Q
K id
K id i d K
T o m T p l- Q ( B - v ) b p l-Q (B T - B b ) v T s -Q c
T o m
o m T
T a p
RIO FALLA GEOLOGICA ÍNDICE DE CONTAMINACIÓN
m c T g
14195000
T o m T o m - Q s T T o c m T o m p l-Q (B -B T v b ) T o m
s -Q c T - Q s T c
c b T
14190000
T o m
T o m T o m m o T
T a p T a p a p T a T p
Q b c
Sierra de Barajas
T p l-Q (B -B b )v T p l-Q (B -B b )v p l-Q (B -B T v )b p -Q T l (B B - b v ) ' 4 p l-Q #(B T - B b ) v s s K p l-Q T T (B l B -p ( )B Q b v - v ) b
T o m
rp T
3-
i K K id id K
T s -Q c
a l Q
POBLADO,ZONAURBANA.
14185000
'# 2 v a T
rp T
ic T b c T b c T T b c T rp
1-
T s -Q c
14220000
l a Q
rp T
Q b c
14215000
' 6
p l-Q (B T - B b ) v r p T
rp T
a l Q b c T
Q Q l a a l
T s -Q c
14210000
T rp Q a l T ic
T ic
Río Lerma 14205000
T a p
rp T s -Q c T
p a T
2029
14200000
#
T rp
Q a l
1
-
4
' 8
l a Q
s -Q c T
5
2022
14195000
T ic
T rp
l- (Q B p T - v T )a b p T l-Q p (B B - v ) b T lp
a v T lp
#
T s -Q c
7
l a Q
a p T a T p T p a
3
9
r p T rp T r p T
a p T
r p T
3
Graben de Penjamillo
ZONAS DE CONTAMINACION POTENCIAL
2 2 3 5 0 0
2 2 3 5 0 0
14190000
ÍNDICE
0 5 1
2148
a v T ic T a T T v a v T lp lp T T lp lp T
a l Q a l Q
m s T
SIMBOLOGÍA
2 2 4 5 0 0
2 4 5 0 0
FALLA GEOLOGICA
1966
ic T ic T
T rp
T rp
1
3
RIO
Sierra de Barajas
1721
Graben de Penjamillo
p a T T s m
1 3
ABASOLO
2 L A P IE D A D
3
5
1
1858
p a T
1 5
T ur
2 2 5 5 0 0
2 2 5 5 0 0
-
2618 1912
T a p T ic
m s T T p l- Q ( B - b )v lQ a s c K v a T a p T 1 v a T Q a l# T p a a l Q Q l a T p l-Q (B -B v ) T b a p
2
1 7
7
110
2493
1564
2
p a T p a T
T s m
z T
p l-Q (B -B T v b ) #
19 1 7 Graben 23 de Penjamo-Abasolo
6
PENJAMO
120
1547
5
1
8 Sierra de Penjamo
140
z T s m T p l-Q (B T - B b ) v
1 9
20
18
150
2182
PENJAMO
1793 2075
9
2 6 5 0 0
2 6 5 0 0
2589 2925
6
Graben Penjamo Abasolo 7
170
2 1
IRAPUATO
21 22
16
ío
2256
2208 2207
15 10
R
8
Sierra de Penjamo
2088
14
190 180
b io
5 2 06 0
21
CUERAMARO1 1
200
Ín di c e de Vul ne r abil id ad ( SI NTACS)
Río Tu rb io
2 7 5 0 0
16
2 7 5 0 0
R ío Gu a n a j u at o
9
IRAPUATO
604
1221
2 8 5 0 0
2 2 8 5 0 0
210 4 3 142
1006
LEYENDA +
12
+
15
1 0 1183
1095
Sierra del Veinte
LEYENDA
1388 176
14
255
11
Río Gu a n a ju a to
1429
Sierra del Veinte
248 361
1245
CUERAMARO
Í ndic ede Contam inación
1 3 12 417
8
- Q s T c
Q a l
s -Q c T K c l p
2340000
2340000
León
T s -Q c T s -Q c T s -Q c l- Q p T ( -B v b ) - Q s T c # T s -Q c -T c s Q 9 c b Q a l Q c b Q T s -Q c b c Q b c Q - Q s T c p l-Q (B T - B b ) v
b Q Q c b c
b c Q
- Q s T c
200.00
Guanajuato
Guanajuato
c s K g
- Q s T c
23 10000
2310000 230000 0
110.00
l- Q p T ( B - v b ) T p l- Q ( B - v ) b
p l-Q (B -B T v b )
T p l- Q ( B - v ) b m v T
p l-Q (B -B T v b ) r v T
T m b
T m b T m b #
r v T
T m b
T s -Q c
T r v T p l-Q (B -B v ) b T p l-Q (B -B v ) b
p l-Q (B -B T v b ) T p l-Q (B -B v ) b
a p Q
r T v v T r
l a Q
Q p a v r T
2290000
p l-Q (B T - B b ) v
p l-Q (B T - v B ) b l- Q p T ( B - v b ) T s -Q c
22900 00
225000
235000
245000
255000
l a Q
Q p a p a Q p a Q p l-Q (B -B T v b )
r v T T p l-Q (B -B v ) b
Q a l
T v r T r T v r v r v T
m p T r
ria u Y
p l-Q (B -B T v b ) l- Q p T ( B - v b )
a l Q
v r T
Q a l l a Q
T p l- Q ( B - v ) b
m p T r
Q a l
p l-Q (B T - B b ) v l- Q p T ( B - v b )
a l Q
Q a l
Q a l
4
m tT T m p r a l Q
l a Q
Q a l m s T
' 9
l T a Q m b
m p T r
#
m p T r
200000
210000
220000
230000
240000
250000
260000
270000
p l-Q (B T - B b ) v
#
T m v T m s
m s T
Q a l r v T
265000
T m t
p l-Q (B -B T v b )
T m s
215000
re s P a m p T r
p l-Q (B T - B b ) v T p l-Q (B -B v )T v b r T r v
M.Doblado
T m v
l a Q
T p l-Q (B -B v ) b
T v r
v r T
0 ' 1
m b T
T m p r
l- Q p T ( B - v b )
Q a l T r v
205000
T m v Q p m
T m b
T p l-Q (B -B v ) b r v T
T -Q s c T s -Q c r v T
p l-Q (B -B T v b )
190000
195000
m v T
p l-Q (B -B T v b )
T p l-Q (B -B v ) b
v r T T p l- Q ( B - v ) b
80.00 185000
m v T
l- Q p T ( B - v b )
m v T
o g a L
100.00 90.00
s -Q c T T m b
E T o m
v r T
T p l- Q ( B - v ) b
p l-Q (B -B T v b )
Q a l Q l a - Q s T c P r e a s
Q a l
M.Doblado
T v r
a s T T p l-Q (B -B v ) b
T v r p l-Q (B -B T v b ) T v r T p l-Q (B -B v ) b
- Q s T c
2300000
130.00 120.00
T m o
p l-Q (B T - B b )T v r T v r T v r T v v r p l-Q (B -B v T ) b v r T r v T p l-Q (B T - B b ) v T p l-Q (B -B b )v p l-Q (B T - B b ) v p l-Q (B -B T v b ) p l-Q (B -B T v )b T p l- Q ( B - v ) b
T s -Q c
r e P a s - Q s T c T p l-Q (B -B v ) b
T m v
T p l- Q ( B - v ) b r v T
l- Q p T ( B - v b )
a l Q
l- Q p T ( B - v b ) m o T
p l-Q (B -B T v b ) o m T o m T p -Q T l (B - B b ) v o m T T o m
K id
T m o
ip K
c s K g E ip K ip K T s -Q c s -Q c T a l Q ip Q a K l p l-Q (B T - B b ) T v l- Q p ( B - v b )
T p l- Q ( B - v ) b a l Q T p l- Q ( B - v ) b T p l- Q ( B - T ) p b v l-Q (B -B v ) b
Q a l
p l-Q (B -B T v b )
s -Q c T
id K
m o J T - K i
m a T l a Q
l a Q
m s T
re s P a
P re s a p l-Q T s (B -c B b ) v
140.00
i d K
m o T
m T T c s -Q c
e
ip K T m b
m b T
K ip
i p K l- Q p T ( B - v b )
T p l- Q ( B - v ) b r v T
o m T o m T T o m T o m
K s
T s -Q c T m o d le A cio a n
m b T
m b T m b T
p l-Q (B T - B b ) v
#
l- Q p T ( B - v b ) r v T
s s K o m T
o m T Q a l
Q p a
c s K g Ig sa re P
Silao
Romita
m o T m o T
a l Q
T p l- Q ( B - v b )T - c s Q - Q s T c T s -Q c s -Q c T T v r r v T c T r Q -v s T c Q a l p l-Q (B -B T v b )
T m b
1 0
150.00
s -Q c T Q a l
Q a l - Q s T c
s -Q c T - Q s T c
s -Q c T T v r
l- Q p T ( B - v b ) p l-Q (B -B T v b ) #
2320000
2320000
170.00 160.00
- Q s T c
T v r r v T
- Q s T c T p l-Q (B -B v ) b T p l- Q ( B - v ) b
r v T c T
r v T l- Q p T ( B - v b ) T l-p Q ( -B v ) b r v T T l-Q p (B -B b )v T l-Q (B p - B b ) v
T v r
6
190.00 180.00 Silao
Romita
p l-Q (B -B T v b )
c g T
- Q s T c - Q s T c
s -Q c T
s -Q c T
c b Q
T p l-Q (B -B v ) b T v r
g c T
T v r
T m o - Q s T c c b Q s -Q c T b c Q Q b c
b c Q
T p l-Q (B -B v ) b
Purísima San Fco. del Rincón
ic T r v T
b c Q c T c T
c T
p l-Q (B -B T v b )
2330000
2330000
210.00
c g T
v r T Q b c T s -Q c Q b c
T v r T p l-Q (B -B v b )
León T m r s
Purísima San Fco. del Rincón
a l Q Q a l
T m s a t T
itze u C o g a L
Q a l
T o g T a t
T v r
r v T m b T
#
' 7
#
a l Q
8 T T t a a t T a t
m t T T m v
lí o S sa re P
Q d z r v T Q d z
a l Q m p Q
p l-Q (B -B T v b ) Q a l
r v T m b T
m b T
Q d z T ic
T ic
1
2
# 2 # 1
' 8 #
' 6 3
#
# # 2
'
' 4 #
14 1 # # 1
' 1
' 3 # # 5
7
# '# 5
Physical limit
'# 1 o H
n ce lo
o
l a Q
m p Q
a p Q is le P
ce to
o n
P
n ce lio
o
M
n ce io
o
li O
ce o g
o n
c b Q T
( l-Q p
-v B
) b
s-Q T
c
a g Q
m T
s
p m T
z d Q sa T
9
# b m T
m T
r
T
c b
b T
t a
o
T
vr
r m T
s
c m T c m T
g
c T rp T a T
p
o T
g
T
z
e T
v
lp T sm T
ic T
b a T o T
P
ce o E
o n
ce lo a
o n
ig T
ia
a rd o
cia n
co g T
scd K
o
p u S
rio e
K isc D
a rd o
cia n
isc D
a rd o
cia n
i c tá
r rio fe In
0
rá Ju
sico
s riá T
co
s
ip K
cp K csg K
# 1
7
Approx. Limit of recharge zone
cg T
isc D
id K
re C
6
m
v e T
sc K
#
a d
t
T
m T
v m T a m T
s ú e J s d e l M o n te
l p K
E
sj
J-K
i
Dinamic limit due To water extraction
2
# 0 1
'
1 4 #
1995
#
1997
1998
1999
# #
' 7 8
COTAS
Sate Water Council
3
Session FT3.16 Service Delivery and Local Empowerment: Turnaround of Public Utilities
4
29
Water for everyone Increase coverage and physical efficiency in public and productive water user systems Water efficiency and leak detection in urban networks Measurement Water efficiency in agricultural wells
Reclaim wastewater for allowing water exchange schemes Increase from 35 to 90% urban wastewater treatment capacity
Import water from neighboring basins Paso de Vaqueros Rio Verde (El Zapotillo) Rio Santa Maria (El Realito ) State water distribution project (Baj ío and Laja aqueducts)
Improve flood protection Ortega, Cepio and Mariches dams Protection works 5
94
92
5.29
4.78
5.00
4.00
84 3.52
78
75
2.90
47
64
4.16
Urban coverage
2000
Rural coverage
1990
1995
Urban coverage
2000
Rural coverage
1995
1996
559,557
1995
1998 1999 2000 2001 2002
515,884
1990
1997
540,530
1996
1997
582,824
21
1998
599,981
35
1999
2000
2001
Domestic connections
94
685,971
90
Increase in household connections (%)
Sewage connections (%)
661,055
95
631,723
Water connections (%)
26
2002
27
28
People for water: finance
Efficiency
Promote efficiency to reduce costs and increase revenues Improve budgetary allocation
Energy efficiency: 44 municipalities with efficiency programs implemented 263 deep wells 2,286,739 KW-h/month ~ 200,000 US dlls/month Time for investment recovery: 14 months on average Tariff adjustment for cost optimization
Focus on reducing regional and urban-rural differences Two -stage allocation process Prioritize according to infrastructure needs Allocate to those fulfilling the requirements
Negotiate a tariff reform Bill and collect for all that needs to be collected
Water distribution efficiency
Improve measuring, billing, collection Reduce cross-subsidies
42 hidrometric circuits: 6 finished , 36 under way Since 1996, state water program for leak detection
Bill superfluous consumption for total cost recovery Ensure economic access to essential consumption
Collection efficiency
Increase capture of external subsidies and funds
90% of utilities have updated commercial systems
Federal programs Private participation: PROMAGUA
29
Session FT3.16 Service Delivery and Local Empowerment: Turnaround of Public Utilities
30
30
Energy efficiency
Tariff system reform
100
2002
90 80 70 60
Minimum
50 40
Average
30
Maximum
2006
20 10 0 1996
1997
1998
1999
2000
2001
2002
2003
2004
Energy expenses vs. Total expense (average of 25 water utilities in Guanajuato)
31
33
Average tariff raise per cubic meter
Total average tariff raise per year
$11.90 26%
$9.98
24% 21%
$6.22
$5.30
$4.76 $6.92
$7.14 $4.76
$4.22
Domestic
$3.90
Commercial
Industrial
Government
Total
6%
5%
4%
4%
2002
2005
4%
3%
2%
4%
32% in eight years 1995
1996
1997
1998
71% in three years 1999
2000
2001
2002
2003
2004
34
35
Billing efficiency Volume billed
Reduction in cross-subsidy Unaccounted-for
49%
water
2005
48%
44% 40%
225,458,658
2005
86,066,800
38%
37%
36%
35% 29% 21%
2002
165,730,890
17%
126,510,665
1995
1996
1997
1998
1999
2000
2001
2002
2003
2004
36
Session FT3.16 Service Delivery and Local Empowerment: Turnaround of Public Utilities
2005
37
31
People for water: human capital
People for water: institutions
Improve coordination
Improve State Water Commission’s capacities
Bimonthly meetings with municipal utilities Network of communication areas
State Water Law (2000) Internal reorganization Institutional Development Program
Build and strengthen capacities Training Engineering, accounting, fiscal issues
ERP implementation for thorough control of public works and internal administration Personnel selection by open competition since 2000
Cooperation with State University Master in Integrated Water Management Training courses on project and construction
Certification: 429 water workers since 2000
Improve municipal utilities legal stand
Commercial areas Plumbers Meter readers Rural promoters Water communication specialists
Decentralize utilities Improve municipal regulations
Support research & development State water fund for research on water (2000 -2005) Researchers and students meetings ( “aqueous space ”)
1
39
People for water: culture
Legal stand
Water at school 4
Agreements and programs for primary schools reaching more than 420,000 kids and youngsters Materials
Decentralized utilities Urban localities besides municipal head-cities
36
Municipal urban head-cities with centralized utilities
Events Expo Agua: 12 years World water day Children events
Exhibitions
71
14
1991
23
1995
29
1999
35
2002
Supported “water hall” at Explora museum
36
Capacities Training 36 of 46 municipalities and 14 COTAS taking part of a State network for water culture
2005
4
3
5
Session FT3.16 Service Delivery and Local Empowerment: Turnaround of Public Utilities
6
32
7
Concluding remarks
Long term targets
Stakeholders The State Water Commission (CEAG) 36 public water utilities 46 Municipalities The State Congress National Water Commission (CONAGUA) 14 COTAS The State Water Users Council and 14 COTAS
Key outcomes Water management, a shared responsibility Optimize exchange of information and resources Decentralization: a matter of coordination, not of competition
Consolidate processes besides products Adjust the State Water Law Keep a good communication with Federal Government, Congress and Municipalities Widen and improve social participation Set up the State Water Planning Council Update the medium and long-term state water programs Get synergies from the Sector Wide Approach Loan from the World Bank for strengthening processes and institutions Promote state water sector professionals organization Reassess and redirect weak issues
8
9
Lessons learned Improve coordination and exchange of information and resources b etween the public and private actors dealing with water management State level as a linking actor between the Federal normative role and the Municipal and water users ’ operating responsibilities In stead regulatory bodies, a coordination-oriented approach proves to yield good results, measurable in terms of financial and technical eff iciency improvement Achieving IWRM requires to be open to re -engineering and continuous learning, where an action leads to the transformation of processes and institutions Deal consciously with the dynamic equilibrium in the development and use of the assets for sustainability: natural, infrastructure, financial, human, technological, institutional- legal and cultural resources Investing in institutional strengthening is instrumental: better processes, institutions and methods can take the sector’s capacity to a higher and measurable level of performance
10
Session FT3.16 Service Delivery and Local Empowerment: Turnaround of Public Utilities
11
33
Further reading on turnaround of public utilities
World Bank Characteristics of Well-Performing Public Water Utilities, Aldo Baietti, William Kingdom and Meike van Ginneken, WSS Working Note, Paper No. 5, World Bank, 2006 This report focuses on attributes of well run public utilities and identifies important factors that influence their performance. It proposes a framework of assessing public utility governance: accountability, autonomy, customer orientation and market orientation. The report aims to provide a better understanding of how the external environment influences the performance of public sector utilities in developing countries. The report is primarily intended for policy makers in central and local governments but can be also useful to utility managers as well as other sector professionals. The report is based on a combination of different sources, including field research of eleven well performing public water utilities in different country settings, a desk review of literature as well as surveying operational experience from sector professionals. Cases include: AQUA S.A. (Bielsko-Biala, Poland), Haiphong Provincial Water Supply Company ( Vietnam), Johannesburg Water (South Africa), National Water and Sewerage Corporation (Uganda), ONEA (Burkina Faso), Public Utilities Board (Singapore), Philadelphia Water Department (USA), SANASA (Campinas, Brazil), SIMAPAG (Guanajato, Mexico), Scottish Water (Scotland) and SONEDE (Tunisia).
Ten Years of Water Service Reform in Latin America: Toward an Anglo-French Model, Vivien Foster, Water Supply and Sanitation Sector Board Discussion Paper Series, Paper No. 3, World Bank, 2005 This report provides a synthesis and evaluation of the reform experience in the Latin American water supply industry during the eventful decade of the 1990s. It focuses on six countries —Argentina, Bolivia, Chile, Colombia, Panama, and Peru—that represent a variety of approaches to the reform process. The report considers three major components of reform in Latin America: (a) the extent to which the water companies have been subject to institutional transformation, (b) the ways in which countries have redefined the role of the state by separating out the functions of policymaker and regulator, and (c) the instruments that regulators in Latin America have developed. The report concludes that the scale of water service reform in Latin America has been truly impressive. The real transition for most water consumers has not been from public to private operation, but rather from unregulated centralized public provision to regulated decentralized public provision.
BMZ/GTZ
Reaching the Millennium Development Goals for Water Supply and Sanitation in Zambia – The Urban Perspective NWASCO, supported by GTZ, 2005 Rapid population growth and the inefficient operation of the water supply network are having a negative impact on the living conditions of the urban poor. Eighty percent of Zambia’s urban population, or approximately two million people, live in peri-urban areas. Forty percent lack adequate access to clean drinking water and sanitation. This results in cholera and other epidemics stemming from polluted water. Two unusually dry years worsened the supply situation in many rural areas, and led to Zambia introducing a far-reaching reform process in the water sector in 1994. By 2003 a new water supply and wastewater disposal law had been passed and a regulatory authority and ten commercial service providers set up.
Session FT3.16 Service Delivery and Local Empowerment: Turnaround of Public Utilities
34
Sharing the Experience on Regulation in the Water Sector, SOWAS (Working group on Regulation and PSP in Sub-Saharan Africa), GTZ, 2004 This report provides a summary of experiences regulating WSS in Sub-Saharan Africa. It focuses on setting realistic goals, costs and benefits of regulation, and the role of legal institutions. It builds on actual experience and not on additional studies on regulation. The report is a product of the Working Group on regulation and PSP in Sub Saharan African. Instead of searching for a compromise and a commonly accepted formulation, room is given on different opinions regarding certain topics or approaches. This is to underline that there is no blueprint for the “right approach” of regulation.
Global Water Scoping Process – Is there a case for a multi-stakeholder review of private sector participation in water and sanitation? WaterAid, GTZ, Consumer International, MG, RWE, ASSEMAE, PSI, 2004 This report presents the findings from a feasibility study undertaken (through interviews with 300 people from 13 countries) to ascertain whether there was a need to conduct a review of PSP, and what questions this review would need to address. A Working Group of stakeholders involved in the debate on private sector participation (PSP) in water and sanitation undertook a Global Water Scoping Process, in order to engage a wide range of stakeholders on the possible merits of a multistakeholder review of issues concerning PSP. The Working Group concluded that there is broad interest in, support for, and value in pursuing a multistakeholder review of private sector participation in water supply and sanitation.
USAID Case Studies of Bankable Water and Sewerage Utilities, USAID/ARD, 2005 Volume I: Overview Report Volume II: Compendium of Case Studies This report provides case studies of eight municipal water and sewerage utilities that have successfully made the transformation from unbankable to bankable conditions. The term “bankable utility” describes a public or private utility that can demonstrate to external lenders that it is capable of repaying its debt. This typically means that the utility can meet capital market norms of full cost recovery; good governance; and sound business performance. Such change has generally been achieved by implementing one or more of the following general strategies: corporatization; execution of performance agreements; and/or execution of some form of private sector participation strategy. The case studies in this report illustrate these strategies and provide lessons drawn from their practical application. Cases include: Borough of Dolphin Coast (South Africa), National Water and Sanitation Corporation (Uganda), Alexandria Water Company (Egypt), Municipality of Alandur Underground Sewerage Project (India), Metro Manila East Zone Concession (Philippines),Debrecen Water Works Company (Hungary), Aguas de Cartagena (Colombia), Municipality of Tlalnepantla de Baz (Mexico).
Session FT3.16 Service Delivery and Local Empowerment: Turnaround of Public Utilities
35
Session FT3.16 Service delivery and local empowerment: Turnaround of public utilities March 19th 1645 -1845 Casa Del Diesmo 4
Urban water supply and sanitation services have traditionally been provided by state -owned, monolithic, mostly national water utilities. As part of a general move to market-led systems in the 1980s and 1990s, a new paradigm emerged to transform utilities into more modern service delivery organizations that emphasize operational and financial sustainability. In many countries, centralized providers were broken up and converted into decentralized public providers operating at the municipal level. The private sector has played an increasing but still limited role in management and financing of the sector in the last decade. Simultaneously, some public utilities became more autonomous and a ccountable. Few of them have been able to attract private financing. This session focuses on public utilities that have successfully turnaround and extended and improved their service delivery. The session will focus around the autonomy and accountability in the relation between the utility and its environment which is a critical success factor for all utilities. The session will have decision makers and practitioners that have been involved in turnaround of utilities share their experience.
Agenda Welcome and introduction by the chair (Jamal Saghir, Director Energy and Water, World Bank) Five short (10 minutes) presentations of local turnaround stories § Sao Paulo: how a public utility went to the stock market to raise financing presented by Dalmo Nogueira, President SABESP, Brazil §
Turning around the NWSC in Uganda: Improving efficiency, providing service, and creating financial sustainability presented by William Muhairwe, Managing Director, National Water and Sewerage Corporation (NWSC), Uganda
§
Turning around the water and sanitation services in Puerto Cortes in Honduras presented by Marlon Lara, Minister for the Social Investment Fund and former Mayor of Puerto Cortes, Honduras
§
Regulation of Commercial Utilities - making a difference in Zambia presented by Osward Chanda, Director, National Water Supply and Sanitation Council, Zambia
§
The linking role of the state as an enabler of local operating capabilities under a federal normative structure presented by Ricardo Sandoval, Chairman Guanajuato State Water Commission, Mexico
Facilitated discussion with presenters
Session FT3.16 Service Delivery and Local Empowerment: Turnaround of Public Utilities
36