Self-assembled nanoparticle surface patterning for improved digital image correlation in a scanning electron microscope Adam D. Kammers1 & Samantha Daly1* 1
The University of Michigan, Department of Mechanical Engineering, 2350 Hayward Street, Ann Arbor, MI 48109 *Corresponding Author: Samantha Daly Tel: +1 (734) 763-8137 Fax: +1 (734) 647-9379 e-mail:
[email protected]
Abstract A self-assembled gold nanoparticle surface patterning technique is presented that enables nanometer spatial resolution for digital image correlation (DIC) experiments in a scanning electron microscope. This technique, originally developed for surface-enhanced Raman scattering substrates, results in the assembly of individual 15-136 nm diameter gold nanoparticles over the surface of the test sample. The resulting dense, randomly isotropic, and high contrast pattern enables DIC down to an unprecedented image resolution of approximately 4 nm/pixel. The technique is inexpensive, fast, results in even coverage over the entire surface of the test sample, and can be applied to metallic and non-metallic substrates as well as curved or delicate specimens. In addition, the pattern is appropriate for multi-scale experimental investigations through the utilization of nanoparticle aggregates that collect on the surface in combination with the pattern formed by individual nanoparticles.
Keywords: Digital Image Correlation, DIC, Scanning Electron Microscopy, SEM, Surface Patterning, Gold Nanoparticles, Silane, Self-Assembly.
Submitted to: Experimental Mechanics The final publication is available at http://link.springer.com http://dx.doi.org/10.1007/s11340-013-9734-5
1
Introduction Digital Image Correlation (DIC) has recently been combined with Scanning Electron Microscopy (SEM) [1, 2] to enable full-field displacement and strain mapping at the nano-scale, a technique referred to herein as SEM-DIC. DIC requires the surface of the material under study to possess a random, isotropic, and high contrast pattern of speckles [3, 4]. Generating a surface pattern suitable for DIC at the small fields of view (FOV) that are achievable using SEM is challenging. Existing techniques include photolithography [3, 5], thin film ablation [6], electron-beam (e-beam) lithography [7-9] and nanoparticles [7, 10, 11]. However, many of these techniques are expensive, require a cleanroom, or can only produce the pattern over small areas of the test sample. Importantly, all of these techniques are limited to a smallest image resolution of approximately 8 nm/pixel. In this paper, a self-assembled gold nanoparticle (AuNP) DIC patterning technique capable of producing features smaller than any existing technique is presented.
Self-assembled AuNP two-dimensional arrays were first
investigated in the 1990s as a technique to produce surface-enhanced Raman scattering (SERS) substrates [12-14]. Here, the technique is adapted for digital image correlation to enable experimental investigations using SEM-DIC at unprecedented length scales. This process is an excellent candidate for the surface patterning required by SEM-DIC experiments, providing dense coverage (as seen in figure 1), strong bonding of the AuNPs to the surface, and a controllable feature size. Additionally, it is an inexpensive and fast patterning technique that does not require cleanroom access or specialized lithography equipment. Since the samples only need to be soaked to achieve the pattern, the patterns can be applied to curved substrates and delicate test samples. Finally, surface roughness does not appear to affect pattern quality, as dense coverage following the procedures outlined in this article has been achieved on polished aluminum, as well as rolled aluminum and wire electric discharge machine (EDM) cut aluminum surfaces with root-mean-squared (Sq) surface roughness values of 0.38 µm and 3.07 µm respectively (measured with an Olympus LEXT OLS4000 3D Laser Measuring Microscope). In terms of modifying this approach to deposit other materials, successful self-assembly with silver nanoparticles [12-15] and monolayers of AuNPs with platinum and palladium shells [16] has been achieved. It is probable that a suitable linking molecule could be found to attach other materials, like Ti or Ta, to the surface as well, but the authors are currently unaware of any literature that discusses attaching any colloids other than Au and Ag by using a molecular linkage between the substrate and colloid. Experimental Procedure Patterns were created with suspensions of citrate stabilized AuNPs of 15-136 nm diameter. AuNPs were produced following the procedure outlined by Frens [17], as follows: Gold (III) chloride trihydrate (HAuCl4!3H2O) and trisodium citrate dihydrate (C6H5Na3O7!2H2O) purchased from Sigma Aldrich were used to make stock solutions of 10 mM HAuCl4 and 38.8 mM Na3-citrate. To synthesize the AuNPs, 400 mL of 1mM HAuCl4 (diluted from 10mM stock solution) was added to a beaker and brought to a boil while stirred with a magnetic stirring rod. Between 6.5 and 40mL of 38.8 mM Na3-citrate was then added to the boiling solution to produce AuNPs with
2
diameters of 15, 32, 48, and 136 nm, as measured with TEM and SEM. After synthesis, the AuNPs were stored in dark glass bottles until use to protect them from UV rays that would reduce any remaining HAuCl4.
Fig. 1 Slightly aggregated 30 nm diameter AuNPs immobilized with MPMDMS on the surface of a 99.99% Al substrate. The aggregates can be used for a 300 µm wide DIC FOV, while the area contained within the inset can simultaneously be used for a 10 µm wide DIC FOV. The AuNPs attach to the substrate surface by organosilane molecules that possess a pendant functional group with a strong affinity for gold. As discussed in work by Freeman [12] and Grabar [13], when substrates that possess reactive oxide/hydroxyl groups on their surface are immersed in a dilute organosilane solution, the silane molecules covalently bond to the substrate surface. The bound molecules are oriented so that the pendant functional group extends from the substrate surface, causing AuNPs to self-assemble onto the surface upon immersion into the AuNP solution.
In
this
work,
the
organosilanes
(3-aminopropyl)trimethoxysilane
mercaptopropyl)methyl)dimethoxysilane (MPMDMS) (Sigma-Aldrich) were tested.
(APTMS)
and
(3-
APTMS and MPMDMS
yielded similar pattern results and were used interchangeably. In this work, patterns were tested on substrates of 99.99% aluminum, 1100 aluminum, a nickel-chromium superalloy, and silicon carbide with similar success. Aluminum will be discussed as a model material in order to describe the pattern application process, which was similar for all tested substrates with the exception of differences in mechanical polishing and hydroxylation prior to patterning. The Al substrates were first mounted to an aluminum sample holder with crystalbond 509 and polished down to a final abrasive of Buehler MasterMet 2, 20 nm colloidal
3
silica solution. The polishing cloth was flushed with deionized water for the final 10 seconds of polishing to prevent colloidal silica from adhering to the substrate surfaces. Following the final polishing step, the substrates were rinsed with deionized water, placed in acetone, and agitated in an ultrasonic cleaner to remove residual crystalbond. The substrates were immersed in fresh acetone after the crystalbond had dissolved in order to remove any remaining crystalbond residue. They were then transferred to methanol and agitated in an ultrasonic cleaner for approximately 5 minutes. After the methanol cleaning was complete, the substrates were rinsed in deionized water, dried with compressed air, and stored in air. Note that the optimal polishing/cleaning procedure will vary depending on the substrate under consideration; for example, to avoid damage to the polished surface of soft metals, ultrasonic agitation should not be used for substrates that are less than approximately 300 µm thick. Oxide/hydroxyl groups already exist on the surface of many metals and non-metals, but the number of hydroxyl groups on the substrate surface must be maximized in order to achieve a dense AuNP surface coverage. For glass slides in work by Grabar and Freeman, the surfaces were hydroxylated by soaking them in Piranha solution. There are numerous methods to generate hydroxyl groups on the surface of aluminum. The highest density of hydroxyl groups exist after Al is placed in boiling water to create a thick pseudoboehmite layer [18-21]. However, this pseudoboehmite layer is not suitable for SEM-DIC experiments as it is very brittle and was found to crack at around 2% strain. The second highest number of hydroxyl groups is created by an alkaline clean treatment that has minimal effect on the thickness of the oxide layer [18]. The resulting high density of hydroxyl groups on the surface enables the formation of strong bonds between the silane Si end group and substrate surface [22-25]. In this work, Al substrates were alkaline cleaned in a stirred solution of 200mL of deionized water containing 4.4 grams of both Na3PO4 and Na2CO3 (pH of 10) held at 75°C for 60 seconds as outlined in reference 26. After removal from the cleaner, the substrates were rinsed with deionized water and dried with compressed air. This treatment was performed immediately prior to patterning and resulted in a reproducible hydrophilic surface for pattern application. After hydroxylation, the substrates were silanized by soaking them in vials filled with one part APTMS or MPMDMS to four parts methanol [13] for 24 hours. After this time, the substrates were removed and immediately immersed in a beaker filled with 100mL of methanol. The methanol was stirred with a magnetic stirrer such that it flowed over the surface of the substrates for 30 minutes. The substrates were then transferred to a beaker of fresh methanol and rinsed for an additional 30 minutes. Following the methanol rinse, the substrates were rinsed with deionized water and placed in a vial that was subsequently filled with AuNPs of the desired diameter. Darkening of the AuNP solution when added to the substrate vial is an indication that the AuNPs are aggregating or flocculating. Citrate stabilized AuNPs have a negative surface charge [27] that repels them from each other and prevents aggregation in solution. One potential cause of aggregation could be unbound silane molecules detaching from the substrate surface and bonding to the AuNPs. Once bonded to the AuNPs, the silane molecules can neutralize the particle charge [28] and lead to aggregation. Unbound silane molecules can also lead to bridging flocculation [28, 29] where the tails of the silane molecules stick out from the surface of the AuNPs and bind to
4
other AuNPs when they come in contact. If darkening of the AuNP solution does occur with the addition of the substrate, the substrate should be promptly removed, thoroughly rinsed, and placed into a new vial to which new AuNPs are added. If the new AuNP solution still darkens it could be due to the substrate itself. Electrolytes will neutralize the AuNP surface charge [29] and thus substrates that leach electrolytes into the AuNP solution cannot be patterned with this technique. The same is true for substrates that leach polymer molecules as this will lead to bridging flocculation. In this work, the glue used to attach rubber seals to the lids of the glass vials (Ted Pella prod. # 12730) used for patterning caused aggregation, most likely due to bridging flocculation. The authors recommend test patterning a small piece of the substrate material before attempting to pattern an actual test specimen.
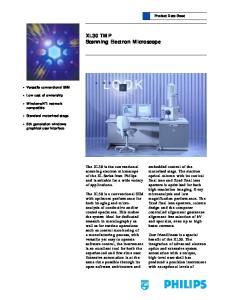
Fig. 2 AuNPs immobilized with MPMDMS on the surface of a 99.99% Al substrate. The patterns were created by soaking the substrates in a) 15 nm diameter AuNPs for 5 days, b) 32 nm diameter AuNPs for 3 days, c) 48 nm diameter AuNPs for 1 day, and d) 136 nm diameter AuNPs for 1 day. The histogram at the lower left of each image shows the grayscale distribution of the image.
5
The substrates were soaked in the AuNP solution for between 1 and 5 days, with larger AuNPs requiring less soaking time as shown in figure 2, in order to achieve a dense surface pattern that would yield accurate DIC results. After soaking for the specified time, the substrates were removed, rinsed with deionized water, and placed in a shallow tray filled with deionized water. Substrates were allowed to dry after verification by optical microscopy that the surface was not covered by large AuNP aggregates. If large aggregates were observed on the surface, a jet of water was used to remove them before drying. However, small aggregates were allowed to remain on the surface to be used as a tracking pattern for a lower spatial resolution investigation over a larger FOV. This is shown in figure 1 as well as in the ‘Pattern Validation Experiment’ section where 30x26 µm FOV results are compared to 131x113 µm FOV results to demonstrate the improvement in spatial resolution that can be achieved with the fine pattern composed of individual AuNPs. Patterns composed of AuNPs ranging from 15-136 nm in diameter can be seen in figure 2. The AuNPs strongly adhere to the substrate surfaces, which is a necessary condition for accurate displacement measurements using DIC. The strong adhesion arises from hundreds of linkages between each particle and the substrate surface [13]. Strong adhesion was confirmed by placing the patterned substrates in methanol and acetone in an ultrasonic cleaner for 30 minutes. No change in the pattern quality was observed. Additionally, tensile tests were performed on samples patterned with this technique and areas that underwent large surface deformation due to shear bands were observed. Even in areas where these shear bands created ledges in the surface, the relative location of neighboring particles did not indicate particle motion due to the AuNPs becoming detached from the surface. To compare the error in displacement data from different pattern methods, 300x400 pixel images of a 60 nm diameter AuNP pattern, Matlab generated random pattern, and airbrush painted pattern underwent simulated 7 pixel horizontal displacements using code developed at Brown University [30]. The error in the DIC horizontal displacement data for the AuNP, Matlab, and airbrush patterns were -7.6316 +/- 0.0177 %, -7.1555 +/- 0.0087 %, and -10.5154 +/- 0.1154 % respectively. Often in SEM-DIC experiments, it is necessary to remove the pattern after the test in order to perform electron backscatter diffraction (EBSD) microstructure mapping. AuNP surface patterns (both drop cast and self-assembled) are significantly easier to remove than e-beam lithography patterns following large surface deformation. In this work, AuNPs were removed from the surface with one of the following techniques. The first method utilizes gentle polishing with Buehler MasterMet 2 colloidal silica suspension. This suspension is slightly basic and chemomechanically polishes the surface. To remove the surface pattern, the polishing suspension was applied to a Mager Scientific Dura-Chem polishing cloth and the substrate was placed face down into the suspension. Using minimal but sufficient force to bring the substrate in contact with the polishing cloth, the substrate was polished in a circular motion for approximately 10 seconds. The substrate was then rinsed and checked in an optical microscope to determine if the AuNPs had been removed. This procedure may need to be repeated multiple times if the surface has deep surface deformation. The second method was to repeat the alkaline cleaning step on the deformed sample. This has proved capable of removing the AuNPs from the surface for post-test EBSD and, unlike additional
6
polishing, does not have the potential of further damaging the surface. In contrast, removal of e-beam lithography patterns requires polishing with 1 µm diamond suspension prior to polishing with colloidal silica. This will remove the sample surface at a substantially faster rate, which is generally not desirable for deformation studies. Pattern Validation Experiment To demonstrate the spatial resolution achievable with this new patterning technique, an in-situ tensile test was performed on an 1100 Al tensile sample. The tensile sample with a gage length of 8mm and width of 2 mm was cut by EDM from a 1mm thick sheet of material. It was polished to a final thickness of 820 µm. After polishing, a FEI Quanta 200 3D SEM equipped with a focused ion beam (FIB) and gas injection system (GIS) was used to deposit platinum markers in the center of the gage section as shown in figure 3. The Pt markers were used to align the electron backscatter diffraction (EBSD) analysis area with the test FOV. The markers were applied in a grid to increase the odds of finding an area of interest containing multiple grains and high angle grain boundaries. EBSD was carried out on a 30x26 µm FOV as shown in the inverse pole figure (IPF) map in figure 4. As the IPF map shows, the test FOV contains portions of 5 grains, 3 triple junctions, and a large iron intermetallic particle, which is common in 1100 Al [31].
Fig. 3 Surface of the 1100 Al tensile sample and the FIB deposited Pt markers used for EBSD and test FOV alignment.
The large
rectangular marker at the lower right is used to find and orient the grid. The test FOV is designated with the dashed box. The small irregular features are iron intermetallic particles.
7
Fig. 4 Inverse pole figure map of the test FOV. The black spots within the grains are the locations of the Pt alignment markers and the large black shape at the lower right is an iron intermetallic particle.
Fig. 5 Test FOV patterned with APTMS and 55 nm diameter AuNPs. The dark areas are the locations of the Pt markers or iron intermetallic particles.
8
Following EBSD, the surface was hydroxylated and patterned (using APTMS as the silane) with 55 nm diameter AuNPs following the procedure outlined in the experimental section. Figure 5 shows the patterned surface. Note that an AuNP aggregate formed over the iron particle at the lower right. This resulted from the sample sitting faceup in the AuNP solution and can be avoided if the sample is placed facing downwards in the solution. However, these types of aggregates can be desirable as experiments can be performed at two length scales on the same specimen by using the aggregates that form over the surface for a larger field of view, and individual AuNPs in the same pattern for a smaller FOV (as shown in figure 1). Tests were performed using a Kammrath and Weiss tension-compression stage mounted in a FEI Quanta 200 3D SEM. After loading the sample and pumping down the SEM chamber, calibration images were captured for later image distortion correction [32]. The test sample was then strained at a grip displacement rate of 0.8 µm/s to a total strain of approximately 9%. Since the SEM utilizes a scanning process to capture images, the sample was loaded in steps and held at a constant displacement for image capture. Steps of 5 µms were initially used until strain localization was observed, after which steps were taken in 15-50 µm increments. Post-test, DIC was performed on the images and the data was corrected for distortions using a modified version of the SEM image distortion correction routine outlined in reference 32. Results & Discussion SEM-DIC allows for full-field strain and displacement fields to be tracked at multiple load steps throughout a test. In this section, the axial strain field will be shown since it clearly demonstrates the ability of high-resolution SEMDIC to reveal strain localization within the microstructure. Figure 6 shows the axial strain field at four points during the test. The DIC strain calculated using the small FOV shows well-defined bands of high strain. Strain localization was particularly evident at the iron intermetallic particle on the bottom right of the micrograph where axial strains were as high as 20%. By combining the DIC results with EBSD data, the strain field can be related back to the underlying microstructure. Aluminum is a face centered cubic metal (FCC) and deforms primarily by dislocation slip on {111} planes in the directions at room temperature.
Using the EBSD orientation data, the {111} plane traces can be
determined and represented by a black line in each grain as shown in figure 7. As seen in figure 7, there are elements of the strain localization that are aligned with a {111} plane trace within each grain. From this it can be inferred the high-resolution pattern created with the self-assembled AuNP patterning technique allows for the capture of strain localization from dislocation slip. Slip can also be captured using a larger speckle pattern (as shown in figure 8), but the resulting strain localization will appear more diffuse, and it can be difficult or impossible to determine the exact location of strain localization. High-resolution patterns are particularly important in materials with small grain sizes or complex local deformation heterogeneities.
9
Fig. 6 DIC calculated axial strain field evolution for a tensile test on 1100 Al. High strain is observed around the iron intermetallic particle at the bottom right of the strain fields. SEM parameters: 30kV, 91pA, 12.4mm working distance, 10 microsecond dwell, 8 image integrations, 1024x884 image size. DIC parameters: 31x31 pixel subset size, 1 pixel step size.
10
Fig. 7 Axial strain field for the final test image after the load has been removed. The black lines within grains depict {111} plane traces.
Several bands of strain
localization are aligned with {111} plane traces, suggesting dislocation slip. Figure 8 shows the axial strain fields at the same points during the test, but using the AuNP aggregates as the pattern (at a lower magnification) rather than the individual nanoparticles (at a higher magnification) as shown in figures 6 and 7. In figure 8, strain localization is still apparent, but the bands appear substantially more diffuse than those in figure 6. This is a result of each pixel in figure 6 equating to 29nm, whereas each pixel in figure 8 is 64nm. Although the larger pixel to nm ratio limits the spatial resolution that can be achieved with a wider FOV, using the AuNP aggregates as a wider FOV pattern is useful for acquiring an understand of the overall strain behavior while simultaneously examining small FOVs at high resolution through patterns of individual AuNPs.
11
Fig. 8 Zoomed out DIC calculated axial strain field evolution for a tensile test on 1100 Al. The dashed box marks the area shown in figure 6. Strain localization is blended together due to the lower spatial resolution.
SEM parameters: 30kV, 91pA, 12.4mm working distance, 10
microsecond dwell, 4 image integrations, 2048x1768 image size. DIC parameters: 75x75 pixel subset size, 1 pixel step size. Conclusions An AuNP self-assembly technique originally developed to create SERS substrates [12-14] has been adapted to generate high-resolution SEM-DIC surface patterns, with the potential to be applied to multi-scale experiments. This patterning technique has the flexibility to be applied to both metallic and non-metallic substrates, complex geometries, and delicate test samples. The small size of the tracking markers enables significantly higher spatial resolutions from SEM-DIC analysis than is currently achievable with existing techniques. The pattern is evenly generated over the surface of the substrate, allowing for very wide fields of view or multiple areas of interest to be 12
investigated simultaneously. This technique enables future SEM-DIC experiments to investigate material behavior at the microstructural level with unprecedented spatial resolution. Experimental results from the application of this patterning technique to produce a multi-scale pattern were presented. The fine pattern achievable with this technique enables high magnification experiments that can capture local strain heterogeneities that would be missed with existing patterning techniques. By using a slightly aggregated AuNP solution, a large pattern using the AuNP aggregates can be created on the surface. This can be used in tandem with the fine, high magnification pattern of individual AuNPs in order to examine deformation at two different length scales. Acknowledgements This work was supported by the National Science Foundation under Grant No. 0927530. Support for this work was also provided by the Rackham Graduate School Non-Traditional Student Fellowship from the University of Michigan. Portions of this work were performed at the Electron Microbeam Analysis Laboratory (EMAL) at the University of Michigan. References [1]
Sutton MA, Li N, Joy DC, Reynolds AP, Li X (2007) Scanning electron microscopy for quantitative small and large deformation measurements part I: SEM imaging at magnifications from 200 to 10,000. Exp Mech 47:775–787. doi: 10.1007/s11340-007- 9042-z
[2]
Sutton MA, Li N, Garcia D, Cornille N, Orteu JJ, McNeill SR, Schreier HW, Li X, Reynolds AP (2007) Scanning electron microscopy for quantitative small and large deformation measurements part II: Experimental validation for magnifications from 200 to 10,000. Exp Mech 47:789–804. doi: 10.1007/s11340-007-9041-0
[3]
Sutton MA, McNeill SR, Helm JD, Chao YJ (2000) Advances in two-dimensional and three-dimensional computer vision. In: Rastogi P (ed) Photomechanics, Top Appl Phys 77. Springer Berlin / Heidelberg, pp. 323–372. doi: 10.1007/3-540- 48800-6 10
[4]
Sutton MA, Orteu JJ, Schreier HW (2009) Digital image correlation (DIC). In: Image Correlation for Shape, Motion and Deformation Measurements. Springer US, p. 83. doi: 10.1007/978-0-387-78747-3 5
[5]
Scrivens WA, Luo Y, Sutton MA, Collette SA, Myrick ML, Miney P, Colavita PE, Reynolds AP, Li X (2007) Development of patterns for digital image correlation measurements at reduced length scales. Exp Mech 47:63–77. doi: 10.1007/s11340-006-5869-y
[6]
Tschopp MA, Bartha BB, Porter WJ, Murray PT, Fairchild SB (2009) Microstructure-dependent local strain behavior in polycrystals through in-situ scanning electron microscope tensile experiments. Metall Mater Trans A 40:2363–2368. doi: 10.1007/s11661-009-9938-6
[7]
Kammers AD, Daly S (2011) Small-scale patterning methods for digital image correlation under scanning electron microscopy. Meas Sci Technol 22, 125501.
13
[8]
Walley JL, Wheeler R, Uchic MD, Mills MJ (2012) In-situ mechanical testing for characterizing strain localization during deformation at elevated temperatures. Exp Mech 52:405–416. doi: 10.1007/s11340-0119499-7
[9]
Li N, Guo S, Sutton MA (2011) Recent progress in e-beam lithography for SEM patterning. In: Proulx T (ed) MEMS and Nanotechnology, Volume 2, Conference Proceedings of the Society for Experimental Mechanics Series, Vol. 2, Springer New York pp. 163–166. doi: 10.1007/978-1-4419-8825-6 23
[10]
Berfield TA, Patel JK, Shimmin RG, Braun PV, Lambros J, Sottos NR (2007) Micro- and nanoscale deformation measurement of surface and internal planes via digital image correlation. Exp Mech 47:51–62. doi: 10.1007/s11340-006-0531-2
[11]
Berfield TA, Patel JK, Shimmin RG, Braun PV, Lambros J, Sottos NR (2006) Fluorescent image correlation for nanoscale deformation measurements. Small 2:631–635.
[12]
Freeman RG, Grabar KC, Allison KJ, Bright RM, Davis JA, Guthrie AP, Hommer MB, Jackson MA, Smith PC, Walter DG, Natan MJ (1995) Self-assembled metal colloid monolayers: An approach to SERS substrates. Science 267:1629–1632.
[13]
Grabar KC, Freeman RG, Hommer MB, Natan MJ (1995) Preparation and characterization of au colloid monolayers. Anal Chem 67:735–743.
[14]
Grabar KC, Allison KJ, Baker BE, Bright RM, Brown KR, Freeman RG, Fox AP, Keating CD, Musick MD, Natan MJ (1996) Two-dimensional arrays of colloidal gold particles: a flexible approach to macroscopic metal surfaces. Langmuir 12:2353–2361.
[15]
Fan M, Brolo AG (2009) Silver nanoparticles self assembly as SERS substrates with near single molecule detection limit. Phys Chem Chem Phys 11: 7381–7389.
[16]
Park S, Yang P, Corredor P, Weaver MJ (2002) Transition Metal-Coated Nanoparticle Films:! Vibrational Characterization with Surface-Enhanced Raman Scattering. J Am Chem Soc 124: 2428-2429.
[17]
Frens G (1973) Controlled nucleation for the regulation of the particle size in monodisperse gold suspensions. Nat Phys Sci 241:20–22.
[18]
van den Brand J, Snijders PC, Sloof WG, Terryn H, de Wit JHW (2004) Acid-Base Characterization of Aluminum Oxide Surfaces with XPS. J Phys Chem B, 108:6017-6024.
[19]
Liascukiene I, Aissaoui N, Asadauskas SJ, Landoulsi J, Lambert JF (2012) Ordered nanostructures on a hydroxylated aluminum surface through the self-assembly of fatty acids. Langmuir 28:5116–5124.
[20]
Delebecque A, Thomas C, Pradier CM, Methivier C, Coffre E, Paoli H, Carre M (2008) Reactivity of a hydroxylated alumina surface in the presence of NO diluted in N2: A PM-IRRAS in situ investigation. The J Phys Chem C 112:2964–2971.
[21]
Delebecque A, Thomas C, Pradier CM, Methivier C, Paoli H, Coffre E, Carre M (2008) On the reactivity of NO/N2 mixtures with aluminum surfaces: A combined PM-IRRAS and QCM investigation. Surf Sci 602:283-290.
14
[22]
Franquet A, Terryn H, Vereecken J (2003) Composition and thickness of non-functional organosilane films coated on aluminium studied by means of infra-red spectroscopic ellipsometry. Thin Solid Films 441:76– 84.
[23]
van Ooij WJ, Zhu D (2001) Electrochemical impedance spectroscopy of Bis-[Triethoxysilypropyl] Tetrasulfide on Al 2024-T3 substrates. Corrosion 57:413-427.
[24]
Franquet A, Biesemans M, Terryn H, Willem R, Vereecken J (2006) Study of the interaction of hydrolysed silane solutions with pre-treated aluminium substrates. Surf Interface Anal 38:172–175.
[25]
Joshi S, Fahrenholtz WG, O’Keefe MJ (2011) Effect of alkaline cleaning and activation on aluminum alloy 7075-T6. Appl Surf Sci 257:1859–1863.
[26]
Mueller RM, Buchal C, Oversluizen T, Pobell F (1978) Superconducting aluminum heat switch and plated presscontacts for use at ultralow temperatures. Rev Sci Instrum 49:515-518.
[27]
Kim T, Lee CH, Joo SW, Lee K (2008) Kinetics of gold nanoparticle aggregation: Experiments and modeling. J Colloid Interface Sci 318: 238–243.
[28]
Dickinson E, Eriksson L (1991) Particle flocculation by adsorbing polymers. Adv Colloid Interface Sci 34: 1-29.
[29]
Hunter RJ (1987) Foundations of Colloid Science, Vol 1, Oxford University Press, New York, pp 89-103.
[30]
Prof.
Christian
Franck,
Brown
University
(2012),
http://franck.engin.brown.edu/~christianfranck/FranckLab/Downloads.html. [31]
Bray JW (1990) Aluminum Mill and Engineered Wrought Products, Properties and Selection: Nonferrous Alloys and Special-Purpose Materials, Vol 2, ASM Handbook (ASM International) pp 29–61.
[32]
Sutton MA, Li N, Garcia D, Cornille N, Orteu JJ, McNeill SR, Schreier HW, Li X (2006) Metrology in a scanning electron microscope: theoretical developments and experimental validation. Meas Sci Technol 17:2613-2622.
15