SELF-AFFINE SCALING DURING INTERFACIAL CRACK FRONT PROPAGATION St´ephane Santucci, Knut Jørgen Måløy, Fysisk Institutt, Universitetet i Oslo, P. O. Boks 1048 Blindern, N-0316 Oslo 3, Norway. Renaud Toussaint and Jean Schmittbuhl. Institut de Physique du Globe de Strasbourg - UMR 7516, 5, rue Ren´e Descartes, 67084 Strasbourg Cedex, France.
Abstract. We have performed an experimental study of slow crack front propagation through a weak plane of a transparent Plexiglas block. Spatial random toughness fluctuations along the weak interface generate a rough crack line in pinning locally the crack front, and leads to an intermittent dynamics of the crack front line. Using a high speed and high resolution camera we are able to capture the features of this complex dynamics. A new analysis procedure is proposed in order to measure the waiting time fluctuations, and study the local burst dynamics and structure along the crack front during its propagation. First, we confirm previous results [1]: the fracture front dynamics is governed by local and irregular avalanches with very large size and velocity fluctuations, and can be described in terms of a FamilyVicsek scaling with a roughness exponent ζ ≃ 0.6 and a dynamic exponent κ ≃ 1.2. Then, focusing in particular on the avalanches structure, we show that the system exhibits self-affine scaling with the same roughness exponent ζ for the local burst and the fracture front line itself. Key words: Interfacial fracture, depinning transition, self-affinity, dynamic scaling.
1. Introduction Since the pioneering work of Mandelbrot, Passoja and Paullay [2], it is now well established that crack surfaces are self-affine objects. The scaling properties of the morphology of cracks manifest themselves through self-affine long range correlations [2, 3, 4, 5, 6, 7, 8, 9] with a roughness exponent which is found to be very robust for different materials and a broad range of length scales. However, the physical role played by the heterogeneities which lead to these self-affine long range correlations is not well understood. In recent years front propagation in disordered media has become a challenging problem trying to describe the dynamics of interfaces in many different physical systems such as crack fronts [9], magnetic domain walls [10], or wetting [11].
c 2005 Springer. Printed in the Netherlands.
2
S. SANTUCCI ET AL.
Actually there exists few experimental data describing crack front propagation through heterogeneous material, essentially due to the difficulty of making direct observation and following the crack front line. Indeed, the crack front line growing in a 3d heterogeneous medium has itself a 3-d shape with different in-plane and out-of-plane roughnesses, respectively ζk and ζ⊥ . Therefore, the interfacial crack front problem simplifies the 3-d original one, both experimentally [12, 13] and theoretically [14]. Since the crack front is constrained geometrically to lie in the plane where the motion is driven by the stress transmitted through the two elastic plates, it is possible to perform direct visualization and to follow the fracture front line. So far most experiments on fracture front lines have been focused on the fracture front line morphology leading to the estimated roughness exponent ζ = 0.55 ± 0.03 [12], followed up by a longer study leading to ζ = 0.63 ± 0.03 [13]. Recently the interfacial crack front propagation has started to be investigated [1]. This study has shown that the fracture front line dynamics is intermittent the depinning on asperities triggers local instabilities- and can be described in terms of a Family-Vicsek scaling [15] with a roughness exponent ζ = 0.6 and a dynamic exponent κ = 1.2. In contrast to earlier numerical and theoretical studies [8, 16, 17, 18], recent numerical simulations interpreted as a stress-weighted percolation problem [19] give consistent results on the experimental roughness and dynamic exponents. In this work, we went further on in the investigation of the local dynamics and this study appears as the continuation of the experimental work initiated by Måløy and Schmittbuhl [1]. In the first part, we will recall the experimental set-up and the sample preparation that permits us the direct observation of an in-plane crack front which propagates into the annealing plane of two transparent polymethylmethacrylate (PMMA) plates [12]. It is important to underline that now, using a really powerful high speed and high resolution camera (Photron Ultima), we are able actually to capture the details of the complex crack front dynamics. Then, in order to analyze the local burst dynamics and in particular to extract the local waiting time fluctuations, we propose in the second section a new analysis procedure. Both this analysis and the fast video recording confirm the previous observations and results, showing that the dynamics of the fracture front is driven by local and irregular avalanches with very large size and velocity fluctuations. In this paper we would like to focus on the scaling of the crack front line. We will first confirm that the development of the crack roughness follows a FamilyVicsek scaling and then examining in details the structure of the local avalanches we will show that the system exhibits self-affine scaling with the same roughness exponent ζ for the whole set of local bursts, and for the fracture front line itself. More details concerning the dynamics and in particular the velocity and waiting time fluctuations will be given elsewhere [20].
3
INTERFACIAL CRACK FRONT PROPAGATION
2. Experimental procedure 2.1. SAMPLE PREPARATION
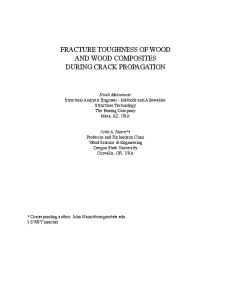
Two Plexiglas plates (32 × 14 × 1cm & 34 × 12 × 0.4cm) are annealed together at 205◦ C during 30 mn under several bars of normal pressure, in order to create a single block with a weak interface. Before the annealing procedure both plates are sand-blasted on one side with 50µm steel particles or 100µm glass beads. Sand-blasting introduces a random topography which induces local toughness fluctuations during the annealing process. In order to estimate the characteristic size of the local heterogeneities arising from the sand-blasting process, we have measured the profile of a sand-blasted Plexiglas surface, using a white light interferometry technique (performed at SINTEF laboratory). We found that these local irregularities have an upper cut-off size estimated as 18 ± 2µm.
y (mm)
0.4
0.3
0.2
0.1
0.2
0.4
0.6
0.8
1
1.2
x (mm)
Figure 1. Two dimensional map of a sand blasted PMMA surface: white patches correspond to asperities higher than 0.85µm, which corresponds to the standard deviation of the height of this profile.
The two key points of the procedure are the transparency of the material allowing the direct observation of the fracture front, and the random toughness introduced along the interface which generates a rough crack line in pinning the crack front. 2.2. MECHANICAL AND OPTICAL SET-UP
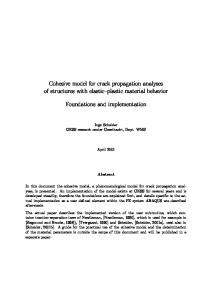
While the upper Plexiglas plate is clamped to a stiff aluminium frame, a press applies a normal displacement to the lower one (1 cm thick) corresponding to a crack opening in mode I configuration (pure tensile mode) at a low and constant rate ∼ 10µm.s−1 . A high speed and high resolution camera (Photron Ultima) mounted on a microscope allows us to follow the slow crack front propagation. Using this camera at a spatial resolution of 1024 × 512 pixels, and an acquisition rate of 1000 f.p.s. we can follow the crack front during ≃ 12s (obtaining ≃ 12000 images). In this work, we will focus in particular on a given experiment with an average crack front speed hvi = 28.1µm/s an a pixel size a = 3.5µm. It is important
4
S. SANTUCCI ET AL.
Figure 2. Sketch of the experimental setup: a thick PMMA plate (PL) is clamped into a rigid frame (F). A normal displacement is imposed by a press (Pr) on the thin plate with a cylindrical rod. A high speed and high resolution camera (C) mounted on a microscope follows the crack front propagation.
to notice that the pixel size is smaller than the characteristic scale of these local heterogeneities, estimated as 18 ± 2µm arising from the sand-blasting process. In a forthcoming paper [20], we will present using an extended set of data that all of these preliminary results are stable while changing the experimental conditions (varying both the average front line speed and the pixel size). 3. Analysis procedure and results 3.1. SCALING ANALYSIS OF THE CRACK FRONT
Image analysis is performed to extract the crack front by computing the gradient of the gray levels. A typical result is shown on figure 3. The front position being
y (mm)
0.6
0.4
0.2
0.5
1
1.5
2
2.5
3
3.5
x (mm)
Figure 3. Typical example of a picture recorded by the high speed camera (Photron Ultima) during an experiment with an average crack front speed hvi = 28.1µm.s−1 . The pixel size is a = 3.5µm. During this experiment, the camera recorded in total 9000 frames with a time delay of 1ms for each picture. The crack front propagates from bottom to top. The thick solid line represents the interface separating the uncracked (in black) and cracked parts extracted after image analysis. We superimpose 3 fracture front positions for later times (0.5, 1 and 2s), suggesting the crack pinning and the burst activity.
INTERFACIAL CRACK FRONT PROPAGATION
5
defined as the contrast interface between the uncracked (in black) and cracked parts is given by y = h(x, t). The power spectrum P(k) of the deviations from the mean front position h(x)− hh(x)i, averaged over all the crack front position detected during an experiment (in this case 9000 fronts), as function of the wave number k, is shown on figure 4. The slope of the best fit P(k) ∝ k−(1+2ζ) gives an estimation of the roughness exponent ζ = 0.54 ± 0.06. This value for the roughness exponent is consistent with previous careful estimations ζ = 0.55±0.05 [12] and ζ = 0.63±0.03 [13], where it has been extensively checked for fronts at rest over a much larger range of scales (around 3.5 decades), and using several techniques.
7
10
6
P(k)
10
5
10
4
10
3
10
2
10 0.001
0.01
0.1
1
k / ko
Figure 4. Power spectrum of the deviations from the mean front position h(x) − hh(x)i as function of the reduced wave number k/ko with k0 = 2π/(3.5µm) averaged over 9000 crack front positions detected. The lines correspond respectively to the best fits P(k) ∝ k−(1+2ζ) of all the spectrum (dotted line), and excluding small and high wave number, 0.25 ≥ k/ko ≥ 10−2 (dashed line). An average over the slopes of the fits gives an estimation of the roughness exponent: ζ = 0.54 ± 0.06. The reduced quantity is k0 = 2π/(3.5µm). The vertical axis is arbitrary.
Moreover, we confirm that the development of the crack roughness follows rather well the Family-Vicsek scaling ansatz with a roughness exponent ζ = 0.6 and a dynamic exponent κ = 1.2 ± 0.2. Considering the power spectrum of the relative position ∆h(x, t) = h(x, t) − hi , where hi = h(x, ti ) is the initial front, the Family-Vicsek scaling ansatz can be written in the following way. ( b x≪c (1+2ζ)/κ 1/κ P(k, ∆t) = ∆t G(k∆t ) with G(x) ∝ x−(1+2ζ) x ≫ c where ∆t = t − ti is the time delay between the analyzed images, b and c are characteristic constants.
6
S. SANTUCCI ET AL.
7
10
∆t = 5 s 0
10 6
P(k,∆t)∆t−(1+2ζ)/κ
P(k,∆t)
10
5
10
4
10
∆t = 20 ms
−2
10
−4
10
3
10
2
10
−3
10
−2
−1
10
10
k/k
o
0
10
−2
10
−1
10
0
1
10
2
10
10
3
10
1/κ
k/k (∆t/∆t ) o
o
Figure 5. Left: Power spectrum of the relative position ∆h(x, t) as function of the reduced wave number k/ko with k0 = 2π/(3.5µm) for logarithmically increasing time delays ∆t = t − ti , from ∆t = 20ms to ∆t = 5s. Right: Data collapse for the scaling function G(k∆t1/κ ) = P(k, ∆t)∆t−(1+2ζ)/κ , showing a dynamic Family-Vicsek scaling with a roughness exponent ζ = 0.54 and a dynamic exponent κ = 1. The power spectra of the relative position ∆h(x, ∆t) = h(x, t) − h(x, ti ) have been averaged over 4000 different initial front hi = h(x, ti ). The dashed lines are guides for the eyes and have a slope of -2.1. The horizontal axis correspond to reduced dimensionless quantities k/k0 , t/t0 , with k0 = 2π/(3.5µm), and ∆t0 = 1ms. The vertical axis are arbitrary.
On Fig. 5 to the left, we show the power spectrum of the relative position ∆h(x, t) for logarithmically increasing time delays ∆t, from ∆t = 20ms to ∆t = 5s, averaged over 4000 different initial front h(x, ti ). When increasing the time delays ∆t, we observe a crossover behaviour from a flat spectrum - indicating that no spatial correlations are present at small time delays ∆t -, towards a power law behaviour at larger times ∆t, consistent with the self-affine long range correlations previously observed P(k) ∝ k−(1+2ζ) with a roughness exponent ζ = 0.54. Then, we plot on figure 5 to the right, the scaling function G(k∆t1/κ ) = P(k, ∆t)∆t−(1+2ζ)/κ as a function of k∆t1/κ with a roughness exponent ζ = 0.54 previously measured. A satisfying data collapse is obtained for a dynamic exponent κ = 1. Performing the same procedure for different experiments leads to the following estimation for the dynamic exponent κ = 1.2 ± 0.2 with a roughness exponent of ζ = 0.6, consistent with previous experimental results [1]. 3.2. WAITING TIME MATRIX W AND LOCAL FRONT VELOCITY MATRIX V
In order to study the local burst dynamics during the slow crack propagation we have computed a waiting time matrix W(x, t). The fracture front lines extracted from image analysis of the digital pictures (see Fig. 3) were added to obtain a waiting time matrix W. This matrix has the dimension of the original image and an initial value equal to zero. We add the value 1 to the matrix element w
INTERFACIAL CRACK FRONT PROPAGATION
7
corresponding to each pixel of the front line position detected. This procedure has been performed for all frames of a given experiment in order to obtain the final waiting time matrix W for each experiment. Then, a local normal speed of the interface V(x, t) can be deduced by computing the matrix of the inverse waiting time w times the ratio of the pixel size a on the typical time between two images δt. Therefore, we can associate to each pixel corresponding to the crack line in a . each image, a local front velocity v = wδt 1
10
0
10
−1
10
−2
P ( hVV i )
10
2.6
fit : P ∝ x
−3
10
−4
10
−5
10
−6
10
−7
10
−2
10
−1
10
0
10
V hV i
1
10
2
10
3
10
v Figure 6. Distribution of the local front velocity normalized by the average crack speed hvi for an experiment with an average crack front speed hvi = 28.1µm/s. The solid line represents a fit for velocities 2 times larger than the average crack front speed hvi and has a slope of −2.6.
Finally, we can obtain the probability distribution functions of the local waiting time w and the local front velocity v, in estimating the occurrence number of each measured waiting time or velocity on all pixels in all fracture front line v images. A typical example of a distribution P( hvi ) of the local front velocity v, obtained for an experiment with an average crack front speed hvi = 28.1µm/s is shown on Fig. 6, in log-log scale. For velocities larger than the average crack front speed hvi, we clearly observe that the local front velocities are power law distributed P(v/hvi) ∝ (v/hvi)−η with an exponent η ≃ 2.6. This power law behaviour for the velocity distribution reveals a rich and non trivial underlying dynamic as one can observe on a fast video recording that the crack front is growing through irregular avalanches on all length scales. Since in this study we would like to focus on the local burst dynamic, more details concerning the velocity and waiting time fluctuations will be given elsewhere [20], and now we are going to examine in particular the structure of the local avalanches.
8
S. SANTUCCI ET AL.
3.3. LOCAL BURST STRUCTURE
In order to analyze the local burst activity, let us consider the velocity matrix V. We can generate a clipped velocity matrix from V by setting the matrix elements v equal to one for v > C · hvi and zero elsewhere. We present on Fig. 7 the spa-
y (mm)
0.6
0.4
0.2
0.5
1
1.5
2
2.5
3
3.5
x (mm)
Figure 7. Spatial distribution of clusters size S . White clusters correspond to velocities v > C · hvi with a clip level C = 8, during an experiment with an average crack front speed hvi = 28.1µm.s−1 . The pixel size is a = 3.5µm. The crack front propagates from bottom to top.
tial distribution of clusters of different sizes S obtained from the clipped matrix for a clip level C = 8. The white clusters correspond to velocities eight times v > C = 8, which was for this experiment larger than the average front speed hvi −1 hvi = 28.1µm.s . The clusters connected to the first and the last front, and thus belonging to the upper and lower white parts are excluded from the analysis. −1
10
raw data logarithmic binning fit : P ∝ x−1.7
−2
10
−3
P(S)
10
−4
10
−5
10
−6
10
−7
10
1
10
2
10
3
10
4
10
S ( µm2 )
Figure 8. Distribution of the burst sizes S for an experiment with an average crack front speed v > C = 8. Notice that hvi = 28.1µm.s−1 and a pixel size a = 3.5µm. The clip level used here hvi the logarithmic binning allows to extract the scaling law underlying the large statistics, over a large range of event sizes. The dashed line represents the best fit P(S ) ∝ S −γ and gives an exponent γ = 1.7
INTERFACIAL CRACK FRONT PROPAGATION
9
In Fig.8, the cluster sizes S distribution P(S ) is given in a double logarithmic scale. We clearly observe a power law behaviour P(S ) ∝ S −γ with an exponent γ = 1.7 proving that the burst dynamics occurs on all length scales. We have checked that this critical behaviour, and in particular the exponent γ, is really stable: normalizing by the average burst size hS i, we can rescale all the different distributions corresponding to diverse experimental conditions and a wide range of clip level values (see [20] for more details). We expect a correlation between the burst structure on small scales and the self-affine scaling of the crack front line on larger scales. In order to investigate the spatial scaling on small scales in detail, we have for each cluster S chosen the smallest bounding box enclosing it. The size of the bounding box gives the length scale Ly of the clusters along the growth direction and the length scale L x of the clusters in the direction of the average fracture frontline.
2
10
〈V〉 =28.1 µm/s ; a =3.5 µm Ly = Lx
〈Ly〉 (µm)
fit for Lx>20 µm : Ly ∝ L0.60 x
1
10
Ld ~ 18 µm 0
10 0 10
1
10
2
〈L 〉 (µm)
10
3
10
x
Figure 9. Average length scale hLy i in function of the average length scale hL x i. The dashed line is a fit to the data points for L x > 20 µm and has a slope 0.60 consistent with the roughness exponent of the fracture front line. The dotted line represents the curve y = x and serves as a guide for the eye.
Figure 9 shows the dependence of the average length scale hLy i as function of hL x i in a double logarithmic plot for the same previous experiment (hvi = 28.1µm.s−1 , and a = 3.5µm), for a given clip value C = 8. We clearly see that the avalanche clusters become anisotropic above a characteristic length scale Ld ∼ 18µm. This typical size can be interpreted as a correlation length for the disorder introduced by the sand-blasting technique as we have observed previously on Fig. 1. Below Ld the local toughness is marked by the same individual asperity and as a result the clipped velocity bursts appear isotropic. A linear fit of the data points for L x > 20µm gives a slope 0.60 consistent with the roughness exponent ζ = 0.63 ± 0.03 of the fracture front line itself. This result shows that the sys-
10
S. SANTUCCI ET AL.
tem exhibits self-affine scaling with the same roughness exponent ζ for the local dynamic bursts as for the fracture front line itself, and brings a new confirmation of the roughness exponent determined in such interfacial crack experiments. It is important to note that most present theoretical and numerical works predict a lower value for this roughness exponent [8, 16, 17, 18]. 4. Conclusion We have performed an experimental study of slow interfacial crack front propagation. This work confirms previous experimentals results [1]: the fracture frontline dynamics can be described in terms of a Family-Vicsek scaling with a roughness exponent ζ ≃ 0.6 and a dynamic exponent κ ≃ 1.2. Moreover, we have observed that this dynamics is driven by local and irregular avalanches whose size and velocity are power law distributed. We show that the dynamics and the structure of the local bursts are playing a crucial role for the scaling and the dynamics of the crack front itself. In particular, above a typical size Ld ∼ 20µm, the burst size scales differently in the direction parallel and normal to the fracture front with an exponent consistent with the roughness exponent of the fracture front ζ ≃ 0.6. However, if it appears consistent to interpret this result as finite size effect related to the disorder, more experimental work is needed to control and change the typical disorder size, in order to be conclusive and affirm that this cut-off length scale really corresponds to the quenched disorder correlation length introduced by the sand-blasting procedure. Recent simulations interpreted as a stress-weighted percolation problem [19] give consistent results with the experimental roughness and dynamic exponent measured, in contrast to earlier numerical and theoretical studies [8, 16, 17, 18]. However so far, no theory or simulations have examined the dynamics and in particular the local burst activity of the crack line, and therefore it appears of central importance to develop these numerical studies. Acknowledgements We acknowledge E.L. Hinrichsen, M. Fleissner, and SINTEF laboratories in Oslo for their hospitality, permitting us to perform the white light interferometry measurements. We also thank L. Vanel, O. Ramos, A. Hansen, E.G. Flekkøy, and J.P. Vilotte for fruitful discussions. This work was supported by the CNRS/NFR PICS program, and the NFR Petromax and SUP program.
INTERFACIAL CRACK FRONT PROPAGATION
11
References 1 K. J. Måløy and Jean Schmittbuhl. Phys. Rev. Lett., 87, 105502 (2001) 2 B. B. Mandelbrot, D. E. Passoja, and A. J. Paullay. Nature, 308, 721 (1984); 3 S. R. Brown and C. H. Scholz. J. Geophys. Res., 90,12575 (1985); 4 E. Bouchaud, G. Lapasset, and J. Plan´es. Europhys. Lett., 13, 73 (1990); 5 J. Schmittbuhl, S. Gentier, and S. Roux. Geophys. Res. Lett., 20, 639 (1993); 6 B. L. Cox and J. S. Y. Wang. Fractals, 1, 87 (1993); 7 K. J. Måløy, A. Hansen, E. L. Hinrichsen, and S. Roux. Phys. Rev. Lett., 68, 213 (1992); 8 J. Schmittbuhl, F. Schmitt, and C. H. Scholz. J. Geophys. Res., 100, 5953 (1995). 9 E. Bouchaud. J. Phys, 9, 4319 (1997). 10 S. Lemerle, J. Ferr, C. Chappert, V. Mathet, T. Giamarchi and P. Le Doussal Phys. Rev. Lett., 80, 2849, (1998). 11 E. Rolley, C. Guthmann, R. Gombrovisch and V. Repain, Phys. Rev. Lett., 80, 2865, (1998). 12 J. Schmittbuhl and K. J. Måløy. Phys. Rev. Lett, 78, 3888 (1997); 13 A. Delaplace, J. Schmittbuhl, and K. J. Måløy. Phys. Rev. E, 60, 1337 (1999); J. Schmittbuhl, A. Delaplace, and K. J. Måløy. In Physical Aspects of Fracture. (eds E. Bouchaud), (Kluwer Academic Publishers, 2001) 14 J. Schmittbuhl, S. Roux, J. P. Vilotte and K. J. Måløy. Phys. Rev. Lett., 74, 1787 (1995). 15 F. Family and T. Vicsek. J. Phys. A, 18,L75 (1985). 16 J. P. Bouchaud, E. Bouchaud, G. Lapaset, and J. Planes. Phys. Rev. Lett., 71, 2240 (1993). 17 S. Roux and A. Hansen. J. Phys. I, 4, 515, (1994). 18 S. Ramanathan and D. Fisher. Phys. Rev. B, 58, 6026 (1998); 19 J. Schmittbuhl, A. Hansen and G. Batrouni. Phys. Rev. Lett., 90, 045505, (2003) 20 K. J. Måløy, S.Santucci, R.Toussaint and J. Schmittbuhl. submitted to Phys. Rev. Lett.