Standard Form of a Quadratic Function: 2 f(x)=a ± bx+c x
ExamDle 1: Classifying Functions Determine whether each function is linear or quadratic. Identify the quadratic, linear, and constant terms. ) 4 a. y=(2x+)(x—
b. f(x)=3(x 2 —2x)—3(x 2 —2)
Parabola:
Axis of Symmetry:
Vertex of a Parabola:
—
v=
—-
-=
—
+
1
x_ I
Axis of Symmetry
Corresponding Points:
I 4
4
6
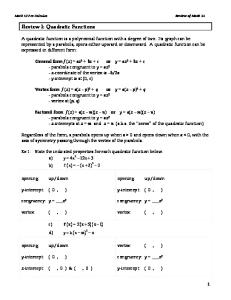
pej Points on a Parabola Use the parabola below to identify the vertex, axis of symmetry, points that correspond to P and Q, and the range.
Example 3: Fitting a Quadratic Function to 3 Points Find a quadratic function that includes th values in the table,
RealWorld Connection The table below shows the height of a column of water as it drains from its container. Using a calculator, model the data with a quadratic function. Graph the data and the function. a. Use the model to estimate the water level ai 35 seconds. Step I: I
j
Thii
kwJ
, 1s 20 3O 40s
12mm 100mm 3snm
00
Sten2
00mm f
0mm
i 1
20
ucj
y=-+Ix+c
i c
120.3333333
Step3:
—c Step4: 1i
20 20
b. Use the quadratic model to estimate the water level at 25 seconds. !E
;
/
—
c, Use the quadratic model to estimate the water level at 3 minutes.
/)
— -
‘ç
d. Is your prediction from part (c) reasonable? Explain.
U
Lk
‘
67.000
60.426
___________
__
Section 5.2 Graph of
=
Properties of Parabolas
+ C:
Example 1: Graphing a Function of the Form y Graph
y=_x2
=
+
c
+2.
Properties of Graphs of a Quadratic Function in Standard Form: Thegraphoff(x)=ax +bx+cisaparabolawhen aO. 2 When a> 0, the parabola opens -
When a i
t
v___t
C)
\
/
i_ ‘2
i=-
*
4
Example 2: Graphing a Function of the Form y = ax 2 Graph y
2 x
—
+
bx + c
2x —3. Label the vertex and the axis of symmetry.
Minimum Value:
Maximum Value:
Example 3: Finding a Minimum Value Graph y
=
2 3x
+
12x + 8. What is the minimum value of the function?
t
4
4
Example 4: Real-World Connection A company knows that 2.5p + 500 models the number it sells per month of a certain make of unicycle, where the price p can be set as low as $70 or as high as $120. Revenue from sales is the product of the price and the number sold. What price will maximize the revenue? What is the maximum revenue? —
1/
I
bC C
- N.).. /
1,)
5
Cl
&cCy SO
..
dL
—
0 1I v
I
—
r .
.
C :D
—
I
r cm.
i.
L
1 C
2
*
/
0
(9.
/
J ‘
11CC) 0
/
/.
C)CXC
r4
S’ ‘sO
C5N 1 CXJJ( “t
1:
.
Ct
jCS1C CX_
Factoring:
Greatest Common Factor (GCF):
!nkl: Finding Common Factors Factor each expression. 2 4 20xx a. + —12
1,. — 2 9 24n n
Quadratic Trinomial:
I
j!ej Factoring When ac>Oand h>O Factor x 2 +8x+7 I