ICTCT Extra-Workshop
Others
Safety measures at railway level crossings for pedestrians and bicyclists Richard van der Horst & Paul Bakker TNO Human Factors P.O. Box 23, 3769 ZG Soesterberg The Netherlands Tel. +31 346 356 451 Fax +31 346 353 977 Email:
[email protected]
ABSTRACT To improve the safety at railway level crossings in the Netherlands, a number of safety improving measures has been implemented. Commissioned by ProRail (formerly Railinfrabeheer B.V.), TNO Human Factors conducts studies to determine the effectiveness of these measures with respect to road users’ behaviour. Among other things, the measures included the separation of two-way traffic by solid white centre lines or physical medians, and separation of slow and fast road traffic at the railway level crossing. At several railway level crossings behavioural video-observations were conducted on the spot in a before-and-after study design. The video-recordings were analysed quantitatively by determining the speed of passenger cars and by conducting a time analysis of nonstopping/stopping behaviour of pedestrians and bicyclists. The behavioural analyses also included the rating of conflicts between road users. Most measures as implemented at railway level crossings improve the behaviour of pedestrians and bicyclists. Within built -up areas (speed-limit 50 km/h), both a solid white centre line and a physical median to separate two-way traffic at the railway level crossing reduce the speed with about 2.5 km/h. The centre line does not prevent slalom manoeuvres or centre-line crossings, whereas a physical median reduces the number of line crossings as well as the severity of bicycle -car overtaking conflicts. Removing slow traffic from the carriageway decreases both the number and the severity of car-bicyclist conflicts and seems to be safety-effective. It also appears to be effective to separate a nearby bicycle -path/road intersection further from a railway level crossing. Twelve metres further away helps already a lot.
INTRODUCTION The Netherlands have about 900 AHOB railway level crossings, crossings that are protected by automated half barriers. In the period between 1985 and 1997, a yearly average of 37 trainroad user collisions, 435 road user-crossing obstacle, 15 fatalities and 13.4 injuries occurred (Griffioen, 1999). As part of a large-scale project to improve the safety at railway level crossings in the Netherlands, a number of measures has been implemented by ProRail, the organisation that is responsible for the rail infrastructure in the Netherlands. For example, at all crossings the road -1-
ICTCT Extra-Workshop
Others
signals were replaced by much more conspicuous LEDs. Other measures included the extension or placement of barriers for pedestrians and bicyclists, separation of two-way traffic by solid centrelines or physical medians, or separation of bicycle and motorised traffic at the railway level crossing. Railned Railway Safety (now: Netherlands Railway Safety Authority) developed a methodology to evaluate effects of these measures on the safety at railway level crossings with elements including behavioural observations by video, speed measurements, interviews with road users, and conspicuity measurements (Schenk, 2000). Under commission of ProRail TNO Human Factors is conducting studies to determine the effectiveness of these measures with respect to the expected behaviour of road users.
METHOD Recordings At several railway level crossings behavioural observations were conducted based on video recordings on the spot in a before-and-after study design. For both the before and the after measurement, video recordings were made during two or three days (dependent on the expected traffic volumes) from 7 a.m. to 7 p.m. In total 48 hours of video recordings are available for each location for the two-day observations (24 hours during the before period and 24 hours with the measure implemented) and 72 hours of video recordings for the locations with three-day observations. By applying time-lapse video with a reduction factor of five, a 12 hours period was recorded on one tape (Super VHS). The time was displayed visually in the picture with an accuracy of 1/25 s and could also be read automatically with an accuracy of 1/50 s. We applied black-white video cameras because of the better resolution and higher light sensitivity compared to colour cameras. The video recordings were made from a high camerastandpoint (unobtrusively mounted at a height of at least at 4.5 m). To accommodate accurate speed measurements, also real-time video-recordings were made for one day between 7 and 11 a.m. Analysis We defined for each measure what was to be expected with respect to the behaviour of road users and where we had to focus on for the analysis of the video recordings. Moreover, traffic volumes were counted from video differentiated by type of road user and direction each quarter of an hour. We made use of the commercially available software package OBSERVER specially developed to analyse the behaviour of people in the time domain. Together with the semiautomated video analysis equipment VIDARTS of TNO Human Factors, the registration of exact moments relevant events occurred was conducted. The moments of activation of the railway level crossing were determined automatically by detecting the onset of the red signal and/or the decent of the barrier. These moments were stored and used in a second round to detect the active periods for further analysis. By slowly moving the tape, the moments of passing the red signal by pedestrians, bicyclists or motorists were indicated by an operator and stored. The severity of running the red signal was categorised in the following risk categories with the moment of crossing:
-2-
ICTCT Extra-Workshop
O A B C D E1 E2 F G
Others
between the beginning of red and the beginning of the barrier descent, between the beginning of the barrier descent and the moment the barriers are fully down, between the moment the barriers are closed till 5 s before train arrival, 5 s before arrival of the train, in between two trains, within 5 s after the train has left the intersection area, within 5 s after the second train has left the intersection area, between 5 s after the train and the opening of the barriers, during the opening of the barriers (until the red signal is switched off).
In category O (at some locations not counted) a part of the road users crosses in the clearance phase at the beginning of red (normal behaviour). Category D is the most risky one, whereas A and G are less risky but also then one consciously makes the decision to cross during the red signal. In case one is crossing while the barriers are opening and then close again because of a second train, this event is counted as a G and not as a D. Where relevant, the character and severity of encounters were scored according to the criteria of the conflict observation technique DOCTOR (Kraay, van der Horst & Oppe, 1986). A conflict is a situation where two road users approach each other in time and space such that a collision is imminent when course and speed remain unchanged. The severity of a conflict depends on the time margin that is left (Time-To-Collision TTC or Post-Encroachment Time PET) and the estimated resulting injury impact. The severity scores range between 1, 2 (slight conflicts) and 3, 4 or 5 (serious conflicts). Serious conflicts have the most direct relationship with accidents. Quantitative speed measurements were made from video recordings (50 fields/s) with the help of VIDARTS (see also Van der Horst & Bakker, 2002). Only free-driving (having at least a headway of 5 s to a lead vehicle) vehicles were included in the speed analysis.
RESULTS Extension of barriers for pedestrians At two locations the barriers for pedestrians were extended to close the entire gap at the sidewalk. The results of this measure were already given by Van der Horst and Bakker (2002). 2). The number of risky crossings (category B-F) decreases, as well as the number of pedestrians that start walking while the barriers are opening (cat. G). However, there seems to be a migration effect to the other side of the road, since the number of pedestrians crossing during red at the open side at the other side of the road increases. Pedestrians that are crossing intentionally during red are difficult to stop. Bicycle path at open side 3/4 or 4/4 closed At two locations the barriers at the open side of the railway level crossing were extended ov er the bicycle path, in such a manner that the bicycle path was closed for 3/4 or 4/4, respectively. The 3/4-closing does not give clear effects, but the presence of the barrier for the 4/4-closing reduces the number of red runners in the risky categories considerably. Also for the most risky category D (crossing in between two trains) the number is reduced (Van der Horst & Bakker, 2002). For pedestrians making use of the bicycle path in opposite direction, the number of crosses during red in the risky categories (category B-F) does not differ before and after at the
-3-
ICTCT Extra-Workshop
Others
location with the 3/4 barrier, but a 4/4 closing prevents pedestrian crossings during red in categories B-F almost completely. However, at the 4/4 closed bicycle path the enclosure of both bicyclists and pedestrians between the barriers does actually occur (van der Horst, Martens & Bakker, 2001) and especially countermeasures should be taken to give bicyclists a safe place to stay waiting. Separation of two-way traffic by solid centre line of physical median At one location within a built-up area (location L10, Alkmaar, speed limit 50 km/h) first a wide solid centre line was installed and several months later this measure was replaced by a physical median, see Fig. 1.
Fig. 1 Location L10 (Alkmaar) in the Before situation (left top, centreline width about 0.10 m), with wide solid white centre line (right top, width about 0.30 m) and physical median (right bottom) to separate two-way traffic at the railway level crossing. For each situation, speed measurements were conducted from the recorded video images. Fig. 2 gives the resulting cumulative speed distributions for about 100 free-driving passenger cars for each situation. A Kolmogorov-Smirnov test shows a significant speed reduction for both the solid white centre line and the physical median compared to the Before situation (Dmax=0.22, p ½ over the line
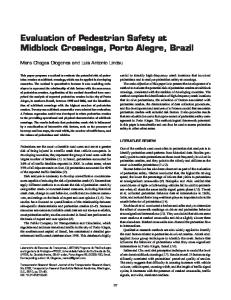
200 180 160 Number
140 120 100 80 60 40 20 0
Before
Centre line
Median
Fig. 4 Lane exceedances by motor vehicles in the Before, the solid white centre line, and physical median situation at location L10 (Alkmaar). The total number of la ne exceedances (on or over the line) in the Before, the solid white centre line and the physical median situation were 313, 395, and 69, respectively. The increase with the solid white centre line can be explained to a large extent by the wider line and the narrower lane width (the number of on -the-line riders is more than doubled) on the one hand and the larger number of car-bicycle encounters on the other hand. During one day of observation, the total number of encounters was counted as 717 and 561, respectively. In these encounters the motor vehicle is overtaking the bicyclist at the railway level crossing or in the direct proximity. During such a manoeuvre the centre line is easily touched or exceeded. The intended result that -6-
ICTCT Extra-Workshop
Others
motorists would better stay within their own lane, has not been reached by this simple measure. The physical median appears to be effective in this respect, the number of lane exceedances relative to the total number of car-bicycle encounters for the three situations is 43.7%, 70.4% and 10%, respectively. With the median, the motorists decide more frequently to stay behind the bicyclist while passing the railway level crossing and the number of conflicts seems to be less, but the numbers are too low to draw firm conclusions. In terms of conflicts as scored according to the criteria of the DOCTOR technique (see Kraay, van der Horst & Oppe, 1986), the total number was 6, 5 and 2 for the Before, solid white line and physical median situation, respectively. Continuation of separate bicycle paths at the railway level crossing At a railway level crossing in Echt, a separate one-sided two-way bicycle path along the roadway was interrupted at the railway crossing. At one side, bicyclists formally had to cross the road before the railway level crossing, pass the crossing, and cross the road again, see Fig. 5 (left) Before situation. The measure consisted of continuing the bicycle path with a separate railway level crossing, see Fig. 5 (right). Three-day video-observations were conducted in both the Before and After situation. For each situation speed measurements of about 100 free-driving passenger cars (one direction, from camera away, see Fig. 5) are given in Fig. 6. A KolmogorovSmirnov test does not result in a significant difference in speed (Dmax=8.0, p> 0.10). On average, the speed of free-driving motorists is 36.7 and 37.3 km/h in Before and After situation, respectively. These speeds are relatively low, but it has to be mentioned that in both situations speed humps are in place. Conflicts between cars and bicycles at the railway level crossing only occur in the Before situation, 2 slight (total severity score 1-2) and 3 serious conflicts (severity score 3-5), whereas in the After situation no conflicts of this type occur anymore. It may be expected that in the After situation no car-bicyclist conflict can happen anymore, but then still about 10% of the bicyclists make use of the carriageway instead of the separate bicycle path. The reduction from 5 to 0 conflicts is significant at the 5% el vel (van der Horst, Martens & Bakker, 2001). In the After situation, however, 2 (slight) conflicts occurred between bicyclists in opposite directions at the two-way bicycle path. Compared to car-bicyclist conflicts the severity is estimated much lower. The continuation of the bicycle path at the railway level crossing results in a safer and clearer situation without adverse speed effects.
-7-
ICTCT Extra-Workshop
7
Others
9 7
9
8
1
3 1
3 2
Fig. 5: Location L21 (Echt) with an interruption of the bicycle path in the Before situation (left figure) and the measure of continuation of the bicycle path at the railway level crossing (After situation, right figure).
-8-
ICTCT Extra-Workshop
Others
Cumulative distribution (%)
100 80 60 40 20
Before After
0 15
25
35
45
55
65
Speed (km/h)
Fig. 6 Cumulative speed distributions of 100 free -driving passenger cars at location L21 (Echt) in the Before situation and After (continuation of bicycle path over the railway level crossing). Increasing distance between railway level crossing and nearby road intersection At a location where the measure was implemented to bring the barrier and the signalling closer to the carriageway to make it more conspicuous for road traffic (location L22 in Kapelle), at the same time the distance between the railway level crossing and a nearby intersection of a bicycle path (parallel to the railway track) and the road was increased by about 12 m, see Fig. 7. A conflict analysis from the video recordings (three days of 12 hours observation, both Before and After) indicated that separating the road intersection more from the railway level crossing had a positive safety effect. The total number of conflicts was reduced from 12 to 4 (significant at the 5% level) and the number of serious conflicts (severity score 3-5) decreased from 8 to 2 (significant at the 10% level). So it helps to separate successive decision points in time and to make the situation more clear and less complex for the road user.
-9-
ICTCT Extra-Workshop
Others
Fig. 7: Location L22 (Kapelle) with the barrier and signalling closer to the roadway and the nearby road intersection about 12 m further away from the railway level crossing (Before situation: see left figure; After situation, see right figure).
CONCLUSIONS In general, by systematic analysis of road users’ behaviour from video a good indication about the functioning of the measures to improve safety at railway level crossings could be achieved. The extension of a barrier at pedestrian and/or bicycle paths improves the behaviour of pedestrians and bicyclists, but does not prevent the crossing of pedestrians who ignore the red light on purpose. Within built-up areas (speed-limit 50 km/h), a solid white centre line to separate two -way traffic at the railway level crossing reduces the speed with about 2.5 km/h but does not prevent slalom manoeuvres or centre-line crossings. A physical median reduces the speed with about 2.5 km/h, and reduces the number of line crossings as well as the severity of bicycle -car overtaking conflicts. Removing slow traffic from the carriageway decreases both the number and the severity of carbicyclist conflicts and seems to be safety-effective. It also appears to be effective to separate a nearby bicycle-path/road intersection further from a railway level crossing. Laying back the road intersection twelve metres further away helps already a lot.
- 10 -
ICTCT Extra-Workshop
Others
REFERENCES Griffioen, E. (1999). Verbeteren Veiligheid op Overwegen. Utrecht: Railned Spoorwegveiligheid. Horst, Richard van der & Bakker, Paul (2002). The effectiveness of safety measures at railway level crossings on road user behaviour. In: Proceedings of the 15th ICTCT Workshop in Brno, October 2002. Vienna: ICTCT Secretariat. Horst, A.R.A. van der, Martens, M.H. & Bakker, P.J. (2001). De effectiviteit van extra veiligheidsmaatregelen op overwegen: eindrapport gedragsobservaties. (Rapport TM-01-C034). Soesterberg: TNO Human Factors. Schenk, J. (2000). Evaluatie Verbeteren Veiligheid op Overwegen. Utrecht: Railned Spoorwegveiligheid.
- 11 -