IJRMET Vol. 3, Issue 2, May - Oct 2013
ISSN : 2249-5762 (Online) | ISSN : 2249-5770 (Print)
Rotor Dynamic Analysis of Steam Turbine By Finite Element Analysis 1 1,3
Trupti Wani, 2Nivedita B, 3Poornima Hombal
Dept. of ME, The Oxford College of Engineering Bangalore, Karnataka, India 2 Dept. of ME, EWIT College of Engineering Bangalore, Karnataka, India
Abstract The importance of Rotor dynamics is increasing with higher operational speeds in the high speed machines. The high speeds with damping complicate the nature of vibration. Damping plays important role at and near the resonant frequencies and has minimum role during other times. Damping changes the nature of rotation of the rotor system. Finite element analysis helps in eliminating these problems and gives a feasible solution with any complicated geometry having number of component. In the present work, a response analysis is carried out for a rotating steam turbine rotor assembly with base support structure with shock mounts. Modal analysis is carried out with rigid supports. The analysis results nearness of natural frequency with operational frequency. Elaborate analysis is carried out to find dampers effects along with support structure stiffness effects, it results with two natural frequencies close to the operational frequencies. Harmonic analysis is carried out to exactly estimate the nature of deflection and stresses in the structure. Further transient analysis is carried out to find response at the bearing locations. The response graphs for in-phase and out-of phase loads at bearings are represented. The graphical results shows the response values are lesser than the design limitation. So the structure along with its bearings is safe for the working conditions. Keywords Rotor, Stem Turbine, FEM, Vibration, Hyper Mesh I. Introduction Steam turbine plant is an integral part of thermal power station. Therefore development, construction and improvement of steam turbine are an important field of development of power industry. Growth in power and more complicated design of turbo machines are accompanied by higher requirements for their reliability. To increase operational life of turbo machines is also one of the main tasks of quality improvement. In this connection at present, when developing and mastering the steam turbines, modern computational and experimental methods are used to determine strength and reliability characteristics. The rotor dynamic analysis considers the interaction between the elastic and inertia properties of the rotor and the mechanical impedances from hydrodynamic bearing supports. The adequate operation of turbo-machine is defined by its ability to tolerate normal (and even abnormal) vibration levels without affecting significantly its overall performances especially on critical speeds and an unbalance response [3]. Bearing stiffness & damping properties have significant influence on the performance of the rotor. Hence logical way to design hydrodynamic bearings for a given rotor is to choose optimum bearing properties, which minimize the maximum unbalance response in an operational speed range. Most machines in the industry are custom designed for a particular application. According to the customer requirements, for accurate critical speeds prediction capabilities are thus indicated by the acceptable margin between the critical speed and the operating speed depends on the desired margin and on the error w w w. i j r m e t. c o m
in the calculations. These rotor dynamic problems of finding critical speeds and unbalance response of the rotor can be solved using Finite Element Methods and Transfer Matrix Methods. Here the Finite Element Method is used. FEA Software calculates the undamped critical speeds and mode shape by using the modal analysis and damped critical speeds, mode shapes and unbalance response by using the harmonic analysis [4]. II. Basic principles of Rotor dynamics The equation of motion, in generalized matrix form, for an axially symmetric rotor rotating at a constant spin speed Ω is M Where: M is the symmetric Mass matrix C is the symmetric damping matrix G is the skew-symmetric gyroscopic matrix K is the symmetric bearing or seal stiffness matrix. N is the gyroscopic matrix of deflection for inclusion of e.g., centrifugal elements. In which q is the generalized coordinates of the rotor in inertial coordinates and f is a forcing function, usually including the unbalance. The gyroscopic matrix G is proportional to spin speed Ω. The general solution to the above equation involves complex eigenvectors which are spin speed dependent. Engineering specialists in this field rely on the Campbell Diagram to explore these solutions [2]. An interesting feature of the rotor dynamic system of equations is the off-diagonal terms of stiffness, damping, and mass. These terms are called cross-coupled stiffness, cross-coupled damping, and cross-coupled mass. When there is a positive cross-coupled stiffness, a deflection will cause a reaction force opposite the direction of deflection to react the load, and also a reaction force in the direction of positive whirl. If this force is large enough compared with the available direct damping and stiffness, the rotor will be unstable [1]. When a rotor is unstable it will typically require immediate shutdown of the machine to avoid catastrophic failure. III. Geometrical Modeling Of Rotor System
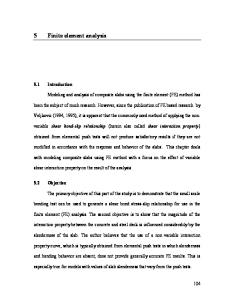
Fig. 1: 3D Representation of Rotor System The fig. 1 shows three dimensional modeling of the shaft system. The geometry is built in axi-symmetric approach and revolved to form three dimensional shapes.
International Journal of Research in Mechanical Engineering & Technology 291
ISSN : 2249-5762 (Online) | ISSN : 2249-5770 (Print)
IJRMET Vol. 3, Issue 2, May - Oct 2013
Fig. 2: Meshed Model of Rotor System Due to simple Axi-Symmetric nature of the rotor system, the rotor is represented by one dimensional element. Ansys pipe16, element which is suitable for shaft modeling is used for representing the stepped nature of the rotor system. Further mass elements are added at the appropriate location specified in the table. Table 1: Locations of Mass Values Length of Shaft 1110 1290 1410 1529 1719 1834 2316 2431 2754 3077 3401 4400
Mass Value (kg) 6.85 6.26 6.53 8.11 9.46 13.58 11.25 15.98 28.523 78.309 139.964 62
Fig. 3: Ansys Meshed Model The fig. 3 shows Ansys model after importing into Ansys after assigning relevant material and element properties. Pipe16 element is used for rotor representation, Combin214 for bearing and shock mounts, combin14 for stiffness of frame structure. Coupling constraints are used to represent housing connection to the base plate [7]. IV. Material Data and Design Input Rotor Material = 21 CrMoNiV5-9 Yield strength = 600 - 700 N/mm2 Tensile strength = 850 N/mm2 0.2% proof stress = 530 N/mm2 Base Plate Material = EN 16 Yield stress = 550 N/mm2 Shock Mount Properties Kxx=15.9e11, Kyy=0.6e8, Damping=20% V. Results & Discussions The analysis is carried out in different stages to check the safety of the structure under given loads. Initially axi-symmetric analysis is carried out to check the stress condition under operational loads. A. Axi symmetric Analysis
Fig. 4: Hoop Stress Plot
Fig 2: Rotor Housing and Its Supporting Structure Overall Representation The fig. 2 shows overall system. The rotor system is represented by one dimensional elements and bearings and enclosure is represented by spring mass elements and base plate is represented by two dimensional elements. Shock mounts are represented by combin214 element and normal members are represented by combin14 elements. Combin214 is the best element suitable to accommodate 8 coefficients defining stiffness and damper parameters. Total mass of base Plate =14000kgs with 2 shock mounts at the X-Direction.
292
The fig. 4 shows hoop stress developed in the structure for 6500 rpm. The maximum stress of 159Mpa can be observed in the problem. Maximum stress region is represented by colour code red. Ansys-style axi symmetric expansion option is used to view two dimensional axi-symmetric problems in three dimensional spaces. Theoretically the stress can be calculated as (σθ) max = {(3+ γ)/8} ρ 2 b2 Here Poison‟s ratio γ=0.3 Density ρ=7800kg/m3 ω=2πN/60 ω =2*3.14*6500/60=680.67rad/sec Due to stepped nature, Mean outer diameter is considered for stress calculation. The diameters in the stress concentration zone blocked
International Journal of Research in Mechanical Engineering & Technology
w w w. i j r m e t. c o m
IJRMET Vol. 3, Issue 2, May - Oct 2013
ISSN : 2249-5762 (Online) | ISSN : 2249-5770 (Print)
in the figure are considered for theoretical stress calculations. Mean diameter in the region dm = (765.69+562.845)/2=664. 2675mm=0.6642675 m ‟b‟ radius=0.332 m (σθ) Max = {(3+ 0.3)/8}7800*680.672 *0.3322 =164Mpa So the theoretically calculated stress is very close to Finite element solution of 159Mpa.
Table 2: Modal Analysis Results (Flexible Supports) Set No 1 2 3 4 5
Mode Frequency (Hz) 39.569 100.15 101.86 171.44 221.21
The flexible modal analysis further shows third frequency (101.86Hz corresponding to 6111.6 rpm) is close to the operational speed of the problem. Due to flexible supports the frequency value reduces compared to the rigid supports. Reduction is natural frequencies are not desirable, but every practical structure has a finite stiffness. Theoretically the approximate natural frequency can be calculated assuming parallel spring arrangement between the springs supports.
Fig. 5: Radial Stress Plot The fig. 5 shows radial stress in the structure. Maximum radial stress is around 182 Mpa shown by red colour. The stresses are more at the fillet regions and higher diameter regions.
C. Overall System Modal Analysis The analysis is carried out with complete structure. The shock mounts are provided to find the frequency. The structure is constrained left side and the shock mounts are constrained in all directions.
Fig. 6: Von Mises Stress Plot The fig. 6 shows Vonmises stress in the structure. Maximum Vonmises stress is around 187 Mpa at the centre of higher diameter rotor region represented by red colour. The colour shown at the bottom status bar represents the variation of stress in the problem. B. Mode Shapes
Fig. 8: Mode Shape Corresponding Fundamental Frequency (22.867) The fig. 8 shows mode shape corresponding to the first natural frequency. Maximum deformation is again taking place at the centre of the rotor system. With combined stiffness of the structure the natural frequency values are dropping. D. Harmonic Response Analysis The unbalanced force is applied at the centre of the rotor system and checked for the complete frequency range to identify the major regions of stress and displacement generations. Since the unbalanced load is in cyclic nature, harmonic response analysis is carried out with 20% imbalance force. The analysis is carried out between 0 to 150Hz to identify the region of peak values of displacements and stresses.
Fig 7: Mode Frequency 1 The fig. 7 shows mode shape of the rotor system with rigid supports. The maximum deformation is taking place at the centre of the rotor system. Further flexible mode analysis is carried out with bearings represented as springs.
w w w. i j r m e t. c o m
International Journal of Research in Mechanical Engineering & Technology 293
ISSN : 2249-5762 (Online) | ISSN : 2249-5770 (Print)
IJRMET Vol. 3, Issue 2, May - Oct 2013
is less than the allowable stress of the material. Mainly the stress is taking place in the base plate.
Fig. 12: Displacement at 24 Hz Fig. 9: Frequency or Harmonic Response of Rotor System The fig. 9 shows harmonic response of the problem. Maximum response is taking place near the frequency of 24Hz. On compression side, minimum values are taking place near 18 Hz. All the maximum values are taking place below the operational frequency of 108.33Hz corresponding to 6500 rpm. So in the normal running conditions, the stresses will be with in the limits. Almost very minimum magnitudes can be observed above 50Hz. So in the operational range, almost minimum displacements can be observed by which stress development will be very less.
The fig. 12 shows maximum displacement in the system at 24Hz operational speed. Maximum displacement is around 7.7mm in the rotor system. The maximum displacement region is represented by red colour region. Left side rotor is having maximum displacement compared to the displacements observed at the frequency value 18 Hz for which uniform distribution can be observed at the centre.
Fig. 13: Vonmises Stress at 24 Hz Operation
Fig. 10: Displacement at 18 Hz The fig. 10 shows maximum displacement of 1.91mm at 18 Hz operational speeds. The maximum displacement is at the centre of the node shown by red colour. The blue colour region shows minimum displacement region.
The stress value is around 425Mpa at 24 Operational frequencies as shown in 5.8. But still the stress is less than yield stress of the material. So the structure is safe for the given loads. But the factor of safety is very less at this frequency. Since the system is not run at this frequency, the system is safe for the given loads. E. Transient Response Analysis for the Rotor System Transient response analysis is carried out to find response at in-phase and out of phase loads. The analysis is carried out to check maximum displacements at bearing locations. The analysis is carried out at different speeds. The values are tabulated and graphically represented. The response values are represented at both driving and non driving ends of the shaft.
Fig. 11: Maximum Vonmises Stress Corresponding to Harmonic Frequency 18 Hz The fig. 11 shows maximum Vonmises stress of 240 Mpa in the system, if member subjected to 18Hz harmonic load. This stress
294
International Journal of Research in Mechanical Engineering & Technology
w w w. i j r m e t. c o m
ISSN : 2249-5762 (Online) | ISSN : 2249-5770 (Print)
IJRMET Vol. 3, Issue 2, May - Oct 2013
Out of Phase- Response Values - Non Driving End
Fig. 17: Response – Y- Direction-Driving End Fig. 14: Response Plot – Y Direction
The figure 14 shows maximum response is 17.8 microns. This deformation is less than the allowable deflection at bearing locations‟ as specified in the design constraints. Higher displacements at the bearing locations causes the bearings to cease and non-functional. The figure 15 shows maximum response is 12.85 microns. The deformation is less than then y deformation and is within the design requirements.
Fig. 15: Response Plot – Z Direction
Fig. 18: Response – Z- Direction-Driving End
Fig. 16: Response Plot – Phase Plot
Fig. 19: Response – Phase plot -Driving End w w w. i j r m e t. c o m
International Journal of Research in Mechanical Engineering & Technology 295
ISSN : 2249-5762 (Online) | ISSN : 2249-5770 (Print)
IJRMET Vol. 3, Issue 2, May - Oct 2013
In-Phase –Response Values -Non Driving End
Fig. 20: Y-Response – In phase
Fig. 21: Z-Response – In-phase In-phase and out of phase results shows maximum response values less than the design requirement of 40 microns at the bearing location indicating safety of the bearings under dynamic loads. VI. Conclusion The Rotor made of multiple steps is modelled and analysed for different boundary conditions. The analysis summary is as follows. Initial axi symmetric analysis shows regions of stress concentrations and magnitude of values. These values are validated through theoretical calculations. The developed stresses corresponding to operating speed of 6500rpm are within the allowable limits of the material. Initial modal analysis with rigid supports shows nearness for natural frequency to operating frequency indicating the requirement of through analysis in the problem. Modal analysis carried out with bearing supports under flexible conditions shows drop of natural frequency and nearness of resonant frequencies to operating frequencies. Further complete structural modal analysis results shows further drop in natural frequency values along with two natural frequencies close to operational frequencies. Harmonic response analysis with central imbalance shows maximum response values at 18Hz and 24 Hz. The corresponding stress and deformation values are represented along with
296
operational conditional results. The results show stresses within the yield point of the material. Further in-phase and out of phase results shows maximum response values less than the design requirement of 40 microns at the bearing location indicating safety of the bearings under dynamic loads. All the results are represented with corresponding stresses and deformations. The system is safe for working with the given bearing values and rotor loads. References [1] Chih-Yung Chang, Min-Yung Chang, Jin H. Huang, “Vibration analysis of rotating composite shafts containing randomly oriented reinforcements”, Technical Paper, Feng Chia University, Taiwan ROC, 2003. [2] XU Yang, ZHAO Lei, YU Suyuan,“ Dynamics Analysis of very flexible Rotor,"Technical Paper, Institute of Nuclear Energy Technology", Tsinghua University, Beijing 100084, P. R. China, 2004. [3] Carlos Alberto Bavastri, Euda Mara da Silva Ferreira , José João de Espíndola, Eduardo Márcio Oliveira Lopes, “Modeling of Dynamic Rotors with Flexible Bearings Using Viscoelastic Materials”, Technical Paper , Proceedings of the XI DINAME, Ouro Preto - MG – Brazil, 28th February-4th March, 2005. [4] L.P. Nasimento, L.Caldiron,“Rotor Support Stiffness Estimation by sensitivity Analysis”, Technical Paper, Department of Mechanical Engineering, Sao Paulo State University, Brazil, 2006. [5] Y.S. Chen, Y.D. Cheng, J.J. Liao, C.C. Chiou, "Development of a finite element solution module for the analysis of the dynamic behavior and balancing effects of an induction motor system”, Technical Paper, Department of Mechanical Engineering, Yuan-Ze University, Chungli 320, Taiwan, ROC, 5 January 2008. [6] G. Peláez , F. Oliveira , M. P. Donsión,“Rotor vibration reduction using rotor balancing and command shaping”, Technical Paper, Department of Mechanical Engineering E.T.S.I.I., Vigo University Campus of Lagoas – Marcosende, 36310 Vigo (Spain), 2009 [7] Kris Matthys, Marco Perucchi, Koenraad De Bauw, “Rotor Dynamic Modeling as a powerful support tool for vibration Analysis on large Turbo machinery”. [8] Abdul Ghaffar Abdul Rahman, Ong Zhi Chao , Zubaidah Ismail,“Effectiveness of Impact-Synchronous Time Averaging in determination of dynamic characteristics of a rotor dynamic system”, Technical Paper, Mechanical Engineering Department, Faculty of Engineering, University of Malaya, 50603 Kuala Lumpur, Malaysia, 1 September 2010. [9] R. Stocki, T.Szolc, P.Tauzowski, J.Knabel,“Robust design optimization of the vibrating rotor-shaft system subjected to selected dynamic constraints”, Technical Paper, Institute of Fundamental Technological Research, Polish Academy of Sciencesul. Pawin ´skiego 5B, 02-106Warsaw, Poland, 27 July 2011. [10] M. Chouksey, J.K. Dutt, S.V. Modak,“Modal analysis of rotor-shaft system under the influence of rotor-shaft material damping and fluid film forces”, Technical Paper, Department of Mechanical Engineering, IIT, Delhi, Hauz-Khas, New Delhi, 110016, India, 8 September 2011.
International Journal of Research in Mechanical Engineering & Technology
w w w. i j r m e t. c o m
IJRMET Vol. 3, Issue 2, May - Oct 2013
ISSN : 2249-5762 (Online) | ISSN : 2249-5770 (Print)
Mrs. Trupti P wani received her Bachelor of Engineering degree in Mechanical Engineering from The SES Institute of Engineering, affiliated to North Maharashtra University, Jalgaon,, India, in 2005. Master of Engineering degree in Machine Design from Visvesvaraya Technological University, Bangalore, India in 2011. She was a lecturer with Department of Mechanical Engineering, GCE College of Engineering Dhule in 2005 to 2008. She had one year experience in research in ABB Bangalore. Her research interests include stress analysis, fracture analysis, composite materials, and vibration. At present she is working as an Asst. Professor with Department of Mechanical Engineering, The Oxford College of Engineering, Bangalore, since 2011. Ms. Poornima Hombal received her Bachelor of Engineering degree in Industrial Production Engineering from Visvesvaraya Technological University, Bangalore, India in 2010. Master of Engineering degree in Computer Integrated Manufacturing from Visvesvaraya Technological University, Bangalore, India in 2012. Her research interests include stress analysis, fracture analysis, composite materials, and vibration. At present she is working as an Asst. Professor with Department of Mechanical Engineering, The Oxford College of Engineering, Bangalore, since 2012.
w w w. i j r m e t. c o m
International Journal of Research in Mechanical Engineering & Technology 297