Resources and intimate partner violence in Sub-Saharan Africa∗ Sara Cools†
Andreas Kotsadam‡
April 24, 2015
Abstract Combining DHS data for 580,000 women from 30 different countries in Sub-Saharan Africa, we analyze how both the incidence and the acceptance of intimate partner violence vary across time and space in a region with record high levels of violence against women. We review the existing literature on the impact of resources on intimate partner violence, extracting testable hypotheses at the micro and macro level, and on the interaction across levels. We also propose a new theory, by which acceptance of wifebeating at the contextual level matters for how employment affects abuse risk. Bringing the hypotheses to the data, we find that the level of analysis is crucial for unmasking the relationship between resources and actual abuse, and that this relationship differs from the relationship between resources and acceptance of wife-beating. Though resources are associated with lower acceptance, we find no evidence for the protective role of resources at the individual level. We find that resource inequality, both within the household and at the aggregate level, is positively linked to abuse. Finally, we find that female employment is associated with higher risk in settings where abuse is considered legitimate to a greater extent.
∗
We are grateful to Rannveig Kaldager Hart, Lori Heise, G¨oran Holmqvist, Niklas Jakobsson, Annika Lindskog, Kalle Moene and several seminar participants for helpful comments and suggestions. This paper is part of the research activities at the center of Equality, Social Organization, and Performance (ESOP) at the Department of Economics at the University of Oslo. ESOP is supported by the Research Council of Norway. † BI Norwegian business school,
[email protected] ‡ University of Oslo,
[email protected]
1
Introduction
Violence against women is considered to be the most widespread form of human rights violation worldwide, and intimate partner violence is by far its most important component (Fried, 2003; Garc´ıa-Moreno et al., 2005; Heise, 2011). Intimate partner violence is associated with a wide array of negative outcomes for the women who are abused, including pregnancy loss and sexually transmitted infections (Krishnan, 2005). In addition, it bears considerable negative externalities, affecting more individuals than the ones who are abused, through fear of abuse and psychological stress from witnessing violence (Jewkes, 2002; True, 2012). Intimate partner violence is prevalent in all societies, but the level and the degree to which it is considered acceptable both vary greatly. The countries of SubSaharan Africa (SSA) stand out with the highest levels of violence against women in the world (Garc´ıa-Moreno et al., 2005; Devries et al., 2013). Also, 14 out of the 15 countries with the highest share of women who deem wife-beating justifiable are found in Sub-Saharan Africa (World Bank, 2011). There is nevertheless a lot of variation across the region and over time, suggesting that intimate partner violence also depends on factors at the contextual level (Jewkes, 2002; Johnson et al., 2008; True, 2012). In the present paper, we explore this variation in order to shed light on a wide range of hypotheses regarding the relationship between resources and abuse.1 We first give a broad description of the spatial and temporal variation in the prevalence of abuse in SSA, and in the degree to which it is considered justifiable. We thereby complement Pierotti (2013), who documents a recent declining trend in women’s attitudes toward intimate partner violence, by extending the analysis to women’s actual experience with abuse. We then investigate specific hypotheses on the relationship between abuse and resources at different levels of analysis. Resources are measured in terms of wealth, education and employment. We use exceptionally ample micro data from the Demographic and Health Surveys (DHS), containing information on attitudes regarding wife-beating for 586,255 women and the experience of abuse for 156,929 women, located in 30 countries and interviewed over the years 2003-2013. The idea that resources affect the prevalence of intimate partner violence is widespread, and there are three general versions of this theory (see Atkinson et al. (2005) for a review). The standard resource theory (Goode, 1971) posits that women with few resources are more at risk of abuse, and that men with fewer resources are more likely to be abusive. More recent scholarship tends to focus on relative resources. Less relative female resources could lead to more abuse due 1 We use the terms ”intimate partner violence” (or simply ”violence”), ”wife-beating” and ”abuse” interchangeably, and unless otherwise stated we will mean the violence of men against their female partners.
1
to marital dependency (e.g. Vyas and Watts (2009)). On the other hand, more relative female resources could increase violence due to the stress induced by status inconsistencies (e.g. Hornung et al. (1981)). A refinement of the relative resource theory is the gendered resource theory, propositioning that the effect of relative resources on abuse is conditional on husbands’ gender ideologies, where the degree to which men hold breadwinner ideals (Atkinson et al., 2005) and/or accept wife beating (Krishnan et al., 2010) is crucial. These different theories operate at different analytical levels. The simplest form of resource theory is concerned only with resources at the micro level. Relative resource theory, on the other hand, is concerned with resources at the couple level, as is the gendered relative resource theory. Very few theories explicitly investigate the macro level when analyzing intimate partner violence, even though this level is thought to be important and may interact with the other levels (Heise, 1998). We propose a contextual gendered employment theory, whereby female employment leads to a relatively higher risk of abuse in settings where wife-beating is considered acceptable. We follow the “ecological approach” and allow the different types of resources to operate at various levels of social organization simultaneously (Heise, 1998; Uthman et al., 2009b, 2011). We explicitly model the correlation of intimate partner violence with resources at the individual, the couple, and the community level, and we allow for interactions across these levels. With respect to the standard resource theory, our findings show that household wealth, though strongly negatively linked to the acceptance of wife-beating, is only weakly (if at all) negatively correlated with the risk of actual abuse in the household. Furthermore, richer areas are not less violent-prone than poorer areas. Societies with a high degree of economic inequality, however, have higher levels of abuse. We find little support for the simplest economic bargaining model in our data, as women’s level of education – allegedly a source of bargaining power – is positively correlated with their risk of abuse. Moreover, female employment is consistently associated with higher risk of abuse. With respect to relative resources, we find that intra-household inequality in education is associated with more violence. Female resources in terms of improved outside options do not seem to imply lower levels of abuse either, as areas with higher levels of female employment and education are relatively more violent prone. Our findings lend little support to the gendered resource theory, as the husband’s attitudes towards wife-beating is not an important mediator for the relationship between women’s relative resource levels and their experience with abuse. Consistent with the contextual gendered employment theory, we find that being employed is correlated with an even higher risk of abuse in areas with a high level of acceptance of wife-beating. Our findings underscore the need for high quality data and careful consider-
2
ation of analytical level when exploring the relationship between resources and intimate partner violence. On the one hand, we find that information on attitudes towards wife-beating cannot replace data on actual abuse in analyses of how resources relate to the incidence of abuse. Although being accepting of wife-beating is positively correlated with the probability of actual abuse on part of both victim and perpetrator, it is monotonously positively correlated with wealth and education, thus masking the more complicated relationship between resources and abuse. Similarly, employment is only weakly related to acceptance but strongly, and positively, related to abuse and the interaction between macro level acceptance and micro level employment is highly relevant for predicting levels of abuse. On the other hand, aggregates such as household wealth, or the total level of resources in a society, are insufficient predictors of abuse: It is important to consider also the distribution of resources; between household members in particular, but also at the macro level and in interactions across different levels.
2
Conceptual framework and hypotheses
The relationship between resources and intimate partner violence is given considerable attention in social science research. Below, we give a comprehensive review of this literature, with particular focus on the testable hypotheses regarding how resources influence risk of abuse. The resources given most attention in the literature are wealth (or income), employment, and education. We organize the review by level of analysis. For each level, we specify the hypotheses to be investigated empirically in Section 5.
Micro level resources: The role of absolute and relative resources in the household At the individual level, resources are often argued to be empowering and protective against intimate partner violence (Jewkes, 2002). The relationship between resources and violence need not be linear, however, and some even argue for a backlash, whereby increased resources lead to more abuse for women (True, 2012). Low levels of wealth is associated with stress, which is thought to influence the degree of abuse(Jewkes, 2002). From another perspective, resource theory regards the family as a power system and suggests that men with few other resources may use violence to maintain dominance within the family (Goode, 1971; Vyas and Watts, 2009)). In any case, the prediction is a negative effect of wealth on abuse. Employment and education generally lead to higher income. If employment is related to abuse via the inhibiting effect of wealth, households with only unemployed individuals should experience more abuse. Similarly, households with 3
the lowest levels of education should be the most violent, and individual education should be negatively correlated with abuse. Yet, employment and education are considered important beyond their effect on total household income, as their relative importance within the household may affect spouses’ autonomy and bargaining power (Schlozman et al., 1999). Bargaining theories of violence focus on women’s outside option, which is usually considered to be the utility level in case of divorce (Manser and Brown, 1980; McElroy and Horney, 1981; Lundberg and Pollak, 1996; Farmer and Tiefenthaler, 1997; Pollak, 2005; Eswaran and Malhotra, 2011). Improved outside options through individual education, employment possibilities or wealth should then reduce intimate partner violence – all else equal (Farmer and Tiefenthaler, 1997). High educational attainment is negatively associated with being both a victim and a perpetrator of abuse across a wide range of different studies (see Jewkes (2002) for an overview). Education is also assumed to affect behavior via identity and learning about the normative foundations of society, and it may expand horizons as well as increase exposure to global discourses rejecting partner violence (Pierotti, 2013). Friedman et al. (2011) exploit a randomized scholarship program that raised girls’ secondary schooling in Kenya and find a reduction in acceptance of wife-beating. Mocan and Cannonier (2012) use a policy reform in Sierra Leone in 2001 and find that increased primary schooling also reduces women’s acceptance of wife-beating. On the other hand, according to backlash theory, if intimate partner violence could affect the outcome of the bargaining process – for instance as an alternative source of bargaining power to men – an increase in women’s resources may yield a higher risk of abuse; a backlash in terms of violence. Men may thus use violence to counteract the increased power gained by women and in order to reinstate their dominance (e.g., Heise and Garc´ıa-Moreno (2002); Eswaran and Malhotra (2011) and True (2012)). The World Health Organization argues that female employment should be strongly supported as a means to reduce intimate partner violence (Garc´ıa-Moreno et al., 2005). Quite contrary to this, Hjort and Villanger (2011) find that abuse increases as women become employed in flower farms, in a randomized field experiment in Ethiopia. Using data from East Africa, Gonz´alez-Brenes (2004) finds that women working outside the home have higher acceptance of wife-beating relative to women who do not work at all. She finds no significant correlation between employment and actual abuse in her sample, and while women in the highest income quintile are less likely to accept violence they are not less likely to be the victims of it. Lastly, as suggested by the contradictory predictions above: The relationship between resources and violence is not necessarily monotonous. Studies of both the
4
US during the 1970s (Straus et al., 1980) and South Africa in 1998 (South Africa Department of Health, 2002), document a hump-shaped (inverted U) association between female education and exposure to intimate partner violence, with those having the least and the most education suffering relatively less from violence, while those in the middle are relatively more exposed. Reviewing the literature, Vyas and Watts (2009) also find that the negative correlation between education and violence only exists for women with secondary schooling or more, compared to women with no education. Jewkes (2002) argues that a likely reason for the hump-shape is that having education enables women to challenge norms, but this carries a risk unless the woman is sufficiently empowered. Similar patterns have been observed also with respect to income (Jewkes, 2002; True, 2012). More generally, resources can be predicted to increase the risk of violence for women if their initial bargaining power is low (Tauchen et al., 1991; Eswaran and Malhotra, 2011; Heath, 2012). In these bargaining models, violence is considered to be instrumental on the part of men, and while resources increase women’s bargaining power, they do not do so sufficiently for her to leave the partnership if beaten, and the man will counteract the increase in female power by violent means. Hence, there may exist a threshold level beyond which education reduces violence, whereas below this level a little more education is actually harmful. Different types of resources may also be expected to interact with each other. Hidrobo and Fernald (2013) focus on women’s education as a mediator for the effects of increased female income on intimate partner violence. They find that female income decreases psychological violence from male partners in Ecuador, but only for women with more than primary education. Heath (2012) also shows that female education affects the relationship between employment and violence against women in Bangladesh, and finds a negative correlation between work and violence only for women with low levels of education. The essence of the existing theories regarding the role of the absolute level of resources can be condensed in the following three hypotheses: Hypothesis 1a): Women’s access to resources such as wealth, employment and education, leads to lower risk of abuse (the standard resource view). Hypothesis 1b): Women’s access to resources, and to employment in particular, leads to higher risk of abuse (as in theories of a violence backlash). Hypothesis 1c): The relationship between women’s access to resources and intimate partner violence is non-monotonous; resources are protective only beyond a certain threshold, and may be harmful at levels below this (consistent with findings of an inverted U). Relative resource theories claim that it is not the woman’s resource level in itself, but her position within the household, that matters (Vyas and Watts, 2009).
5
As in the literature on the role of individual resources, the theories about the role of relative resources yield opposing predictions. The theory of marital dependency states that being economically dependent on a male partner increases women’s risk of abuse, since it makes them less likely or able to exit the relationship (Vyas and Watts, 2009). This is the case also in Tauchen et al.’s (1991) and Aizer’s (2010) modified bargaining models, where violence is considered to be expressive as well, directly entering the husband’s utility function. Expressive violence increases the husband’s utility at the expense of his wife’s in these models, and under the assumption that she can be compensated with income transfers, spouses’ relative wealth together with outside options determine the level of violence. Aizer (2010) finds that reduced gender wage gaps – seen as a relative improvement of women’s outside options – lead to less violence against women in the US. In theories viewing marriages as exchange relationships, cultural expectations define and put value on different divisions of labor. Masculinity is constructed in relation to femininity, and wives’ employment should be studied in relation their husbands’ (Macmillan and Gartner, 1999). According to the relative resource theory, where violence serves as a compensation for men’s relative shortage of resources (Pence and Paymar, 1993; McCloskey, 1996; Macmillan and Gartner, 1999; Atkinson et al., 2005), or in status inconsistency theories, where atypical roles threaten male identity (Hornung et al., 1981), women having more resources than men could lead to increased violence. Hornung et al. (1981) find that women with higher occupational status than their partner are more at risk of abuse in the US. They favor the explanation that expectations about relative status are normative, and deviations lead to psychological stress – which again begets violence. Similar arguments have been made regarding education, where a common finding is that women with more education than their partners experience more violence (Hornung et al., 1981; Flake, 2005; Ackerson et al., 2008). Lastly, gendered resource theory (Atkinson et al., 2005) proposes that the effect of relative resources on intimate partner violence is moderated by husbands’ gender ideology. Atkinson et al. (2005) criticize the other resource theories for not taking culture into account and for assuming all men to be what they term “traditional”. In their data, being traditional is measured by men’s normative beliefs about household division of labor. They find that women’s share in total household income is positively related to risk of abuse only for traditional husbands. If their hypothesis is robust, it should also hold for alternative measures of gender ideology. We propose to test it by using husbands’ stated acceptance of wife-beating. The existing theories regarding the role of the relative level of resources can be condensed in the following three hypotheses: Hypothesis 2a): For a given level of male resources, women’s access to re-
6
sources leads to lower risk of abuse, and, by the same token, for a given level of female resources, men’s increased acces to resources leads to higher risk of abuse (due to, for instance, marital dependency in a simple bargaining framework). Hypothesis 2b): For a given level of male resources, women’s access to resources leads to higher risk of abuse, and it is especially harmful once her resource level exceeds his (in accord with, for instance, status inconsitency theory). Hypothesis 2c): The relationship between women’s relative control of resources and intimate partner violence is mediated by husbands’ attitudes towards wife-beating (as would be consistent with the gendered resource theory).
Macro level resources: The role of resources at the community level Resources at the macro level may have an influence on intimate partner violence, by shaping the opportunities and constraints provided by society. The effect of macro level resources could work both directly and by way of mediating the effects of individual and relative resources. Empirical studies document a strong negative correlation between economic development and intimate partner violence at the country level (Doepke and Tertilt, 2009; Duflo, 2012). Benson et al. (2003) argue that there is more violence in poor communities for cultural and institutional reasons. They build on social disorganization theory, which predicts poor areas to have weaker social bonds between individuals, leading to less social control and more social isolation. Hence, even if the acceptance of violence were not higher in such areas, people are less likely to intervene and the levels of abuse are argued to be higher. Abusive men thereby gain a type of impunity. This situation would further be aggravated if acceptance rates are also higher in poorer areas. Indeed, Benson et al. (2003) argue that poor areas also have higher acceptance rates. Uthman et al. (2009b) find that individuals living in poorer areas have higher acceptance of wife-beating in a study of 17 African countries between 2003 and 2007. Poverty at the macro level also reduces the quality of social institutions such as the local police, which may further aggravate problems of violence (Uthman et al., 2009b). In addition to the correlation found between low levels of income and violence against women, also changes in income seem causally related to violence. In particular, Miguel (2005) finds that murder rates of old women in Tanzania increase when rainfallinduced negative income shocks hit, and Sekhri and Storeygard (2014) document an increase in intimate partner violence in India after droughts. Female education at the contextual level may shape local discourses and affect the perception of women in society. It is correlated with political knowledge and participation in Africa (Bratton et al., 2005; Mattes and Bratton, 2007; Isaksson
7
et al., 2013). High female educational attainment could also make local policies more gender equal. Female labor force participation is argued to make women informed about their interests and more capable of acting on them (Iversen and Rosenbluth, 2008). Women who do not work have their traditional gender roles reinforced, and domestic isolation hinders change, since women are cut off from political discussion and networks (Schlozman et al., 1999). These effects may spill over on other women, irrespective of whether they work or not. In a bargaining framework it is also important to consider potential, rather than actual, income as determinant of outside options and threat points (Fuwa, 2004; Aizer, 2010). As improved employment opportunities increase the bargaining power of all women, also that of those who are currently not working, women’s employment rates could also in this way impact abuse levels. Though it has not been tested empirically, Jewkes (2002) argues that intimate partner violence is probably more prevalent in more unequal societies, because this holds for the level of violence in general. Stress is often considered to be the mechanism through which more unequal societies result in more violence (see Wilkinson (2004) for an overview). Inequality has also been linked to less social control and weaker social bonds in social disorganization theory (Benson et al. (2003)). Pearlin (1975) argues for a link between inequality in the community and violence against women since the conditions for status striving and the view on household status inequality are rooted in the organization of social relations in the surrounding community. In this view, the organization of daily marriage interactions are affected by the societal status order and there may thus be a direct link between community inequality and violence against women. We propose the following three testable hypotheses regarding the role of macro level resources: Hypothesis 3a): Holding individuals’ absolute and relative resource levels constant, a high level of resources at the contextual level – especially of women’s resources, such as high female education and employment rates – gives lower levels of intimate partner violence (due to improvements in either institutional quality, perceptions of women, or outside options). Hypothesis 3b): Resources at the contextual level actually give higher levels of abuse (no existing theory actually yields this prediction, yet it seems like a natural extension of the backlash theories at the micro level). Hypothesis 3c): Economic inequality at the contextual level increases intimate partner violence (as suggested by social disorganization theory).
8
Cross level interactions Naturally, factors at the macro level may also influence the effect of micro level resources (Blumberg, 1984; Giddens, 1984; Granovetter, 1985). In the existing literature, interactions across analytic levels have been most saliently hypothesized with respect to employment. In reviewing the literature on the relationship between female income and abuse, Vyas and Watts (2009) show that the results are heterogenous across countries and point to differences in contextual factors as a likely reason, in particular whether it is common for women to be employed or not (see also Angelucci (2008) and Bobonis et al. (2013)). Theoretically, this is plausible in a model such as the one in Hjort and Villanger (2011), where the husband gains more strongly from using violence if he becomes disempowered by his partner’s employment. When women become breadwinners in a cultural context that favors male breadwinning, the gains to violence thus increase. This is also consistent with a theory of instrumental violence, as an unemployed husband in a context of male breadwinning may wish to reinstate dominance by resorting to violence when his wife is employed (WorldBank, 2011; True, 2012). We believe that differences in the effect of micro level female employment across contexts can be partly explained when made contingent also on attitudes at the macro level. Koenig et al. (2003) find that the effect of participation in a credit group in Bangladesh increased abuse in conservative villages while it decreased violence in relatively more gender equal villages. Similarly, Kabeer (1997) argues for a need to contextualize the effects of resources as their meaning and effects are shaped by local circumstances and values. As a high tolerance for wife-beating at the community level gives a certain impunity for the violent husband, it facilitates a violent response to changes in the household power balance. More than the other resource indicators, a woman’s employment directly challenges the breadwinner status of her husband, it changes her behavior and daily activities, provides her with access to social networks and outside options, and is observable from outside the household. We therefore propose to extend the gendered resource theory to taking into account attitudes at the macro level, in a contextual gendered employment theory, where female employment is particularly risky in settings where prevailing norms and values are such that wife beating is considered acceptable. The theory can explain the seeming contradiction in the findings of Aizer (2010) and Hjort and Villanger (2011), as in the US context (supposedly less tolerant of violence against women) the effect of female employment may then be a reduction in violence, while in Ethiopia, the effect of female employment may be more violence against women (since violence is considered acceptable to a greater extent).2 2
Individual and community acceptance of wife-beating is highly correlated with abuse in other
9
We propose the following three testable hypotheses regarding the role of cross level interactions: We thus hypothesize that community level acceptance of wife-beating will affect the relationship between employment and abuse. Hypothesis 4a): The contextual level of female employment is not only important in itself, but also as a mediator of how resources at the individual level impacts abuse. Hypothesis 4b): The contextual level of acceptance of wife-beating leads to more violence, and it mediates how resources at the individual level impacts abuse. Hypothesis 4c): The mediating role of contextual level acceptance is strongest for individual level employment (as we propose in the contextual gendered employment theory).
3
Data
In all the empirical analyses in this paper, we use data from the Demographic and Health Surveys (DHS). The DHS provide standardized surveys across years and countries at the individual and at the household (couple) level. They also contain finer measures of geographical location. The geographical information for individuals consists of GPS coordinates at the DHS cluster level (a cluster may be one or several geographically close villages, or a neighborhood in an urban area). The surveys are always conducted on a sample of female respondents, and increasingly, men are also being sampled and interviewed. Since the 1990s, the DHS include questions about attitudes towards wifebeating. At the end of the 1990s, a standardized module was developed with questions about the respondent’s experience with being abused. Most of these questions regard intimate partner violence, which is the focus of this paper – although there are some questions also about mistreatment by others. For all surveys carried out in Sub-Saharan Africa that contain information either on attitudes towards or experience with wife-beating, we combine the women’s questionnaires into one large data set. In addition, we combine the couples’ questionnaires from the surveys that contain the domestic violence module into a separate data set. These surveys form the basis for the main samples used throughout the paper. The largest sample is what we refer to as the “Attitudes micro” sample, consisting of 586,255 women in the age span 15-49 years, interviewed in 50 different surveys from 30 countries over the years 2003-2013. These women live in 22,379 studies (Uthman et al., 2009b,a, 2011), and we thus expect this to be the case also in our data. Krishnan et al. (2010) argue that this is the case for female employment in their sample of poor communities in Bangalore, India, where they find a positive association between female employment and violence.
10
different survey clusters. We have data on their attitudes towards wife-beating, in addition to important background characteristics.3 The second main sample used throughout the paper, which we will refer to as the “Abuse micro” sample, is based on the 21 surveys conducted in SSA that include the domestic violence module. The sample consists of 156,929 women aged 15-49 over the years 2003-2013. They live in 19 different countries, spread out on 13,067 survey clusters. In the cross level analysis, this sample reduces to 143,225 individuals as we add information on partner’s employment and education. We label this third sample the “Abuse cross” sample. The last main sample – the “Abuse couple” sample – contains information on 45,513 women from 19 couples’ questionnaires in 15 countries containing the domestic violence module. This sample differs from the other samples in that the information gathered on men (spouses) is self-reported by the men, while in the other samples this information is reported by the woman being interviewed. In total, 8,721 survey clusters are included and the time period consists of nine years between 2003 and 2013.
3.1
Outcome variables
Summary statistics for the main outcome variables used in this paper are shown in Table 1. The outcome variables are similarly distributed across the different samples. We call the main variable capturing attitudes towards wife-beating “Accept”. This variable equals one if the person agrees that a husband is justified in beating his wife in any of the five following situations: She goes out without telling him, she neglects the children, she argues with him, she refuses to have sex with him, or she burns the food. 52% of the women in the “Attitudes micro”-sample agree that husbands are justified in beating their wife in at least one of these situations. The corresponding fraction of men is considerably lower, at 29% (as seen in the “Abuse couple”sample). Table 1 also presents the summary statistics for each of the five separate questions, and we can see that wife-beating is considered to be the most acceptable in the case where a woman would neglect the children, and it is considered the least acceptable in the case where she would burn the food. The lower half of Table 1 displays the data on women’s experience with being abused. These data are collected in the special domestic violence module, implying that not all women are selected to answer these questions. Intimate partner violence is measured using a modified Conflict Tactics Scale (CTS), which has several 3
As household income is available only from 2003 on, we have chosen to start our data here, though the surveys containing questions about attitudes go as far back as 1999, extending to 665,493 women in total.
11
Table 1: Descriptive statistics, outcome variables (1) Attitudes micro Mean SD
(2) Abuse micro Mean SD
(3) Abuse couple Mean SD
0.36 0.39 0.33 0.28 0.19 0.52
0.34 0.35 0.31 0.27 0.16 0.49
(0.47) (0.48) (0.46) (0.44) (0.37) (0.50)
0.31 0.33 0.29 0.25 0.16 0.47 0.29
(0.46) (0.47) (0.45) (0.44) (0.36) (0.50) (0.45)
Respondent has during last year been exposed to – less severe violence – severe violence – sexual violence Any of the above (variable Abuse)
0.22 0.03 0.09 0.25
(0.41) 0.21 (0.18) 0.04 (0.29) 0.09 (0.43) 0.25
(0.41) (0.19) (0.28) (0.43)
Respondent has ever been exposed to – less severe violence – severe violence – sexual violence Any of the above (variable Abuse(ever)) N 586255
0.28 0.10 0.11 0.32 156929
(0.45) 0.26 (0.44) (0.30) 0.09 (0.29) (0.31) 0.09 (0.29) (0.47) 0.30 (0.46) 45513
Respondent deems beating justified if wife – goes out without telling – neglects the children – argues with him – refuses to have sex – burns the food Any of the above (variable Accept) Husband accepts
(0.48) (0.49) (0.47) (0.45) (0.39) (0.50)
Note: The table gives the mean and standard deviations for the main outcome variables and their constituting parts in the main samples used in this paper.
12
advantages compared to many other datasets on violence (see Kishor (2005) for an extensive overview). A characteristic of CTS is that it uses several different questions regarding specific acts of violence. In this way the measure is less likely to be polluted by different understandings of what constitutes violence. CTS is also argued to reduce underreporting, as it gives respondents multiple opportunities to disclose their experiences of violence (Kishor, 2005; La Mattina, 2013). The interviewers who use the domestic violence module are trained specifically to handle the sensitive questions of intimate partner violence, and they follow a strict protocol ensuring privacy. In particular, the interviewers are instructed to check all the surroundings within hearing distance for the presence of others. Only children young enough to not understand the questions are allowed to be present. The interviews are not allowed to proceed if privacy is not ensured, and the interview is terminated if someone enters the zone (DHS 2011, Interviewer’s manual for the domestic violence module). The care with which data is collected inspires confidence that the problem of underreporting is as low as possible. Furthermore, the high reported prevalence of violence across the region suggests that a considerable degree of women are willing to report violence. Likewise, the high acceptance of wife-beating that we document suggests that social acceptability bias in reporting may be of less importance than in other settings. Palermo et al. (2013) use 24 DHS surveys to provide bounds for other sources of violence data, such as health systems data or police records. They found that only 40% of the women having experienced abuse in the DHS surveys had reported this to someone, and that only 7% had reported it to a formal source. Hence, even though underreporting may still be an issue, it is most likely smaller in this data than in other sources. Only women who have ever lived with a partner are selected to answer the questions about experience with intimate partner violence. The module includes questions about both emotional and physical (including sexual) violence. Our focus in this paper mainly lies with the latter type of violence. The variable that we call “Abuse” is set equal to one for women who answer that they have ever had a partner doing one of the following to them during the last 12 months prior to being interviewed: Pushing, shaking, slapping, throwing something, or twisting an arm, striking with a fist or something that could cause injury, kicking or dragging, attempting to strangle or burn, threatening with a knife, gun, or other type of weapon, and attacking with a knife, gun, or other type of weapon, physically forcing intercourse or any other sexual acts, or forcing her to perform sexual acts with threats or in any other way. 25% of the women in our module sample were subject to such abuse during the last twelve months and we also see that women are often subjected to several types of abuse and that the most common type of abuse is less severe violence.
13
For all the sub-questions constituting this variable, the women are also asked about whether they ever experienced any of the types of violence asked about. Based on this information, we create the variable called “Abuse (ever)”, which equals one if the woman has ever experienced any such form of physical violence. We see that 32% of the women have been abused. Hence, the vast majority of women who have ever been abused were also abused during the last year. We focus on abuse last year in our regressions as it connects better to some of our independent variables of interest, such as employment status last year.
3.2
Explanatory variables
The hypotheses outlined in Section 2 concern the importance of wealth, employment and education of women and their partners – at both the individual, household, and contextual level – in predicting the incidence and acceptance of violence against women. Summary statistics for these variables in the different samples are shown in Appendix Table A.1. The resource indicators are similarly distributed across the main samples in our study. Our measure of household wealth is based on the wealth index provided in the DHS. The wealth index is a standardized measure of economic status for households in a given survey. The index uses information on assets and services available within the household, such as type of flooring, water supply, electricity, and the ownership of durable goods such as a radio or a refrigerator.4 Education and employment are not included in the index, which allows us to analyze the different factors separately (Pamuk et al., 2011). The wealth index is standardized within the country and survey year, thus providing information on the relative wealth for households within a survey. We divide households into quintiles based on this index, which are labeled “poorest”, “poor”, “middle”, “rich”, and “richest”. The educational attainment of women and their partners is measured by years of schooling, and by their highest level of educational attainment. On average, the women and men in our “Abuse couple”-sample have 4.75 and 6 years of education, respectively. We create four indicator variables for the highest attained level of education: No formal education, elementary, secondary and postsecondary education. Our main measure of employment is the indicator variable “Employed last year”, which equals one if the woman has been working during the last 12 months prior to the interview. Close to 70% of the women in our different samples responded affirmatively. We also know whether women work for cash, are paid in 4
The assets are connected to an underlying region specific wealth score, and they are assigned a weight by principal components analysis that is used to calculate the overall score. The score is then standardized within the survey and each household is then assigned a relative position. (See Rutstein and Johnson (2004) for an extensive description of the wealth index.)
14
kind, or a combination of the two. In addition, we know the sectors where the individuals are employed.5 The women are also asked if their partners were working the last 12 months and in what type of occupation. Employment is near universal for partners, at 97%. In the couple sample we overall have the same information for men and women (with the exception of men’s experience with being abused). 96% of the husbands in this sample self-report that they are employed. In order to generate variables at the contextual or macro level, we first aggregate the information on wealth, employment, education and the acceptance of wife-beating into averages at the DHS cluster level, excluding the individual’s own observation.6 This method (also known as “jackknifing”) ensures that the individual’s own characteristics are not conflated with those of the surrounding community. In the analysis of the importance of wealth at the contextual level, we create an indicator variable for living in a rich cluster that equals one for everyone living in a cluster that has above median wealth score. We also create a measure of inequality between households in the community. Following Fenske (2012), we compute the Gini coefficient for each cluster and region, by re-scaling the wealth index to only include positive values and then use the fastgini-command in Stata. This results in a dummy variable indicating whether the individual or household is situated in an unequal cluster, defined as having above median level of inequality. The contextual measures of employment and education are based on the jackknifed averages described above. For both variables, we divide clusters into two by splitting the sample at the median level of female employment and education, giving equally sized groups for each variable.
3.3
Additional control variables
The DHS include extensive information on individuals’ background characteristics. The ones we use as control variables in our analyses are also presented in Appendix Table A.1. Though there are slight differences across samples in women’s age, marital status and number of children, due to the sampling criteria for the domestic violence module (only women currently living with a partner) and the couples’ questionnaire (only married or cohabiting women), they are still fairly similar: 30 5
The different sectors, or type of work, are categorized as: professional, clerical, sales, agricultural self employed, agricultural employed, domestic, service, skilled manual, and unskilled manual. 6 We believe the cluster level to be the most important, both a priori, as people meet in everyday life at this level, and because we see from multilevel regressions that 22% and 15% of the variation in the acceptance and the incidence, respectively, of violence is found at the cluster level. For comparison: 14% and 5% of the corresponding variation is explained at the national level (results are available upon request), and previous literature suggests that there is no clear correlation between country level attitudes and individual attitudes (Uthman et al., 2009b).
15
years old on average, most have a partner and children, 30-40% are Muslim, about 20% are Christian, and about 30% live in urban areas. The men in the couples sample are on average older and have more children than their wives. In our regression analysis we use seven indicator variables for 5 year age intervals ranging from 15-19 years to 45-49 years and four fixed effects for marital status: Married, Cohabitant, Divorced, and Widow. We also use dummy variables for having one-three children, four-six children, and more than six children. We control separately for being Christian, Muslim or having other religious affiliations, as well as an indicator variable for whether information on religious affiliation is missing (this is because a few surveys do not report religious affiliation).
4
Geographical patterns and trends over time
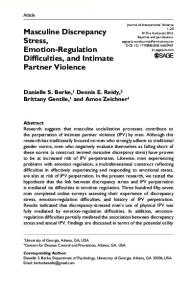
The high number of observations in our data and their spread across years and countries make it possible to track broad patterns in the acceptance and incidence of intimate partner violence across time and space. Table A.2 in the Appendix gives the mean values of acceptance and abuse for each survey that contains questions on either attitudes or experience with abuse.7 There is substantial variation in both acceptance and incidence across location and over time, with the survey of DR Congo in 2007 yielding the highest average reported abuse (a weighted average of 59%), and the survey of Burkina Faso in 2010 yielding the lowest number (at 9%). Regarding the share of women who find wife-beating acceptable, Guinea and Sao Tome and Principe lie at the two extremes: In Guinea (2005), as many as 88% of women accept wife-beating according to the DHS, whereas in Sao Tome and Principe (2008) only 20% do. For the surveys containing GPS coordinates, we have plotted the mean responses to the questions about acceptance and incidence of abuse for each survey cluster in the maps in Figure 1. The maps show that there is substantial variation in both acceptance and incidence also within countries. The correlation between acceptance of wife-beating among women and their experience with being beaten is strongly positive, both at the individual level (13%) and at the aggregate level (29% at the cluster level and 33% at the country level). Using DHS data for 26 countries in Africa, South America and Asia, Pierotti (2013) documents a clear trend over time in attitudes, whereby women increasingly reject the legitimacy of wife-beating. The upper panel of Figure 2 shows that there is a falling rate over time in women’s tendency to condone wife-beating also in our sample of Sub-Saharan African countries. The figure presents yearly means in acceptance and incidence rates. Since different countries are sampled in different 7
Some of the earlier surveys do not contain wealth indicators, and they are therefore not included in the main samples of the paper.
16
Figure 1: Acceptance and abuse rates across Sub-Saharan Africa
Share of women 0,00 - 0,21 0,22 - 0,42 0,43 - 0,61 0,62 - 0,81 0,82 - 1,00 Countries with data on attitudes
Share of women 0,00 - 0,09 0,10 - 0,24 0,25 - 0,41 0,42 - 0,64 0,65 - 1,00
17
Figure 2: Acceptance and incidence of violence over time (women only).
.2 .3 .4 .5 .6 .7
Adjusted means
2000
2005
2010
2015
2010
2015
year
.2
.4
.6
.8
Raw means
2000
2005 year
Accept Abuse (ever)
Abuse
Note: The figure shows the mean value for the rates of acceptance and abuse across different years in our sample. In the upper panel, only countries for which there exist repeated surveys are included, and the means have been adjusted by netting out each country’s deviation from the overall mean. In the lower data, raw means for the full sample are shown.
Table 2: Change in violence acceptance and incidence rates over time. (1) Accept Interview year -0.015*** (0.00058) Country FE No R squared 0.014 N. of respondents 665493
(2) (3) (4) Accept Abuse Abuse -0.019*** -0.014*** -0.0090*** (0.00046) (0.00075) (0.00082) Yes No Yes 0.13 0.0098 0.070 596846 158396 111738
Note: Each column presents an OLS regression of the outcome variable denoted in the column heading on the year in which the respondent was interviewed (year enters as a linear variable). In all columns, the full sample is used (it is not restricted to the availability of various resource indicators, as in the analyses in Section 5). In columns (2) and (4), only countries for which there exist repeated surveys are included in the sample. * p < 0.10,** p < 0.05, *** p < 0.01.
18
years, the upper panel only includes countries for which we have at least two separate surveys, and the means have been adjusted for how the respondents’ country’s mean deviates from the overall mean in the sample. The lower panel shows the raw data for all the surveys. Table 2 gives the corresponding OLS estimates for how acceptance and incidence rates decline with time. Column (1) shows the estimate from regressing the tendency to condone wife-beating on the interview year (entering as a linear, numeric variable), while in column (2) we add country fixed effects and reduce the sample to countries with at least two survey rounds (the estimates paralell the lower and upper panel of Figure 2, respectively). The overall trend over time is that the rate of acceptance declines by 1.5 percentage points per year. Adding country fixed effects in column (2), this estimate becomes a 1.9 percentage points decline per year. Columns (3) and (4) show the same estimations with actual abuse as the outcome variable. The overall time trend is a 1.4 percentage points decline per year throughout our sample period. However, looking only in the sample of countries with more than one survey and controlling for country fixed effects, this estimate is reduced by about 1/3, to a time trend of 0.9 percentage points decline per year. This estimate still shows a subtantial, and strongly statistically significant, decline.8 The broad differences over time and space suggest that the rate of violence against women depends very much on the context in which it takes place. In the following, we investigate how economic resources at the micro and macro levels interact and correlate with acceptance and abuse throughout our sample. In particular, we will focus on the various hypotheses emerging from the existing literature (as presented in Section 2).
5
Resources and intimate partner violence
We estimate the relationship between the violence outcomes and resource indicators using multivariate OLS regression (i.e., linear probability models) of models with the specification: Yict = α + βZict + γXict + uict
(1)
Yict refers to whether individual i, living in country c and interviewed in year t, experienced being physically abused by her husband/partner during the last 12 8
Looking at each country individually (as can be done in Table A.2), the average level acceptance went significantly down in all countries except Rwanda between 2005 and 2010 and Madagascar. For the average level of actual abuse, it went up in Rwanda, and insignificantly down in Zimbabwe, otherwise it went significantly down in all the other countries for which there are two suveys.
19
months prior to the interview. (In some specifications, Yict denotes the respondent finding wife-beating acceptable). Zict is a vector with various resource indicators pertaining to the individual or her partner and their relative standing (in the micro analyses), and their community (in the macro analyses). More specifically, it will generally contain indicator variables for different categories of household wealth, length of education, and of employment during the last 12 months prior to being interviewed.9 Xict is a vector of demographic control variables (described in Section 3). In some cases we use an indicator of the individual’s attitudes towards wife-beating as a control variable. In the macro specifications, we include in Xict the cluster aggregates described in Section 3. Country and year dummies are included in all regressions. When we analyze macro level variables, there is no variation within the clusters and hence the observations are not independent. We further believe that the observations are dependent within DHS clusters in all analyses, and hence standard errors are clustered at the DHS cluster level in all regressions.
5.1
Intimate partner violence and micro level resources
For the investigation of hypotheses at the micro level, we use the samples based on the individual women’s surveys: The “Attitudes micro” and the “Abuse micro” samples (described in Section 3). The estimation results are presented in Table 3. The likelihood of finding wife-beating acceptable is the outcome in column (1). We see that the propensity to condone wife-beating is monotonously negatively correlated with household wealth and individual education. Relative to the poorest group (the left out category), the women belonging to the richest quintile of households are 9.2 percentage points less likely to condone wife-beating. The relationship with education is even stronger, where women with secondary education are on average 8.5 percentage points less likely to condone wife-beating than are women with no formal education (and the small elite of women with postsecondary education, constituting 3.4% of our sample, are 24 percentage points less likely to condone it). There is a small, positive correlation between condoning wife-beating and being employed among the women in our sample. Columns (2)-(4) show regressions where the outcome variable is women’s experience with actual abuse, carried out on our sample of 156,929 women who responded to questions in the special domestic violence module. The picture in column (2) is very different from that in column (1). First, wealth is much more weakly linked to a decline in abuse rates. Only the richest quintile has both a 9
In some cases, these variables will be included as numerical variables rather than as dummies. For a thorough description of the variables and the samples used at the different analytic levels, we refer the reader to Section 3.
20
Table 3: OLS regressions with absolute resource levels (1) Accept Household wealth Poor Middle Rich Richest Education Elementary Secondary Postsecondary Employment Last 12 months
-0.0028 (0.0032) -0.0086** (0.0036) -0.032*** (0.0041) -0.092*** (0.0049)
(2) Abuse
(3) Abuse
-0.0028 -0.0029 (0.0041) (0.0041) -0.0021 -0.0015 (0.0045) (0.0045) -0.0090* -0.0057 (0.0051) (0.0050) -0.036*** -0.027*** (0.0061) (0.0061)
-0.0030 (0.0041) -0.0015 (0.0045) -0.0057 (0.0050) -0.027*** (0.0061)
-0.022*** 0.053*** 0.052*** (0.0028) (0.0039) (0.0039) -0.085*** 0.031*** 0.036*** (0.0035) (0.0050) (0.0049) -0.24*** -0.033*** -0.017** (0.0057) (0.0076) (0.0076)
0.057*** (0.0061) 0.040*** (0.0069) -0.0021 (0.013)
0.0063** (0.0025)
0.037*** (0.0033)
0.041*** (0.0051)
0.080*** (0.0031)
0.080*** (0.0031)
0.099 156929
-0.0059 (0.0071) -0.0055 (0.0076) -0.019 (0.014) 0.099 156929
0.038*** (0.0033)
Attitudes Accept Interactions Elementary × Employed Secondary × Employed Postsecondary × Employed R squared N. of respondents
(4) Abuse
0.16 586255
0.092 156929
Note: Each column presents an OLS regression of the outcome variable denoted in the column heading. All regressions control control for living in urban areas, age, marital status, the number of children, and religious affiliation. Year and country fixed effects are included in all specifications. The reference category is a woman aged 15-19 with no formal education, married with no children to a partner with the same characteristics, neither Christian nor Muslim, who have not been employed during the last 12 months, and who live in a rural area. * p < 0.10,** p < 0.05, *** p < 0.01.
21
sizably and statistically significantly lower risk of abuse. The relationship between education and risk of abuse takes the shape of an inverted U, by which women with elementary or secondary education are significantly more likely to have been abused during the last year than are the women without formal education, by 5.3 and 3.1 percentage points, respectively. Only the small group of women with post-secondary education are significantly less likely to be victims of abuse, by 3.3 percentage points. A woman’s employment during the last 12 months is positively associated with a 3.8 percentage points higher risk of her having been abused during the same period. The association is highly statistically significant. Held together with the positive coefficients for education at the elementary and secondary level, and the absence of significant associations with wealth, this yields a very different picture of how resources are linked to the incidence of abuse, than what emerges from investigating the relationship between resources and attitudes towards violence. Contrary to the correlations with attitudes, the correlations between resources and actual abuse are not consistent with the notion of women’s access to resources being protective (hypothesis 1a). If anything, the correlations lend support to theories of violence backlash (hypothesis 1b). As we have seen that attitudes towards wife-beating are strongly correlated both with actual abuse and individual resources, an indicator variable for the individual’s stated acceptance of wife-beating is added to the specification in column (3). This yields a positive association with the likelihood of being abused of 8 percentage points. Nonetheless, controlling for attitudes causes only minor changes in the estimated correlations between resources and women’s risk of abuse. The overall pattern remains the same, indicating that the relationships are not only mediated by attitudes. In column (4), we have added interactions between employment status during the last year, and the woman’s education category, in order to see whether employment is equally strongly correlated with abuse in all education groups. The interaction terms are all negative, but none is statistically significant. Thus, the hypothesis that women’s resources become protective beyond a certain level (hypothesis 1c), finds little support in our data. Figure 3 summarizes our main findings on the relationship between absolute level resources and abuse. The top left panel shows the raw correlation between educational attainment on the one hand, and attitudes (darker bars) and abuse (lighter bars) on the other. More education is correlated with less acceptance of violence in a linear fashion. The relationship between education and actual violence, however, is clearly hump-shaped. Increased relative wealth is linearly and negatively correlated with acceptance of violence whilst the unconditional correlation between wealth group and actual violence is rather flat. Finally, there
22
Figure 3: Women attitudes and experience with violence by resource level.
0
0
Share of women .4 .6 .2
By wealth quintile
Share of women .2 .4 .6
By education
No education Primary Secondary Higher
Poorest
Poor
Middle
Rich
Richest
0
Share of women .2 .4 .6
By employment
Not employed
Employed
Accept
Abuse
23
is no unconditional correlation between acceptance of violence and employment, but employed women are slightly more likely to have been abused. For the investigation of hypotheses regarding the role of spouses’ (or partners’) relative resources, we use the “Abuse couple” sample, based on the couples’ surveys as described in Section 3.
24
Table 4: OLS regressions with spouses’ relative resource levels
Education She elementary She secondary She postsecondary He elementary He secondary He postsecondary He more education She more education
(1) Abuse
(2) Abuse
(3) Abuse
(4) Abuse
0.051*** (0.0069) 0.033*** (0.0093) -0.018 (0.015) 0.025*** (0.0068) 0.0075 (0.0084) -0.026** (0.012)
0.046*** (0.0075) 0.027*** (0.010) -0.025 (0.016) 0.021*** (0.0075) 0.0039 (0.0100) -0.030** (0.014) 0.013** (0.0065) 0.021*** (0.0077)
0.047*** (0.0074) 0.035*** (0.010) -0.0064 (0.016) 0.022*** (0.0075) 0.0084 (0.0099) -0.019 (0.014) 0.012* (0.0065) 0.019** (0.0076)
0.038*** (0.0099) 0.034*** (0.013) -0.0036 (0.019) 0.0047 (0.010) -0.014 (0.013) -0.032* (0.018) 0.0056 (0.0088) 0.0095 (0.010)
Employment last 12 months She employed 0.035*** 0.035*** 0.034*** (0.0054) (0.0055) (0.0055) He unemployed -0.033** -0.038* -0.034* (0.013) (0.019) (0.019) She is breadwinner 0.0065 0.0089 (0.026) (0.025) Attitudes on wife-beating She condones 0.071*** (0.0059) He condones 0.051*** (0.0079) Both condone 0.012 (0.011) R squared 0.092 0.093 0.10 N. of respondents 45513 45513 45513
0.029*** (0.0074) -0.070*** (0.027) 0.051 (0.035) 0.039*** (0.011) 0.020* (0.012) 0.015 (0.011) 0.10 45513
Note: Each column presents an OLS regression of the outcome variable denoted in the column heading. Year and country fixed effects and the covariates displayed in Table 3 are included in all specifications. The first column presents results using the “Abuse cross”-sample and in the other columns the Abuse couples sample is used. * p < 0.10,** p < 0.05, *** p < 0.01.
25
Table 4 (cont.): OLS regressions with spouses’ relative resource levels. Interaction terms (1) Abuse
(2) Abuse
(3) Abuse
Her attitudes interacted × She elementary education
0.0051 (0.014) -0.014 (0.019) -0.030 (0.039) 0.027* (0.015) 0.035* (0.019) 0.018 (0.029) -0.0050 (0.013) 0.018 (0.016) 0.015 (0.010) 0.056 (0.035) -0.072 (0.051)
× She secondary education × She postsecondary education × He elementary education × He secondary education × He postsecondary education × He more education × She more education × She employed last 12 months × He unemployed last 12 months × She breadwinner last 12 months His attitudes interacted × She elementary education × She secondary education × She postsecondary education × He elementary education × He secondary education × He postsecondary education × He more education × She more education × She employed last 12 months × He unemployed last 12 months × She breadwinner last 12 months R squared N. of respondents
(4) Abuse
0.092 45513
0.093 45513
0.10 45513
0.023 (0.015) 0.030 (0.021) 0.011 (0.047) 0.0064 (0.016) 0.015 (0.021) 0.0053 (0.036) 0.028* (0.015) 0.000048 (0.018) -0.0077 (0.012) 0.039 (0.035) -0.036 (0.054) 0.10 45513
Note: Each column presents an OLS regression of the outcome variable denoted in the column heading. Year and country fixed effects and the covariates displayed in Table 3 are included in all specifications. The first column presents results using the “Abuse cross”-sample and in the other columns the Abuse couples sample is used. * p < 0.10,** p < 0.05, *** p < 0.01.
The estimation results are presented in Table 4. Actual abuse is the outcome variable in all columns. Household wealth is included as a control in all specifications (the coefficients are not shown). In column (1), we have included indicator variables for the husband’s level of education and his employment status. Compared with the estimates presented in Table 3, the inclusion of his resource indicators does not change how her education is associated with being abused: Elementary and secondary education are still associated with a higher risk of abuse for her (post-secondary education is insignificantly correlated). His education shows a similar pattern: He is more likely to be abusive if he has elementary education compared to no formal education, and only if he has post-secondary education is he (significantly) less likely to be abusive. Being employed is still associated with a greater risk of being abused for women, of 3.5 percentage points, once we control for husband’s employment status. As 96% of the husbands are employed in the couple sample, employment is the baseline category, and we add a dummy for the husband’s unemployment. This variable is negatively correlated with her risk of abuse. Hence, both spouses’ employment is positively correlated with abuse in the household. The overall picture from the Table 3 – that women’s access to education and employment is associated with a greater risk of abuse (at least up until a certain level) – holds also once we control for husband’s access to the same type of resources. This is contrary to hypothesis 2a. Yet, we are interested in what happens if the woman’s level of resources exceeds the man’s. In terms of education; does it matter which spouse has relatively more schooling? In terms of employment; does it matter particularly that she is employed in the case where he is unemployed (i.e., that she is the breadwinner)? In column (2) we therefore include, first, measures for whether either the husband has more years of schooling than the wife, or vice versa. Second, we add an interaction term for her breadwinning status, indicating that the wife but not the husband is employed. Women with more years of schooling than their partners are on average 2.1 percentage points more likely to have been abused during the last year. Being less highly educated than her partner is also positively correlated with the woman’s risk of abuse, by 1.3 percentage points (in support of hypothesis 2b). As discussed in Section 2, the marital dependency theory argues that that women who have less resources than their men are more at risk, while the status inconsistency theory argues that women with more resources than their partners are more at risk. The two theories need not be contradictory, however, insofar as they both compare the inequality in resources to a situation of resource equality between spouses. Our education estimates could thus support both versions of the relative resource theory, thereby suggesting that equality between the spouses yields the least abuse. In the case of employment, we do not find support for the contention that female
27
breadwinners are particularly exposed to abuse. In additional analyses, included in the Appendix Table B.2, we find that the positive association of abuse with employment is present for almost all types of employment, the only exception being the more“high status” categories of “Professionals”, for whom there is no association, and “Clerical workers”, for whom the association is actually negative. Whether the women are family workers, selfemployed or work for someone else, does not matter for either the size or the sign of the correlation between employment and abuse. These relations are largely unchanged once indicator variables for both spouses’ attitudes on wife-beating are included in column (3). For both husband and wife, finding wife-beating acceptable is positively associated with the wife being beaten, and the association is the strongest with her attitudes towards wife-beating. Lastly, we explore the predictions from gendered resource theory in column (4), where we present the estimation of a specification where the indicator variables for his and her finding wife-beating acceptable are interacted with the measures of individual and relative resources. None of the 22 interaction terms are statistically significant at the 5% level and hence, we find little support for the gendered resource theory (hypothesis 2c) in our data.
5.2
Intimate partner violence and macro level resources
For the investigation of hypotheses regarding factors at the contextual (“macro”) level, and how contextual aggregates mediate the associations between intimate partner violence and resources at the individual level (as documented above), we use the “Attitudes micro” sample and the “Abuse cross” sample (described in Section 3). The measures of resources at the aggregate level that are included in the regressions are five indicator variables capturing whether the cluster where the respondent lives is rich (defined as mean household wealth in this cluster being above the median among the cluster means), has above median female employment rates, has an above median level of average female education, has an above median score on the inequality index (based on the wealth of the respondents in this cluster), and, lastly, whether the cluster’s women are above median prone to condone wife-beating.
28
Table 5: OLS regressions at the macro level (1) Accept Education She years of schooling She years of schooling squ. He years of schooling He years of schooling squ. He more education She more education Employment She last 12 months He is unemployed She is breadwinner Attitudes on wife-beating She condones
(2) Abuse
(3) Abuse
0.0079*** (0.0012) -0.00068*** (0.000081) 0.0048*** (0.0012) -0.00045*** (0.000067) 0.014*** (0.0047) 0.022*** (0.0047)
0.0093*** (0.0016) -0.00073*** (0.00011) 0.0029* (0.0016) -0.00039*** (0.000095) 0.017** (0.0066) 0.021*** (0.0069)
0.0073*** (0.0014) -0.00064*** (0.000093) 0.0024* (0.0014) -0.00029*** (0.000079) 0.012** (0.0056) 0.020*** (0.0056)
0.030*** (0.0036) 0.022 (0.016) -0.011 (0.016)
0.031*** (0.0048) 0.017 (0.018) -0.015 (0.018)
0.021*** (0.0041) 0.019 (0.021) -0.0094 (0.023)
0.070*** (0.0032)
0.070*** (0.0032)
0.070*** (0.0032)
-0.0011 (0.0056) 0.049*** (0.0056) 0.014* (0.0087) 0.033*** (0.0042) 0.0073* (0.0041) Employed cluster -0.0025 (0.0022) 0.000080 (0.00016) 0.0033 (0.0022) -0.00010 (0.00013) -0.0043 (0.0092) 0.0022 (0.0093) -0.0017 (0.0073) 0.022 (0.031) -0.0032 (0.035) 0.11 143225
0.00022 (0.0056) 0.048*** (0.0056) 0.018*** (0.0039) 0.0092 (0.0084) 0.0079* (0.0041) Accepting cluster 0.0029 (0.0024) -0.00029 (0.00019) 0.0064*** (0.0024) -0.00044*** (0.00014) 0.0020 (0.0099) 0.0057 (0.0098) 0.025*** (0.0071) 0.014 (0.027) -0.012 (0.030) 0.11 143225
Cluster aggregates Rich
-0.0013 (0.0056) High female education 0.049*** (0.0056) High female employment 0.019*** (0.0039) High female acceptance of wife-beating 0.033*** (0.0042) High wealth inequality 0.0073* (0.0041) Cross-level interactions × She years of schooling × She years of schooling squ. × He years of schooling × He years of schooling squ. × He more education × She more education × She last 12 months × He is unemployed × She is breadwinner R squared N. of respondents
0.11 143225
Note: Each column presents an OLS regression of the outcome variable denoted in the column heading. Year and country fixed effects and the covariates displayed in Table 3 are included in all specifications. The first column presents results using the “Abuse cross”-sample and in the other columns the Abuse couples sample is used. * p < 0.10,** p < 0.05, *** p < 0.01.
The main estimation results are presented in Table 5. Again, abuse is the outcome variable in all columns. Adding the cluster aggregates (column (1)) does not change the associations between women’s experience with abuse and their resource indicators, thus confirming the relationships documented in Tables 3 and 4. His unemployment, on the other hand, is no longer significantly related to the likelihood of abuse. Looking at the contextual level, we again find no evidence of the protective role of resources. Living in a relatively richer cluster is not significantly associated with the likelihood of experiencing abuse, but high levels of female employment and education at the cluster level are both significantly associated with higher abuse rates. Hence, we find no support for hypothesis 3a but rather for hypothesis 3b. This is surprising in light of bargaining theories, which stress how the quality of women’s outside options affect their women’s likelihood of remaining in a violent relationship. Living in a resource unequal cluster is associated with a slightly higher risk of abuse, supporting hypothesis 3c. Lastly, we note that living in a cluster with a relatively high tendency among women to condone wife-beating is positively associated with the individual risk of abuse, also when the respondents’ own acceptance is controlled for. The first theory of cross-level interactions particularly emphasize how female employment at the cluster level not only matters for the risk of abuse itself, but also as a mediator for the relationship between individual resources and risk of abuse (hypothesis 4a). The interactions terms displayed in column (2), however, show no significant difference in these associations by the cluster level of female employment. In particular, there is no support for the notion that female breadwinners are especially vulnerable in areas where fewer women work. In order to investigate our proposed theory that female employment may be particularly risky in settings where wife-beating is found more acceptable (hypothesis 4c), we interact the resource variables with the indicator for living in a cluster with above median levels of acceptance in column (3), and we find that the association of her employment with abuse is more than twice as high in contexts of higher acceptance than in areas with relatively lower levels of acceptance. We also see that macro level acceptance mediates the effects of other resources (hypothesis 4b), albeit only with respect to the partners level of education. In Appendix Table B.1, we present the results for the interactions with the other cluster aggregates. Summing up the macro- and cross-level results, we do find that the macro level is important, but not in all respects and not always in accordance with predictions based on theories in the previous literature. In areas where relatively more women work, and in areas where women have relatively more education, women are actually more at risk of abuse than in other areas. Neither is there any support for the notion that working – or being a female breadwinner – in
30
Figure 4: Acceptance and abuse by individual employment and contextual acceptance level.
Employment correlations in different areas Areas where violence is not accepted
.6 .2 0
0
.2
Share of women .4
Share of women .4
.6
.8
.8
Areas where violence is accepted
Not employed Accept
Employed Abuse last year
Not employed Accept
Employed Abuse last year
Source: Own calculations based on DHS data
31
areas where fewer women work is more risky. Regarding wealth, there is no lower risk of abuse in relatively richer areas, but in support of social disorganization theory there is a higher risk of abuse in more unequal areas. The latter prediction has not been tested before. Finally, we find support for the contextual gendered employment theory, as being employed in areas with higher acceptance of violence is indeed correlated with a higher risk of abuse. Figure 4 shows this relationship clearly. While acceptance rates are similar between working and non-working women irrespective of work status, there is a much larger difference in risk of abuse for working and non-working women in areas where violence is accepted to a greater extent.
6
Discussion
In this paper we have explored the relationship between resources and women’s risk of being physically abused in Sub-Saharan Africa, the region with the highest levels of violence against women in the world (Garc´ıa-Moreno et al., 2005; Devries et al., 2013). Applying the ecological approach (Heise, 1998; Uthman et al., 2009b, 2011) we explicitly model the effects of resources at the individual, the couple, and the community level, and we allow for interactions across these levels. The analysis is carried out using high quality micro data from the Demographic and Health Surveys with information on abuse for over 150,000 women from 19 countries for 10 years. The quality and scope of the data allow us to explore an extensive set of hypotheses on the relationship between violence and resources – in terms of wealth, education and employment. With the exception of our own contextual gendered employment hypothesis, most of the hypotheses are derived from previous theories, but far from all of them have been taken to the data. The notion that resources affect the prevalence of intimate partner violence is widespread, and previous research has been centered around three different versions of resource theory. First, the simplest version (the standard resource theory) operates entirely at the individual level and posits that women with few resources are more at risk of abuse, and that men with fewer resources are more likely to be abusive (Goode, 1971). We find little support for this theory. In particular, we find that household wealth is correlated with less abuse, but we note that the relationship is non-linear. Similarly, we see that more education is correlated with more abuse, except in the rare case of women with post-secondary education. Most strikingly we find that employment is positively correlated with the probability of being abused. Hence, also the bargaining theories positing that violence within marriage ought to be reduced as women improve their outside options due to increased resources (Farmer and Tiefenthaler, 1997), are largely inconsistent with the findings in this paper. On the other hand, the “backlash 32
theory” of abuse is consistent with our results. Second, the relative resource theories also have opposing predictions, whereby in the status inconsistency version (e.g. Hornung et al. (1981)), women are predicted to be at more risk of abuse if they have more resources than their partners, while in the marital dependency version (e.g. Vyas and Watts (2009)) women are predicted to be more at risk if they have less resources than their partners. Our education estimates could support both these versions, as we find that both women with fewer and women with more years of schooling than their partners are more likely to be abused. In the case of employment, we do not find support for the status inconsistency contention that female breadwinners are particularly exposed to abuse, which has been highlighted as a risk factor in the US (Macmillan and Gartner, 1999). Rather, female employment is always correlated with a higher risk of abuse, irrespective of whether the partner is working or not. Third, the gendered resource theory takes the relative resource theory one step further and proposes that the effects of relative resources on abuse are moderated by the male partner’s gender ideology (Atkinson et al., 2005; Krishnan et al., 2010). Our results are not consistent with this theory, as neither of the associations between women’s risk of abuse and their resource indicators (either indiviudally or relative to their husbands) differ significantly by the husband’s attitudes towards wife-beating. There is generally less previous research on the macro level and cross level interactions in the relationship between abuse and resources. According to the social disorganization theory, men gain impunity in impoverished and unequal areas as abuse is more accepted there, and abuse is also more likely to go unreported in these areas even if not accepted (Benson et al., 2003; Uthman et al., 2009b). We find no support for the notion that abuse is more widespread in poorer areas. The link between inequality and abuse, although often theorized to be important (e.g. Pearlin (1975); Jewkes (2002)), has actually not been tested before. We find that women living in relatively more unequal areas face a slightly higher risk of abuse. In terms of cross level interactions we propose a new theory, the contextual gendered employment theory, whereby female employment leads to higher risk of abuse particularly in settings where prevailing norms and values are such that wife beating is accepted. This theory borrows insights from the gendered resource theory while at the same time acknowledging that the effects of micro level factors may be nested in the acceptance of wife-beating at the macro level. Consistent with this theory we find that the association of abuse with employment is twice as strong in areas with a high level of acceptance of wife-beating. This theoretical framework may explain some otherwise contradictory results previously presented in the literature. In particular, Aizer (2010) finds that increased employment opportunities for women in the US reduces the risk of abuse while Hjort and
33
Villanger (2011) find that abuse increases as women become employed in Ethiopia. According to our theory, female employment should be more risky in Ethiopia than in the US as acceptance of violence is much higher in the former setting. Our findings more generally underscore the need for good data at different levels when exploring the relationship between resources and intimate partner violence. In particular, we show that attitudes towards wife-beating cannot replace data on actual abuse in analyzes of how resources affect violence, and that using acceptance as a proxy for actual violence can be highly misleading. Although being accepting of violence is positively correlated with the probability of abuse on part of both victim and perpetrator, its positive, more or less linear correlations with wealth and education, mask the more complicated relationship between resources and actual abuse. Similarly, employment is only weakly related to acceptance but strongly positively related to abuse and the interaction between macro level acceptance and employment is highly relevant for predicting levels of abuse. Consistent with Pierotti (2013), we find that acceptance of abuse has decreased substantially in Sub-Saharan Africa, and we show that actual abuse has followed a similar pattern. This paper adds to the literature in several ways: We analyze the extent of intimate partner violence across Sub-Saharan Africa, a continent plagued by epidemic levels of violence against women. We do this by combining a large set of surveys spread out across the region. We consider jointly the numerous existing theories of the relationship between resources and violence and we also develop theory further. By simultaneously investigating the empirical role of employment, education and wealth, at different analytical levels, we get a fuller picture of the complex relationship between resources and abuse. The correlations documented in this broad study can be interpreted as causal effects only to the extent that we control for all other factors that simultaneously affect resources and abuse. While it is impossible in our setting to control for all potential confounding factors, the relationships between resources and violence incidence are robust to the inclusion of an extensive list of controls. We hope that future research may complement our findings with case studies testing causal effects in randomized or quasi-experimental settings.
34
References Ackerson, L. K., Kawachi, I., Barbeau, E. M., and Subramanian, S. V. (2008). Effects of individual and proximate educational context on intimate partner violence: a population-based study of women in india. Am J Public Health, 98(3):507–14. Aizer, A. (2010). The Gender Wage Gap and Domestic Violence. American Economic Review, 100(4):1847–1859. Angelucci, M. (2008). Love on the rocks: Domestic violence and alcohol abuse in rural mexico. The B.E. Journal of Economic Analysis & Policy, 8(1):1–43. Atkinson, M. P., Greenstein, T. N., and Lang, M. M. (2005). For women, breadwinning can be dangerous: Gendered resource theory and wife abuse. Journal of Marriage and Family, 67(5):1137–1148. Benson, M., Fox, G., DeMaris, A., and Van Wyk, J. (2003). Neighborhood disadvantage, individual economic distress and violence against women in intimate relationships. Journal of Quantitative Criminology, 19(3):207–235. Bobonis, G. J., Gonz´alez-Brenes, M., and Castro, R. (2013). Public transfers and domestic violence: The roles of private information and spousal control. American Economic Journal: Economic Policy, 5(1):179–205. Bratton, M., Mattes, R. B., and Gyimah-Boadi, E. (2005). Public opinion, democracy, and market reform in Africa. Cambridge University Press. Devries, K. M., Mak, J. Y., Bacchus, L. J., Child, J. C., Falder, G., Petzold, M., Astbury, J., and Watts, C. H. (2013). Intimate partner violence and incident depressive symptoms and suicide attempts: A systematic review of longitudinal studies. PLoS Med, 10(5):e1001439. Doepke, M. and Tertilt, M. (2009). Women’s liberation: What’s in it for men? The Quarterly Journal of Economics, 124(4):1541–1591. Duflo, E. (2012). Women empowerment and economic development. Journal of Economic Literature, 50(4):1051–79. Eswaran, M. and Malhotra, N. (2011). Domestic violence and women’s autonomy in developing countries: theory and evidence. Canadian Journal of Economics, 44(4):1222–1263. Farmer, A. and Tiefenthaler, J. (1997). An economic analysis of domestic violence. Review of Social Economy, 55(3):337–358. 35
Fenske, J. (2012). African polygamy: Past and present. MPRA Paper 41618, University Library of Munich, Germany. Flake, D. F. (2005). Individual, family, and community risk markers for domestic violence in peru. Violence Against Women, 11(3):353–373. Fried, S. T. (2003). Violence against women. Health and Human Rights, pages 88–111. Friedman, W., Kremer, M., Miguel, E., and Thornton, R. (2011). Education as liberation? Technical report, National Bureau of Economic Research. Fuwa, M. (2004). Macro-level gender inequality and the division of household labor in 22 countries. American Sociological Review, 69(6):751–767. Garc´ıa-Moreno, Jansen, Ellsberg, Heise, and Watts (2005). WHO multi-country study on women’s health and domestic violence against women: Initial results on prevalence, health outcomes and women’s responses. Technical report, Geneva: World Health Organization;. Gonz´alez-Brenes, M. (2004). Domestic Violence and Household Decision-Making: Evidence from East Africa. University of Massachusetts-Amherst. Unpublished manuscript. Goode, W. (1971). Force and violence in the family. Journal of Marriage and the Family, 33:624–636. Heath, R. (2012). Women’s Access to Labor Market Opportunities, Control of Household Resources, and Domestic Violence. World Bank Policy Research Working Paper, (6149). Heise, L. (1998). Violence against women: An integrated, ecological framework. Violence Against Women, 4:3:262–290. Heise, L. (2011). What Works to Prevent Partner Violence: An Evidence Overview. STRIVE Research Consortium, London School of Hygiene and Tropical Medicine (London: LSHTM, 2011), pages 27–28. Heise, L. and Garc´ıa-Moreno, C. (2002). World Report on Violence and Health, chapter Violence by Intimate Partners, pages 87–121. Hidrobo, M. L. and Fernald, L. (2013). Cash transfers and domestic violence. Journal of Health Economics, 32(1):304–319.
36
Hjort, J. and Villanger, E. (2011). Backlash: Female employment and domestic violence. Hornung, C., McCullough, C., and T, S. (1981). Status relationships in marriage: Risk factors in spouse abuse. Journal of Marriage and the Family, 43:679–692. Isaksson, A.-S., Kotsadam, A., and Nerman, M. (2013). The gender gap in african political participation: Testing theories of individual and contextual determinants. Journal of Development Studies, (ahead-of-print):1–17. Iversen, T. and Rosenbluth, F. (2008). Work and Power: The Connection Between Female Labor Force Participation and Female Political Representation. Annu. Rev. Polit. Sci., 11:479–495. Jewkes, R. (2002). Intimate Partner Violence: Causes and Prevention. The Lancet, 359:1423–1429. Johnson, H., Ollus, N., and Nevala, S. (2008). Violence against women: an International perspective. NY: Springer. Kabeer, N. (1997). Women, wages and intra-household power relations in urban bangladesh. Development and Change, 28:2:261–302. Kishor, S. (2005). Domestic violence measurement in the demographic and health surveys: The history and the challenges. Technical report, United Nations Expert Paper 1-9. Koenig, M., Ahmed, S., Hossain, M., and Mozumder, A. (2003). Women’s Status and Domestic Violence in Rural Bangladesh: Individual- and Community-level Effects. Demography, 40(2):269–288. Krishnan, S. (2005). Do structural inequalities contribute to marital violence? ethnographic evidence from rural south india. Violence Against Women, 11(6):759–75. Krishnan, S., Rocca, C. H., Hubbard, A. E., Subbiah, K., Edmeades, J., and Padian, N. S. (2010). Do changes in spousal employment status lead to domestic violence? insights from a prospective study in bangalore, india. Social Science & Medicine, 70(1):136–143. La Mattina, G. (2013). Armed Conflict and Domestic Violence: Evidence from Rwanda. Lundberg, S. and Pollak, R. A. (1996). Bargaining and distribution in marriage. Journal of Economic Perspectives, 10(4):139–158. 37
Macmillan, R. and Gartner, R. (1999). When She Brings Home the Bacon: Laborforce Participation and the Risk of Spousal Violence Against Women. Journal of Marriage and the Family, 61:947–958. Manser, M. and Brown, M. (1980). Marriage and household decision-making: A bargaining analysis. International Economic Review, 21(1):pp. 31–44. Mattes, R. and Bratton, M. (2007). Learning about democracy in africa: Awareness, performance, and experience. American Journal of Political Science, 51(1):192–217. McCloskey, L. A. (1996). Socioeconomic and coercive power in families. Gender and Society, 10:449–463. McElroy, M. B. and Horney, M. J. (1981). Nash-bargained household decisions: Toward a generalization of the theory of demand. International Economic Review, 22(2):pp. 333–349. Miguel, E. (2005). Poverty and witch killing. The Review of Economic Studies, 72(4):1153–1172. Mocan, N. H. and Cannonier, C. (2012). Empowering women through education: Evidence from sierra leone. Working Paper 18016, National Bureau of Economic Research. Palermo, T., Bleck, J., and Peterman, A. (2013). Tip of the iceberg: Reporting and gender-based violence in developing countries. Am J Epidemiol. Pamuk, E. R., Fuchs, R., and Lutz, W. (2011). Comparing relative effects of education and economic resources on infant mortality in developing countries. Population and Development Review, 37(4):637–664. Pearlin, L. I. (1975). Status inequality and stress in marriage. American Sociological Review, pages 344–357. Pence, E. and Paymar, M. (1993). Education groups for men who batter. New York: Springer. Pierotti, R. S. (2013). Increasing rejection of intimate partner violence: Evidence of global cultural diffusion. American Sociological Review, 78:2:240–265. Pollak, R. A. (2005). Bargaining power in marriage: Earnings, wage rates and household production. NBER Working Papers 11239, National Bureau of Economic Research, Inc. 38
Rutstein, S. and Johnson, K. (2004). The dhs wealth index. Technical report, DHS Comparative Reports No. 6. Calverton, Maryland, USA: ORC Macro. Schlozman, K., Burns, N., and Verba, S. (1999). ”What Happened at Work Today?”: A Multistage Model of Gender, Employment, and Political Participation. The Journal of Politics, 61(1):29–53. Sekhri, S. and Storeygard, A. (2014). Dowry deaths: Response to weather variability in india. Journal of Development Economics, 111(0):212 – 223. Special Issue: Imbalances in Economic Development. Straus, M., Gelles, R., and Steinmetz, S. (1980). Behind Closed Doors: Violence in the American Family. Anchor Press, New York. Tauchen, H. V., Witte, A. D., and Long, S. K. (1991). Domestic Violence: A Nonrandom Affair. International Economic Review, 32(2):491–511. True, J. (2012). The Political Economy of Violence Against Women. Oxford University Press. Uthman, O. A., Moradi, T., and Lawoko, S. (2009a). Factors associated with attitudes towards intimate partner violence against women: a comparative analysis of 17 sub-saharan countries. BMC International Health and Human Rights, 14(10). Uthman, O. A., Moradi, T., and Lawoko, S. (2009b). The independent contribution of individual-, neighbourhood-, and country-level socioeconomic position on attitudes towards intimate partner violence against women in sub-saharan africa: A multilevel model of direct and moderating effects. Social Science & Medicine, 68(10):1801–1809. Uthman, O. A., Moradi, T., and Lawoko, S. (2011). Are individual and community acceptance and witnessing of intimate partner violence related to its occurrence? multilevel structural equation model. PLoS ONE, 6(12):e27738. Vyas, S. and Watts, C. (2009). How does economic empowerment affect women’s risk of intimate partner violence in low and middle income countries? a systematic review of published evidence. Journal of International Development, 21(5):577–602. Wilkinson, R. (2004). Why is violence more common where inequality is greater? Annals of the New York Academy of Sciences, 1036:1:1–12. WorldBank (2011). World development report 2012: gender equality and development. World Bank Publications. 39
Appendix A: Sample distributions
40
Table A.1: Summary statistics on women’s background characteristics Sample: Respondents:
Attitudes micro
Abuse micro
Women
Women
Mean Household wealth group Poorest 0.18 Poor 0.18 Middle 0.19 Rich 0.21 Richest 0.24 Education None 0.36 Elementary 0.35 Secondary 0.26 Postsecondary 0.03 Years of schooling 4.65 Employment Last 12 months 0.65 Age 15-19 years 0.21 20-24 years 0.19 25-29 years 0.18 30-34 years 0.14 35-39 years 0.12 40-44 years 0.09 45-49 years 0.08 Age in years 28.88 Marital status Single 0.25 Cohabitant 0.10 Married 0.56 Divorced 0.06 Widow 0.03 Children No children 0.27 1-3 children 0.37 4-6 children 0.23 >6 children 0.13 N. of children 2.92 Religious affiliation Christian 0.39 Muslim 0.22 Other 0.34 Missing 0.05 Location Urban 0.34 N 586255
Abuse couple Women
SD
Mean
SD
Mean
SD
(0.38) (0.39) (0.39) (0.40) (0.43)
0.21 0.21 0.20 0.20 0.19
(0.40) (0.40) (0.40) (0.40) (0.39)
0.21 0.21 0.19 0.20 0.19
(0.41) (0.41) (0.39) (0.40) (0.39)
(0.48) (0.48) (0.44) (0.18) (4.49)
0.38 0.36 0.22 0.04 4.56
(0.49) (0.48) (0.42) (0.19) (4.55)
0.36 0.38 0.23 0.04 4.75
(0.48)
0.71
(0.45)
(0.41) (0.39) (0.38) (0.35) (0.32) (0.28) (0.27) (9.46)
0.07 0.19 0.22 0.18 0.14 0.10 0.09 31.22
(0.43) (0.30) (0.50) (0.23) (0.17)
Men Mean
SD
(0.48) (0.48) (0.42) (0.18) (4.53)
0.27 0.36 0.30 0.07 6.00
(0.44) (0.48) (0.46) (0.26) (4.88)
0.69
(0.46)
0.96
(0.20)
(0.26) (0.39) (0.42) (0.39) (0.35) (0.30) (0.28) (8.49)
0.08 0.21 0.26 0.19 0.14 0.08 0.05 29.90
(0.27) (0.41) (0.44) (0.40) (0.34) (0.27) (0.21) (7.71)
0.00 0.07 0.19 0.23 0.21 0.16 0.13 35.26
(0.06) (0.26) (0.39) (0.42) (0.41) (0.37) (0.34) (7.37)
0.00 0.12 0.79 0.06 0.03
(0.00) (0.33) (0.41) (0.24) (0.17)
0.00 0.13 0.87 0.00 0.00
(0.00) (0.33) (0.33) (0.00) (0.00)
(0.44) (0.48) (0.42) (0.33) (2.84)
0.07 0.47 0.31 0.15 3.67
(0.26) (0.50) (0.46) (0.36) (2.61)
0.07 0.50 0.30 0.12 3.45
(0.26) (0.50) (0.46) (0.32) (2.45)
0.06 0.43 0.29 0.22 4.40
(0.24) (0.49) (0.46) (0.41) (3.60)
(0.49) (0.42) (0.47) (0.22)
0.30 0.19 0.47 0.04
(0.46) (0.39) (0.50) (0.20)
0.37 0.16 0.45 0.03
(0.48) (0.36) (0.50) (0.16)
0.35 0.16 0.45 0.02
(0.48) (0.36) (0.50) (0.15)
(0.48)
0.31 (0.46) 156929
0.29 (0.45) 45513 45513
41
Note: The table gives the mean and standard deviations for the main explanatory and control variables for the main samples used in this paper.
Table A.2: Distribution of sample and main outcome variables across surveys Attitudes Country: Year Benin 2001 Benin 2006 Burkina Faso 2003 Burkina Faso 2010 Burundi 2010 Cameroon 2004 Cameroon 2011 Congo Brazaville 2005 Congo DR 2007 Congo DR 2013 Cote d’Ivoire 2011 Ethiopia 2000 Ethiopia 2005 Ethiopia 2011 Gabon 2012 Ghana 2003 Ghana 2008 Guinea 2005 Kenya 2003 Kenya 2008 Lesotho 2004 Lesotho 2009 Liberia 2007 Liberia 2013 Madagascar 2003 Madagascar 2008 Malawi 2000 Malawi 2004 Malawi 2010 Mali 2001 Mali 2006 Mali 2012 Mozambique 2003 Mozambique 2011 Namibia 2006 Niger 2006 Nigeria 2003 Nigeria 2008 Nigeria 2013 Rwanda 2000 Rwanda 2005 Rwanda 2010 Sao Tome and Principe 2008 Senegal 2005 Senegal 2010 Sierra Leone 2008 Sierra Leone 2013 Swaziland 2006 Tanzania 2004 Tanzania 2010 Uganda 2000 Uganda 2006 Uganda 2011 Zambia 2001 Zambia 2007 Zimbabwe 1999 Zimbabwe 2005 Zimbabwe 2010 All surveys
Mean 0.61 0.49 0.74 0.43 0.71 0.56 0.46 0.66 0.78 0.74 0.49 0.79 0.75 0.65 0.56 0.52 0.39 0.88 0.68 0.51 0.50 0.39 0.58 0.47 0.28 0.33 0.37 0.29 0.13 0.90 0.74 0.76 0.54 0.19 0.38 0.71 0.63 0.46 0.37 0.62 0.47 0.55 0.20 0.68 0.66 0.66 0.64 0.24 0.57 0.48 0.76 0.71 0.57 0.87 0.62 0.54 0.49 0.39 0.54
Abuse
Wtd. mean N Mean Wtd. mean 0.61 6187 0.47 17602 0.72 12381 0.44 17055 0.09 0.09 0.73 9355 0.56 10608 0.43 0.42 0.47 15356 0.31 0.31 0.68 6964 0.78 9740 0.56 0.59 0.76 18623 0.37 0.35 0.48 9991 0.22 0.22 0.85 15281 0.81 13361 0.69 16469 0.51 8346 0.32 0.29 0.49 5664 0.37 4883 0.20 0.19 0.88 7776 0.69 8062 0.42 0.44 0.54 8288 0.32 0.31 0.49 7049 0.37 7611 0.62 6763 0.35 0.36 0.43 9212 0.28 7892 0.33 17210 0.36 13089 0.29 11510 0.27 0.27 0.13 22924 0.22 0.22 0.90 12676 0.77 14257 0.19 0.21 0.77 10334 0.26 0.27 0.54 12405 0.21 13650 0.26 0.29 0.36 9617 0.71 9096 0.66 7453 0.44 32563 0.15 0.15 0.35 38352 0.12 0.11 0.64 10338 0.48 11242 0.35 0.36 0.56 13659 0.45 0.46 0.20 2510 0.29 0.27 0.66 14436 0.60 15639 0.68 7030 0.65 16088 0.28 0.29 0.23 4816 0.60 10258 0.54 10038 0.31 0.38 0.77 7204 0.71 8467 0.43 0.42 0.59 8612 0.32 0.33 0.86 7578 0.63 7038 0.41 0.42 0.51 5865 0.48 8858 0.28 0.28 0.40 9142 0.26 0.28 0.54 664473 0.25 0.25
Abuse (ever) N
Mean Wtd. mean
N
9994
0.12
0.12
10003
2567 3986
0.47 0.52
0.46 0.51
2597 4036
2839 5671 4984
0.61 0.52 0.28
0.65 0.51 0.28
2858 5721 5042
4104
0.54
0.50
4209
1829
0.25
0.25
1848
4288 4826
0.43 0.40
0.45 0.39
4323 4847
3866
0.43
0.44
3945
8271 5368
0.27 0.30
0.28 0.30
8279 5373
8822 3096
0.20 0.35
0.22 0.36
8828 3107
5801
0.35
0.37
5859
19033 22103
0.19 0.18
0.19 0.17
19101 22229
2545 3470 1688
0.39 0.57 0.31
0.40 0.58 0.30
2577 3473 1691
4217
0.46
0.48
4286
5670
0.38
0.47
5690
1744 1695
0.59 0.51
0.59 0.52
1746 1713
4216
0.50
0.52
4242
4957 5279 156929
0.36 0.35 0.32
0.37 0.37 0.33
4993 5303 157919
Note: The table gives the mean and standard deviations for the rates of acceptance and abuse across all the surveys used in this paper.
Appendix B: Additional analyses
Table B.1: OLS regressions at the macro level (1) Abuse Education She years of schooling She years of schooling squ. He years of schooling He years of schooling squ. He more education She more education Employment She last 12 months He is unemployed She is breadwinner Attitudes on wife-beating She condones Cluster aggregates Rich
(2) Abuse
(3) Abuse
0.0099*** (0.0020) -0.0010*** (0.00017) 0.0072*** (0.0019) -0.00062*** (0.00013) 0.013* (0.0073) 0.023*** (0.0067)
0.0082*** (0.0026) -0.00069*** (0.00025) 0.0070*** (0.0025) -0.00065*** (0.00015) 0.0093 (0.0097) 0.017* (0.0086)
0.0072*** (0.0018) -0.00071*** (0.00013) 0.0041** (0.0017) -0.00037*** (0.00011) 0.020*** (0.0068) 0.025*** (0.0065)
0.030*** (0.0045) 0.052** (0.021) 0.0057 (0.022)
0.024*** (0.0054) 0.087*** (0.026) -0.0096 (0.022)
0.035*** (0.0046) 0.042 (0.027) -0.018 (0.034)
0.070*** (0.0032)
0.070*** (0.0032)
0.070*** (0.0032)
0.00014 (0.0056) 0.060*** (0.011) 0.019*** (0.0039) 0.033*** (0.0042) 0.0057 (0.0042) Educated cluster -0.00086 (0.0030) 0.000015 (0.00027) -0.0030 (0.0029) 0.00027 (0.00017) 0.0040 (0.011) 0.0067 (0.010) 0.0098 (0.0070) -0.087*** (0.029) 0.00067 (0.030) 0.11 143225
-0.0020 (0.0057) 0.049*** (0.0056) 0.018*** (0.0039) 0.034*** (0.0042) 0.028*** (0.0095) Unequal cluster 0.0018 (0.0023) -0.0000056 (0.00016) 0.00053 (0.0023) -0.000091 (0.00013) -0.013 (0.0092) -0.0068 (0.0093) -0.011* (0.0067) -0.043 (0.032) 0.015 (0.038) 0.11 143225
0.040*** (0.014) High female education 0.049*** (0.0056) High female employment 0.018*** (0.0038) High female acceptance of wife-beating 0.034*** (0.0042) High wealth inequality 0.0057 (0.0041) Cross-level interactions Rich cluster × She years of schooling -0.0017 (0.0024) × She years of schooling squ. 0.00033* (0.00020) × He years of schooling -0.0045* (0.0024) × He years of schooling squ. 0.00030** (0.00015) × He more education -0.0015 (0.0095) × She more education -0.0027 (0.0093) × She last 12 months -0.0016 (0.0067) × He is unemployed -0.051** (0.024) × She is breadwinner -0.030 (0.029) R squared 0.11 N. of respondents 143225
Note: Each column presents an OLS regression of the outcome variable denoted in the column heading. All regressions control control for living in urban areas, age, marital status, the number of children, and religious affiliation. Year and country fixed effects are included in all specifications. The reference category is a woman aged 15-19 with no formal education, married with no children to a partner with the same characteristics, neither Christian nor Muslim, who have not been employed during the last 12 months, and who live in a rural area. * p < 0.10,** p < 0.05, *** p < 0.01.
Table B.2: Other working variables (1) Abuse
(2) Abuse
Sector Professional
0.0016 (0.0092) Clerical -0.039*** (0.014) Sales 0.041*** (0.0043) Self empl. agriculture 0.023*** (0.0050) Employed agriculture 0.075*** (0.0068) Domestic 0.076*** (0.019) Service 0.029*** (0.0084) Skilled manual 0.017*** (0.0060) Unskilled manual 0.056*** (0.010) Work for Family 0.042*** (0.0054) Someone else 0.041*** (0.0059) Self employed 0.037*** (0.0035) R-squared 0.096 0.092 N. of respondents 153242 157674
Note: Each column presents an OLS regression of the outcome variable denoted in the column heading. All regressions control control for living in urban areas, age, marital status, the number of children, and religious affiliation. Year and country fixed effects are included in all specifications. The reference category is a woman aged 15-19 with no formal education, married with no children to a partner with the same characteristics, neither Christian nor Muslim, who have not been employed during the last 12 months, and who live in a rural area. * p < 0.10,** p < 0.05, *** p < 0.01.
45