Resonance Sensor Technology for Detection of Prostate Cancer
Ville Jalkanen
Department of Applied Physics and Electronics Umeå University Umeå, Sweden 2006 1
Department of Applied Physics and Electronics Umeå University SE-901 87 Umeå, Sweden
Thesis for the degree of licentiate of engineering in applied electronics at Umeå University. Vetenskaplig uppsats för avläggande av teknologie licentiatexamen i tillämpad elektronik vid Umeå universitet. ISSN 1653-6789:2 ISBN 91-7264-153-3 © 2006 by Ville Jalkanen Printed by Print & Media, Umeå University, Umeå, Sweden, 2006 2
Abstract
Prostate cancer is the most common type of cancer in men in Europe and the USA. Some prostate tumours are regarded as stiffer than the surrounding normal tissue, and therefore it is of interest to be able to reliably measure prostate tissue stiffness. The methods presently used to detect prostate cancer are inexact, and new techniques are needed. In this licentiate thesis resonance sensor technology, with its ability to measure tissue stiffness, was applied to normal and cancerous prostate tissue. A piezoelectric transducer element in a feedback system can be set to vibrate at its resonance frequency. When the sensor element contacts an object a change in the resonance frequency is observed, and this feature has been utilized in sensor systems to describe physical properties of different objects. For medical applications it has been used to measure stiffness variations due to various pathophysiological conditions. An impression-controlled resonance sensor system was used to quantify stiffness in human prostate tissue in vitro using a combination of frequency change and force measurements. Measurements on prostate tissue showed statistically significant (p < 0.001) and reproducible differences between normal healthy tissue and tumour tissue when using a multivariate parameter analysis. Measured stiffness varied in both the normal tissue and tumour tissue group. One source of variation was assumed to be related to differences in tissue composition. Other sources of error could be uneven surfaces, different levels of dehydration of the prostates, and actual differences between patients. The prostate specimens were also subjected to morphometric measurements, and the sensor parameter was compared with the morphology of the tissue with linear regression. In the probe impression interval 0.5–1.7 mm, the maximum coefficient of determination was R2 0.60 (p < 0.05, n = 75). An increase in the proportion of prostate stones (corpora amylacea), stroma, or cancer in relation to healthy glandular tissue increased the measured stiffness. Cancer and stroma had the greatest effect on the measured stiffness. The deeper the sensor was pressed, the greater, i.e., deeper, volume it sensed. It is concluded that prostate cancer increases the measured stiffness as compared with healthy glandular tissue, but areas with predominantly stroma or many stones could be more difficult to differentiate from cancer. 3
Furthermore, the results of this study indicated that the resonance sensor could be used to detect stiffness variations in human prostate tissue in vitro, and especially due to prostate cancer. This is promising for the development of a future diagnostic tool for prostate cancer.
4
Contents
1. Original papers............................................................................................7 2. Abbreviations..............................................................................................9 3. Introduction...............................................................................................11 3.1 General background ...........................................................................11 3.2 Biological material .............................................................................12 3.2.1 Human tissue types .....................................................................12 3.2.2 Fibers and stroma........................................................................13 3.2.3 Ground substance .......................................................................14 3.3 The prostate ........................................................................................14 3.3.1 Anatomy and physiology............................................................14 3.3.2 Prostate cancer............................................................................15 3.3.3 Detecting and diagnosing prostate cancer ..................................16 3.4 Resonance sensor ...............................................................................17 3.4.1 Piezoelectricity ...........................................................................17 3.4.2 Piezoelectric resonance sensor principle ....................................18 3.4.3 Vibrations in a rod ......................................................................19 3.4.7 Medical applications...................................................................20 3.5 Aims of the study ...............................................................................21 4. Material and Methods ...............................................................................23 4.1 Resonance sensor system ...................................................................23 4.2 Measured sensor parameters ..............................................................24 4.3 Silicone rubber measurements............................................................24 4.4 Prostate tissue in vitro measurements ................................................25 4.5 Morphometric analysis .......................................................................26 4.5.1 Outlining of tumours...................................................................26 4.5.2 Microscopic tissue analysis ........................................................27 4.6 Tissue contribution from various depths – weight vector modeling ..30 4.7 Statistics .............................................................................................32 5. General results and discussion ..................................................................33 5.1 Silicone evaluation .............................................................................33 5.2 Prostate tissue measurements .............................................................33 5.3 Sensor parameters and measured stiffness .........................................37 5
5.4 Measurements and variability ............................................................39 5.5 Future .................................................................................................39 6. General summary and conclusions ...........................................................41 7. Acknowledgement ....................................................................................43 8. References.................................................................................................45
6
1. Original papers
In this licentiate thesis the following original papers are included and referred to by their Roman numerals. Paper I is reprinted with permission from the International Federation for Medical and Biological Engineering (IFMBE). I
Jalkanen V., Andersson B.M., Bergh A., Ljungberg B., and Lindahl O.A., Prostate tissue stiffness as measured with a resonance sensor system: a study on silicone and human prostate tissue in vitro. Medical & Biological Engineering & Computing, 2006. 44(7), pp 593-603.
II
Jalkanen V., Andersson B.M., Bergh A., Ljungberg B., Lindahl O.A. Resonance sensor measurements of stiffness variations in prostate tissue in vitro. Submitted 2006.
Peer reviewed conference publications of relevance, but not included in the thesis, are listed below. •
Jalkanen V., Andersson B.M., Bergh A., Ljungberg B., Lindahl O.A., Resonance sensor for prostate tissue stiffness measurements – detecting prostate cancer, Accepted to the World Congress on Medical Physics and Biomedical Engineering, Seoul, South Korea, 2006.
•
Jalkanen V., Andersson B.M., Bergh A., Ljungberg B., Lindahl O.A., Detection of prostate cancer with a resonance sensor, Proc. of the IFMBE 13th NBC (Nordic-Baltic Conference on Biomedical Engineering and Medical Physics), vol. 9, Umeå, Sweden, 2005, pp 67-68
•
Jalkanen V., Andersson B.M., Bergh A., Ljungberg B., Lindahl O.A., Detektering av prostata cancer med resonanssensor och morfometri?, Proc. of Svenska Läkaresällskapets Riksstämma, Göteborg, Sweden, 2004.
7
•
Jalkanen V., Andersson B., Eklund A., Lindahl O.A., Utvärdering av ny parameter för detektering av prostatacancer med resonanssensor, Proc. of Svenska läkaresällskapets rikstämma, Stockholm, Sweden, 2003, p 242.
•
Jalkanen V., Eklund A., Lindahl O.A., Force and frequency shift from a resonance sensor for detection of prostate cancer, Proc. of the IFMBE World Congress on Medical Physics and Biomedical Engineering, vol. 4, Sydney, Australia, 2003.
•
Jalkanen V., Andersson B., Bergh A., Eklund A., Lindahl O.A., Detektering av förändringar i prostatavävnad mha resonanssensor, Proc. of Svenska Läkaresällskapets Rikstämma, Göteborg, Sweden, 2002, p 231.
•
Jalkanen V., Andersson B., Eklund A., Lindahl O.A., A resonance sensor technique to detect cancer in prostate – model experiments in silicone, Proc. of the IFMBE 12th NBC (NordicBaltic Conference on Biomedical Engineering and Medical Physics), vol. 2, Reykjavik, Iceland, 2002, pp 32-33
8
2. Abbreviations
ANOVA BPH CV MANOVA PSA PZT SD THP TT TURP
Analysis of variance Benign prostatic hyperplasia Coefficient of variation Multivariate analysis of variance Prostate specific antigen Lead zirconate titanate Standard deviation Tumour hit percentage Tissue type Transurethral resection of the prostate
9
10
3. Introduction
3.1 General background The human body is very complex. Its tissues vary in structure and function in different locations in the body (Tortora and Grabowski 2003). Tissues consists of a network of different cells, extracellular fibres and extracellular ground substances that give each tissue its own individual characteristics. The fibres can give a supportive function or an elastic function. The gel-like ground substance binds and supports the fibres and cells. The micro- and macroscopic structure of the cells, fibres and ground substance allow each tissue to show complex and specialized mechanical behaviours (Fung 1981). Changes in tissue composition, consistency and stiffness occur when tissues become diseased. In general, tumours, result from abnormal and excessive cell division and tumours are generally harder than the normal healthy tissue. Therefore tumours can be detected as hard lumps. Both in the female and male, there are examples of this: breast cancer is usually harder than normal breast tissue in the female and prostate cancer is usually harder than normal prostate tissue in the male. Diagnosis of prostate cancer is done by studying the prostate specific antigen (PSA) level in blood, where a high level could indicate a cancer. However, a raised PSA level is not solely due to cancer. It can also be due to benign prostate enlargement (Bergh et al 2005). In addition, rectal palpation, ultrasound examination, and microscopic examination of biopsies are used. However, palpation is not sensitive enough during the early stages of cancer, and most prostate tumours are detected before they can be palpated (Schröder et al 1998). Ultrasound is not sensitive enough to detect tumours, but can be used for guidance of biopsy needles (Tobocman et al 1997). Biopsies are used for exact diagnosis by microscopy, but new complementary methods are needed. A new, non-invasive measurement sensor resembling the human hand and its tactile properties has been developed (Omata and Terunuma 1992). This sensor has the ability to measure stiffness and elastic-related properties of soft materials such as human tissue. The principle is that it measures the change in resonance frequency when a vibrating ceramic rod is put in contact with the surface of an object. Several articles have been written that describe the performance of different types of the sensor in many 11
applications, such as in robotics (Omata et al 2004) but most of all in the medical field. For example, it has been used for eye-pressure monitoring (Eklund 2002, Hallberg 2006), liver stiffness (Kusaka et al 2000), lymph node stiffness (Miyaji et al 1997), myocardial stiffness (Miyaji et al 1998, Miyaji et al 2000), skin elasticity (Lindahl et al 1998, Sasai et al 1999, Sakai et al 2000) and skin hardness (Takei et al 2004). Furthermore, it has been used for measurements of rat prostate stiffness (Omata and Constantinou 1995) and stiffness of fixed human prostate tissue in vitro (Eklund et al 1999). This type of sensor could be used in the future for guiding biopsies, and in conjunction with surgical treatment of prostate cancer. In the latter case, removed prostate tissue could be scanned for the presence of cancer in the prostate and for the spreading of the cancer through the prostate capsule. This licentiate thesis describes the evaluation of resonance sensor measurements of stiffness on prostate tissue in vitro. It explains how a commercially available resonance sensor system was used in the experiments to evaluate the sensor technology’s possibility to measure stiffness for detecting prostate cancer. The measured stiffness variation was explained by prostate tissue morphology.
3.2 Biological material 3.2.1 Human tissue types All organisms are made up of a collection of different tissues. Each tissue is made up of a collection of cells and the substance that surrounds them, and each tissue has one or more specific functions or tasks. An organ (e.g., a kidney), is made up of a group of tissues which have related physiological functions. A tissue can vary from being hard (bone), semisolid (fat), or even liquid (blood) in its consistency (Tortora and Grabowski 2003). The structure and properties are based on the type and arrangement of the cells, as well as on the materials found between the cells. Tissues are classified into four major types: muscle, nervous, epithelial, and connective tissue, and there are several subdivisions within each category. Muscle tissue consists of specialized cells that generate a physical force and thereby cause movement when suitably stimulated (Tortora and Grabowski 2003). Different types of muscle tissue are found in different places in the body. Skeletal muscle can be found attached to the bones. Smooth muscles build up the blood vessel wall, the outer, muscular layer of the gastrointestinal tract, and parts of several other organs. Cardiac muscle is only found in the heart.
12
Nervous tissue is composed of neurons (nerve cells) and special types of cells that support and protect the neurons. Nervous tissue detects changes in the external and internal body environment (Tortora and Grabowski 2003). Epithelial tissue is considered to occur in two different types (Tortora and Grabowski 2003). One is the covering and lining type, where one or several layers of cells cover body surfaces (e.g., the skin), line body cavities (e.g., the peritoneum) or line ducts (e.g., blood vessels). The other type is the glandular epithelium, where a single cell or a group of cells constitute glands that secrete substances into a lumen (ducts), onto surfaces, or into the blood. Epithelium has many roles in the human body such as protection, filtration, secretion, absorption and excretion. Connective tissue is by far the most plentiful of the body’s tissues, and it is widely distributed throughout the human body. There are several different types of connective tissue cells (e.g., fibroblasts). The substance which surrounds these cells, and is secreted by these cells, is called the extracellular matrix and consists of extracellular fibers and a ground substance (Tortora and Grabowski 2003). Each different type of connective tissue has its own matrix components. Some can be loosely woven fibers found around and between organs, while others can be either irregularly woven fibres (for protection around organs) or regularly dense fibres (ligaments and tendons). Connective tissue protects, supports, and binds together other tissues and organs. Other types of connective tissue are blood, lymph, bone and cartilage.
3.2.2 Fibers and stroma There are three different types of protein-based fibers in the connective tissue matrix and these are the collagen, elastic, and reticular fibers, which give the strength and supportive properties to the connective tissue (Tortora and Grabowski 2003). Collagen fibers are very strong, but not stiff and thereby provide flexibility. They are found in most types of connective tissue and are arranged in parallell to each other in bundles. Collagen is a protein and represents 25% of the total protein content of the body. Elastic fibers are smaller in diameter than collagen fibers and form a network within a tissue. They are strong but very flexible and give the tissue its elastic properties. Elastic fibers are made of the protein, elastin, surrounded by a glycoprotein called fibrillin (Tortora and Grabowski 2003). Reticular fibers consist of the protein, collagen, with a coating of glycoprotein and are much thinner than collagen fibers. They provide support in the walls of blood vessels and form networks around the cells in some tissues such as adipose tissue and smooth muscle tissue. Reticular connective tissue, composed of reticular fibers, forms a supporting 13
framework in and around an organ, gland, or other structure (Tortora and Grabowski 2003). This supporting framework is called stroma.
3.2.3 Ground substance The ground substance is a hydrophilic gel which exists together with the fibres in the spaces around the connective tissue cells. (Fibres and ground substance together are referred to as matrix.) The gel contains mostly water, but also different chemical compounds such as polysaccharides and adhesion proteins which give it a viscoelastic behaviour. The polysaccharides, also referred to as glycosaminoglycans, include hyaluronic acid that gives the gel-like consistency to the ground substance. The adhesion proteins attach the cells, fibers and ground substance together.
3.3 The prostate 3.3.1 Anatomy and physiology The prostate is a gland in the male reproductive system. It is of the size of a golf ball, doughnut-shaped, and is located under the urinary bladder and surrounds one section of the urethra, i.e., the prostatic urethra (Tortora and Grabowski 2003). (Fig. 1.) The gland contains glandular epithelium, smooth muscle tissue and connective tissue. The smooth muscle and connective tissue together are referred to as the prostatic stroma, and are a relatively dense (hard) tissue due to the relatively dense packing of the smooth muscle cells, connective tissue cells and extracellular fibres. The prostate secretes a fluid substance that contributes to sperm motility and the fluid enters the prostatic urethra via many prostatic ducts. Prostate specific antigen (PSA) is one of the substances in this fluid (Tortora and Grabowski 2003). Prostate stones (corpora amylacea) are found in the prostate gland of normal, healthy men. The stones are found in the lumens of the prostate glands and consist of solidified prostate gland secretion. They are quite dense (hard) as compared to the other tissues around them in the prostate.
14
Figure 1. The male anatomy. Image from http://en.wikipedia.org/wiki/Prostate.
3.3.2 Prostate cancer Cancer is a type of disease which is characterized by uncontrolled cell division. The newly developed tissue is called a tumour or neoplasm and can either be cancerous or harmless (Tortora and Grabowski 2003). The cancerous and often fatal tumour is also called a malignant tumour, and the harmless tumour is called a benign tumour. Around the age of 60, one-third of all men can suffer from an enlargement of the prostate. The medical term for this type of tumour is benign prostatic hyperplasia (BPH). If the prostate grows too much it could constrict the urethra which it surrounds, and thereby reduce or even completely stop, the flow of urine, thereby causing discomfort and pain with urination (Tortora and Grabowski 2003). Malignant tumours of the prostate, or prostate cancer, and benign prostate enlargement (BPH), have similar symptoms (American Cancer Society 2006). Malignant tumours have the property of metastasizing, i.e., spreading to other parts in the body. The cancer can invade and damage tissues locally -- often the bladder or the rectum. Cancerous cells can also be transported to other parts of the body via the blood or lymphatic systems. The lymphatic 15
system produces, stores and carries white blood cells, and has the function to fight infections and diseases (Tortora and Grabowski 2003). When the cancer has metastasized it is often found in the lymph nodes and from there it can be transported to other organs in the body. Prostate metastases seem to attach and grow most readily in bone tissue. Prostate cancer is the most frequently diagnosed cancer of men in the US and the leading cause of cancer death in men in the US (American Cancer Society 2006). In Sweden it is also common and represents one third of all male cancer types and it is becoming increasingly more common (Bergh et al 2005). About 2500 men die of prostate cancer each year in Sweden. The cause of prostate cancer is not fully understood, but there are some factors that increase the risk. Old age is a certain risk factor as well as the family history (Bergh et al 2005, American Cancer Society 2006). Ethnicity and the diet also have some influence. The disease is common in North America and north-western Europe, while rare in Asia and South America.
3.3.3 Detecting and diagnosing prostate cancer Tests that can verify the existence of prostate cancer are digital rectal examination, where harder or lumpy areas can be sensed by palpation, and the blood test for PSA (Tortora and Grabowski 2003). However, PSA is not cancer-specific (Bergh et al 2005). Prostate cancer, BPH and prostate infection, all increase the amount of PSA found in the blood. Most cancer tumours are detected with PSA before they can be palpated (Schröder et al 1998). A tumour is diagnosed by taking ultrasound-guided biopsies. However, as most tumours are not palpable and not detectable by ultrasound (Tobocman et al 1997, Aarnink et al 1998), there is no reliable way to direct the biopsies to suspicious areas of cancer. Therefore ultrasound-guided biopsies are taken at random and a tumour might easily be missed as the volume of a biopsy is 1/1000 of the prostate volume (Bergh et al 2005). The biopsies are examined by microscopy in order to find cancer cells and if such are present the Gleason grade is determined (ranges from 1 to 5) (Bergh et al 2005). This grade is based on the pattern of glandular differentiation. At different locations in the tumour the cancer can differ and therefore grades are given to them too. The dominant and secondary pattern grades are added to result in the Gleason score (ranges from 2 to 10). A low value indicates a cancer tumour that grows slowly and will probably not spread as much as one with a higher value. A high value indicates a more aggressively growing tumour. The treatment of prostate cancer includes hormonal therapy, chemotherapy, radiation, and/or surgery. Hormonal treatment, chemotherapy and radiation are used for both metastasized prostate cancer and as supplemental treatments during an early-stage of the disease (American 16
Cancer Society 2006). A benign enlarged prostate can be treated by transurethral resection of the prostate (TURP), where pieces of the inside of the prostate are removed through the urethra. Radical prostatectomy, where the whole prostate is removed, is the surgical treatment of prostate cancer in the gland (Bergh et al 2005). From this surgery, microscopic examinations of the whole prostate can be done.
3.4 Resonance sensor Resonance sensors utilize the resonance frequency of a mechanical, acoustical or electrical structure to relate to a physical property of interest (Khazan 1994). In this thesis the resonance sensor is based on the principle of piezoelectric resonance, in which a piezoelectric element is set to vibrate with an electronic driving circuit.
3.4.1 Piezoelectricity Piezoelectricity is an electromechanical interaction between electrical and mechanical systems and was discovered in 1880 by the Curie brothers (Ikeda 1990). Piezoelectric materials are used in conversion of electrical and mechanical energy and have found a wide variety of applications (Waanders 1991), especially as transducers. The direct piezoelectric effect is when an electric polarization (Hook and Hall 1991) is produced by mechanical stress on a piezoelectric material. The inverse effect is when the same material is mechanically strained when an electric field is applied (Ikeda 1990). Piezoelectricity results from a non-uniform charge distribution within the unit cell of a crystal, i.e., an electric dipole (Hook and Hall 1991). When such a crystal is mechanically deformed, the positive and negative charge centres displace by differing amounts. So while the overall crystal remains electrically neutral, the difference in charge centre displacements results in an electric polarization within the crystal. Naturally occurring piezoelectric crystalline materials are quartz and tourmaline, but others include Rochelle salt and ceramic materials. Barium titanate and lead zirconate titanate (PZT) are piezoelectric ceramics (Waanders 1991). The piezoelectric ceramics obtain the non-symmetric structure, and thereby the dipole, below the Curie temperature. When exposing the ceramic to a strong electric field and just below the Curie temperature, the dipole domains in the crystal structure are aligned in the direction of the field. When the field is removed, the dipoles are locked, and thereby a remnant polarization and a permanent deformation remain (Waanders 1991). 17
3.4.2 Piezoelectric resonance sensor principle From now on when the term resonance sensor is used, it refers to the sensor principle based on piezoelectric resonance technology. The principle of the resonance sensor technology was introduced by Professor Sadao Omata (Omata 1990, Omata and Terunuma 1992). In summary, the sensor consists of a piezoelectric transducer element, made of PZT. The transducer is divided into two parts, one for producing an oscillation (driving element) and the other for detecting the vibration (pick-up element). The detected vibration is fed to an electronic feedback circuit. (Fig. 2.) Feedback circuit Driving element
Pick-up
BP filter
Amp.
Figure 2. The resonance sensor element consists of the driving element and the pickup. The resonance sensor element is set into oscillation by a feedback circuit which consists of band pass filter (BP filter) and an amplifier (Amp.).
The whole system, i.e., the PZT transducer and the feedback circuit (amplifier and phase shift circuit), oscillates with a frequency that is determined by the phase-frequency characteristics of the PZT transducer and the feedback circuit. Resonance is established when the zero phase shift condition is fulfilled, i.e., the sum of phase shifts in the whole system is equal to zero, and this is done by the phase shift circuit (Omata et al 2004). This means that the phase shift circuit determines the oscillation frequency regardless of the gain properties of the PZT element (Murayama et al 2005). The oscillation frequency is chosen close to the inherent frequency of the PZT transducer to obtain maximum sensitivity. When the PZT transducer touches an object, the oscillating frequency changes (Omata and Terunuma 1992). The resulting change in frequency of the system, f, depends on the physical properties of the measured object (Omata and Terunuma 1992, Omata et al 2004), the contact area (Eklund et
18
al 1999), and the phase-frequency characteristics of the PZT transducer and feedback circuit. For soft objects, i.e., objects that are deformed by pressure, such as silicone or human skin, a negative f is obtained, whereas a positive f is obtained for non-deformable hard objects such as nails, teeth, or metals (Omata and Terunuma 1992, Omata et al 2004).
3.4.3 Vibrations in a rod The change of resonance frequency of a vibrating rod is related to the acoustic impedance of the object, and the behaviour of the resonance sensor can be described approximately with the theory of vibration modes in a finite rod. The sensor theory originates from earlier studies on an ultrasonic hardness tester and contact impedance (Kleesattel and Gladwell 1968a, Kleesattel and Gladwell 1968b, Kleesattel and Gladwell 1969) and was later used to describe the behavior of the piezoelectric resonance sensor (Omata 1990, Omata and Terunuma 1992). The behaviour of the oscillating rod can be described with the wave equation theory of vibration modes in a finite rod. The change in resonance frequency is related to the acoustic impedance of the contacting object according to ∆f = −
v0 β 2π l Z 0
(1)
where l is the length of the PZT element, where v0 is the equivalent velocity and Z0 is the acoustic impedance of the PZT element. is the reactance part of the unknown impedance, which can also be written in the imaginary form Z x = α + jβ where as
(2)
is the acoustic resistance. The reactance part may further be written
β = m xω −
kx
ω
(3)
where mx is the inertia term, kx the stiffness term (or inverse compliance) and ω is the angular frequency. The inertia and stiffness terms can be written as
19
ρ S3 2 mx = 10 (1 − ν )
(4)
and kx =
2E
S1 2
π 1 2 (1 − ν 2 )
(5)
respectively. In the above equations E is Young’s modulus, is the Poisson’s ratio, and is the density of the object and S is the contact area. From the equations above it can be concluded that the change in resonance frequency, when the sensor is applied on a surface of an object, will depend on the impedance Zx and the contact area. The area in turn is dependent of the applied pressure, which indicates that at constant pressure the measured material would govern the size of the area. Therefore, the frequency change will measure hardness (Omata 1990, Omata and Terunuma 1992). The impedance also depends on different physical material properties, which are in some way related to stiffness or hardness and softness. The propagating sound wave in the object will be affected both by the reactance part, and the attenuation of the wave in the material will be affected by the resistance part. The resistance will cause small losses.
3.4.7 Medical applications It has been shown that the resonance sensor is able to sense hardness and softness like the human hand (Omata 1990, Omata and Terunuma 1992) and therefore it has been used in a variety of medical applications for its tactile properties. The resonance sensor technique has been used for assessment of hormone-induced testis oedema in rats and measurements of hardness/softness in silicone rubber (Lindahl and Omata 1995). Measurements on skin can detect differences in stiffness and elasticity (Lindahl et al 1998). The change in frequency at constant pressure is significantly correlated with the parameters specific to the properties of skin lesions (Sasai et al 1999) and of the physical properties of stratum corneum layer of skin (Sakai et al 2000). It was shown to quantitatively measure skin sclerosis and may help in determining therapeutic treatment efficacy (Takei et al 2004). The technique has been used and developed further for measurement of intraocular pressure (IOP) in a pig-eye model and thereafter on patients. In
20
both situations a high correlation is found between the measured parameter and the actual IOP (Eklund 2002, Hallberg 2006). Myocardial stiffness has been shown to be dependent upon regional myocarial function due to pathological changes (Miyaji et al 1998) and reduced coronary blood flow (Miyaji et al 2000). Further studies could expand the clinical applications from cardiac operation to cardiac catheterization to evaluate regional changes in contractility in patients with ischemic heart disease. Tactile sensor measurements, based on the resonance sensor principle, have shown that muscle stiffness correlates with muscle tension and could be used to evaluate muscle fatigue in situ without measuring muscle tension (Inaba et al 2000). The time course of a muscle contraction and relaxation can be monitored by tactile stiffness (Inaba et al 2001). The technique can be used to detect the increased stiffness of lymph nodes containing metastases (Miyaji et al 1997) and liver stiffness as an indication of liver fibrosis (Kusaka et al 2000). The technique has proven to be valuable for detecting pulmonary tumours (Ohtsuka et al 1995). Small nodules, not visible at the lung surface, are successfully located using the sensor. Variations in bladder wall stiffness of the rat can be a tool for evaluating bladder and prostate biomechanics (Watanabe et al 1997). In another study a counterbalance resonance sensor system has been used to measure the stiffness of prostate tissue in a rat model (Omata and Constantinou 1995). It was shown that the sensor is sensitive enough to differ between normal soft rat prostate tissue and rat prostate tissue whose stiffness had been affected by hormonal treatment. A catheter-type counter balance resonance sensor has been used to investigate the hardness of fixed prostate tissue in vitro (Eklund et al 1999), and the measured relative hardness is well correlated with the proposed hardness related to the histological composition of the prostate.
3.5 Aims of the study The general aim was to evaluate a resonance sensor system for soft tissue stiffness measurements and to study its possibilities for detection of abnormal tissue, such as prostate cancer in prostate tissue in vitro. The specific aims of this thesis were: • To study if a resonance sensor system, Venustron®, could be used for prostate tissue in vitro stiffness measurements and if possible, to differentiate between cancer and normal tissue.
21
• To investigate if the stiffness variations of fresh prostate tissue measured by the resonance sensor could be related to the morphology of the prostate tissue, i.e., to the presence of cancer and other morphological anomalies such as prostate stones.
22
4. Material and Methods
4.1 Resonance sensor system In both Paper I and Paper II, a commercially available resonance sensor system, Venustron (Axiom Co., Ltd., Koriyama Fukushima, Japan) was used in the measurements. This resonance sensor system consisted of a piezoelectric resonance sensor element for measuring resonance frequency, a force sensor and a position sensor. All were arranged in a motorized mounting attached to a stable stand and connected to a computer (Fig. 3). The Venustron® hardware unit included the driving electronics, power supply, and the central processing unit (CPU) for communication with the sensors in the sensor probe (Fig. 3). A linear XY-precision positioning stage (Parker Hannifin Corporation - Daedal Division, Irwin, PA, USA) was used for precision movement in the horizontal plane of the measured object.
Figure 3. The experimental setup of the Venustron® (sensor probe 1 and electronics 2) together with a laptop PC (3) and a linear XY-positioning stage (4).
During a measurement, the hemispherical shaped sensor tip (5 mm in diameter) was lowered towards an object with the motor. The resonance frequency change (∆f), the force (F), and the impression depth (d) were 23
sampled at 200 Hz during the impression of the sensor tip. The sensor was set to perform an impression down to a maximum of 2 mm at an impression speed of 1 mm s-1. Data were saved on a file with Venustron software and post processed in Matlab® (MathWorks Inc., USA).
4.2 Measured sensor parameters The resonance sensor outputs, f and F, from the impression process were combined together into one parameter, the frequency change at a constant force ( fF). fF has been used in many of the applications with the resonance sensor, as the sensor has been applied with a constant force against the measured objects (Eklund et al 1999). This has been realized by using counterbalance equipments. In this study (Paper I) fF was calculated by choosing the lowest force from the considered measurements at a certain impression depth, i.e., min(Fd). This force was then used as the constant force at which the frequency change was interpolated, fF = f(min(Fd). From f and F a parameter, f/ F, was obtained to describe the measured stiffness (Paper I and Paper II). It was calculated via the respective derivatives of f and F with respect to d. Each derivative was estimated numerically by linear regression in an interval around the specified impression. The interval, 0.2 mm, consisted of 10% of the samples in the total impression of 2.0 mm. Both measured parameters were calculated at each specific depth, d, from 0.1 to 1.9 mm in increments of 0.1 mm during the time when the sensor probe was advanced into the measured object.
4.3 Silicone rubber measurements In the evaluation of the Venustron®, silicone rubber was used (Paper I). Previous studies have shown that a resonance sensor is able to detect stiffness variations in silicone rubber (Lindahl and Omata 1995, Lindahl et al 1998, Eklund et al 1999). The silicone samples used were prepared from a two-component silicone mixture, Wacker SilGel 612 (Wacker-Chemie GmbH, München, Germany). The two components were poured together and mixed in Petri dishes. The stiffness of the silicone can be varied by different proportions of the two components, and the mixture cures at room temperature. The manufacturer provides penetration values in mm×10-1 (DIN ISO 2137, hollow cone 150 g), where a high value indicates a soft object. Together with these, recalculated
24
values (Eklund et al 1999) were used to estimate penetration values for new mixtures (Paper I). A thin layer of aluminum oxide powder (Buehler, Lake Bluff, IL 60044, USA) was applied on the surface of the silicone to prevent the sensor from sticking to the surface. Ten measurements for reproducibility were made on each of seven silicone mixtures (Paper I).
4.4 Prostate tissue in vitro measurements In this study in vitro prostate tissue measurements (Paper I and Paper II) were conducted at the Department of Medical Biosciences, Pathology unit, at Umeå University. The participating patients gave informed written consent and the study was approved by the institutional review board and the Ethics Committee of Umeå University. Measurements were made on ten samples of fresh human prostate tissue from 10 male patients (median age 59 years, range 46 – 69 years) undergoing radical prostatectomy for prostate cancer. For each prostate sample the following procedure was followed: After surgery the prostate was transported on ice to the Pathology unit. The surface of the prostate was inked for the purpose of orientation and the tissue was cut in slices in the horizontal plane for routine histopathological diagnosis. Before fixation in formalin one of these sections (approximately 10-15 mm thick) was measured for variations in tissue stiffness with the Venustron® (Fig. 4). During measurements the tissue slice was pinned down on Styrofoam and kept moist with regular application of physiological saline solution. The saline solution was applied with a brush onto the spot before each measurement. At every fifth measurement (6–8 min) the edges of the tissue were brushed to maintain overall moistness. Reference markings were marked on the Styrofoam plate and thereafter a picture was taken with a digital camera. The positions of the reference markings on the Styrofoam and the measurement points on the tissue surface relative to the sensor tip were controlled with the linear XY-precision positioning stage. Twelve to nineteen measurement points were studied on the surface of each prostate slice, and on 4–6 of these measurement points, five additional measurements were performed to study reproducibility. The reason for only taking 4–6 of the measurement points was to minimize total measurement time so that the prostate slices were not damaged for routine histopathological diagnosis. The time between the repeated measurements on the same measurement point averaged 6 min. After the measurements the tissue section was fixed in formalin and embedded in paraffin. 25
Figure 4. Two views of the Venustron® sensor probe tip and prostate tissue slice during an in vitro measurement session. The tissue slice was pinned down with needles onto the Styrofoam plate. The scales with numbers are in millimetres.
Measurements across the surface on the prostate tissue were based on a measurement matrix (Paper I, Fig. 2(b)). The distance between adjacent measurement points in the measurement matrix was either 5 mm (small prostates) or 7.5 mm (larger prostates), centre to centre. Measurements were performed so that the viscoelastic effects of the impression of the probe into the tissue of adjacent measurements were minimized. This was implemented so that two consecutive measurement points were never adjacent to each other (Paper I).
4.5 Morphometric analysis 4.5.1 Outlining of tumours In Paper I the following procedures were followed to determine the amount of cancer present in each prostate slice. From the paraffin tissue block the most superior and complete 5- m thick section was taken from the surface of each of the ten tissue samples for morphometric examination. Using stereological methods information about the tissue type under the measuring probe tip (a circle with diameter of 0.5 cm) was determined using a light microscope, as described earlier (Eklund et al 1999). For each patient, the location of malignant tumour tissue (as opposed to non-malignant prostate tissue) was marked on the glass slide on which the tissue section was placed (Fig. 5). The Gleason scores were 6–7 (grading 3+3 and 3+4) for the tumours in the ten prostate tissue samples. 26
Figure 5. A 5- m prostate tissue section with the outlining of malignant tumours together with the estimated locations of measurements (circles with diameter of 5 mm). The centre-to-centre distance between measurement points was 7.5 mm in this specific section. The orientation of the prostate in the human body is marked with left, right, and back.
Coordinates of the reference markings on the Styrofoam plate and coordinates of the measurement points were used to achieve the right scaling in order to locate the measurement points on the digital photograph. Then the coordinates were transferred with the right scaling onto the glass slide with the 5- m thin sections (Fig. 5). The tumour hit percentage (THP), i.e., the relative amount of the crosssectional area of the sensor tip that hit tumour tissue, was estimated for all measurement points across all ten prostates (Paper I). For example, a THP 50% meant that at least 50% of the cross-sectional sensor tip area hit tumour tissue. A THP = 0% meant measurements on normal tissue. Measurements on tumour with THP = 100% and THP 50% were analysed whereas THP = 0 to 50% were excluded from the analysis (Paper I).
4.5.2 Microscopic tissue analysis A detailed morphometric analysis, for estimating the tissue content in the measured prostate tissue slices, was done on two prostate specimens (Paper II). The following procedure was performed for the paraffin-embedded prostate tissue samples: Holes (diameter 1 mm) were drilled in the paraffin 27
tissue block to obtain reference points for all the 5-µm thick sections cut from it. These orientation holes were placed close to the perimeter of the tissue block to avoid locations for possible measurements. A few 5-µm sections were removed from the surface of the tissue block if the surface was not completely flat. Thereafter 5-µm thick sections were taken at various depths from the tissue block surface: at 0 (the top, first complete slice), and at 1, 2, and 3 mm below the surface. The tissue was stained with hematoxylin-eosin (Bancroft and Stevens 1996) according to routine histopathological procedures. Coordinates of reference markings and measurement points were used to locate the measurement points on the photographs. They were then rescaled to the glass slide with the 5-µm sections. For each section, the tissue composition under the sensor tip (a circle with diameter 5 mm) was determined for all measurement locations. Here the drill holes were utilized to find measurement points corresponding to each other on all the sections. Photographs were taken with a camera (Olympus DP50, Olympus Sverige AB, Sweden) mounted on a light microscope (Olympus BX51, Olympus Sverige AB, Sweden). Thereafter the images were analysed by using a grid system (Paper II), which is illustrated in Figure 6.
Figure 6. Illustration of part of the grid used for estimating tissue proportions from an analysis area of a circle with 5-mm diameter. A total of 888 cross-sections in the grid were classified to a specific tissue type. Magnification is ×4 and seven squares equal 1 mm.
At each cross-section in the grid, the tissue type (TT) was recorded as epithelium, lumen, stroma, prostate stones (corpora amylacea), inflammation, cancerous epithelium or cancerous lumen. Thereafter the tissue type was coded, typed into a text file, and read into the computer. The proportion of each tissue type at each measurement point and at each section was determined (Paper II).
28
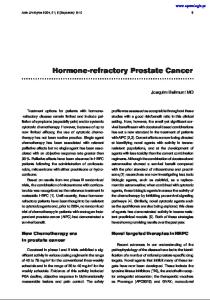
A total of 136 locations were analysed with an analysis time of approximately two hours for each, including the time for locating and marking the tissue sections, the photography with the microscope, and the input into the computer. Figure 7 shows the appearance of the different TTs. Figure 8 shows a prostate cancer tumour and Figure 9 shows a more complex prostate morphology.
stone stroma
lumen epithelium
Figure 7. Illustration of non-cancerous portions of prostate demonstrating prostate stone, stroma, prostate gland lumen and gland epithelium. Seven squares equal 1 mm.
Figure 8. The majority of the glandular tissue shown here is cancer. The centrally located tumour (purple color) is surrounded by stroma (pink color) and more cancer toward the corners of the figure. The 14 squares equal 2 mm.
29
Figure 9. A complex pattern of prostate morphology including both normal glandular tissue (purple, arrows with triangle) and cancerous tissue (purple, arrows with dot). This illustrates the diversity of the tissue. The 14 squares equal 2 mm.
4.6 Tissue contribution from various depths – weight vector modeling In Paper II different tissue types, TT, at measurement locations were determined, and this was done on several sections obtained from different depths from the surface of the tissue block. The contributions from the different depths were analysed by giving varying numerical weights to the different sections by using weight vectors. The proportion of a tissue type, pTT, obtained from the circular grid of ith measurement point and jth tissue section was p TT (i,j ) =
nTT n total
(6)
where nTT was the number of cross-sections of tissue type TT in the grid and ntotal = 888, the total number of cross-sections in the grid. Glandular tissue is composed of epithelium and lumen, therefore the following simplifications were done: pgland = pepithelium + plumen and similarly for cancerous glands, pcancer 30
= pcancerous epithelium + pcancerous lumen. Furthermore it was assumed that pstroma = pstroma + pinflammation. The pTT(i, j) for stone, stroma, and cancer, for measurements i = 1, 2, …, n and for sections j = 1, 2, …, 4 are given by the tissue proportion vector
[
p i , j = p stone(i, j )
p stroma (i, j )
p cancer(i , j )
]T (7)
and these vectors built up the column vectors of the tissue proportion matrix
[
Pi = p i ,1
p m, 4
]
(8)
The contribution of tissue at the jth section from the tissue block was modelled by numerically weighting the pTT(i,j) value by a weight wj, i.e., wjpTT(i,j). A weighting vector with weight values for each section j = 1, ..., 4 is given by w = [w1
w2
w4 ]T
(9)
Two different weight vectors w were evaluated in this study (Paper II). The elements of the first w(1) was modeled as w(1)j = c exp(-k j) and for the second w(2) as w(2)j = c (1 – k (j –1)), where c = 1/4 (1/(number of sections)), and k = 0, 0.05, 0.1, …1.5. When k = 0 both weights become the constant weight for all j, while an increase in k gave decreased weight to the deeper sections (higher j). The weighted tissue proportion vector for the ith measurement is the column vector p iw =
Pi w wj
(10)
j
The sum of tissue proportions equalled one (=1) for every measurement i at every j, and to obtain this when using w, the weighted tissue proportion vector was divided by the sum of the elements in w (equation (10)). A predictor matrix X was set as the following with the first column consisting of ones and the rest being the weighted tissue type proportion vectors for each measurement i
31
1 p1w
T
w X = 1 p2
T
1 pw n
T
(11)
This predictor matrix was then used in the regression model Y = X + , where Y is the response variable matrix of the sensor parameter, is the coefficient vector, and is the random error (Paper II). The model control parameter, coefficient of determination (R2), was calculated for the model at each d and k.
4.7 Statistics Values are expressed as mean ± standard deviation (SD). Reproducibility of measurements was presented with coefficient of variation (CV (%) or SD relative to the mean) of the measured parameters. Pearson’s correlation coefficient was used for correlation analysis (Paper I and Paper II). Analysis of variance (ANOVA) test followed by Tukey’s multiple comparison test on the measured parameters, was used to test for differences between groups. To test differences between tumour and normal tissue, a one-way multivariate ANOVA (MANOVA) (Johnson and Wichern 2002) was used on the multivariate data, when considering both measured parameters together (Paper I). Multiple linear regression (Tamhane and Dunlop 2000) was used to analyze the relation between the sensor parameter and tissue composition (Paper II) and thereby solving the least-squares problem Y = X + . Residual analysis was used for model validation (Tamhane and Dunlop 2000). Using the square root as a transformation, the constant variance and normality assumptions were justified (Johnson and Wichern 2002). A multivariate test of normality was done in Paper I according to Johnson and Wichern (2002). A p-value of less than 0.05 was considered statistically significant for all tests.
32
5. General results and discussion
5.1 Silicone evaluation Silicone rubber has been used in previous studies to evaluate resonance sensors for stiffness and hardness measurement (Lindahl et al 1998, Eklund et al 1999). Measurements on silicone rubber samples showed that the Venustron® could differentiate (p < 0.05) between different degrees of stiffness measured by fF and f/ F with good reproducibility (Paper I). This is promising for prostate tissue in vitro studies. However, silicone rubber is a simple material as compared with prostate tissue, which can vary in composition of the different tissue types and level of dehydration.
5.2 Prostate tissue measurements In Paper I, results from stiffness measurements on ten prostate tissue specimens showed that there were differences between tumour tissue and normal tissue. The f/ F was normalized by using (| f/ F|). Tumours (THP = 100%) were significantly harder than normal tissue (THP = 0%) at the higher impression depths (d = 1.6 – 1.9mm) as indicated by (| f/ F|), while ∆fF could not show any significant difference. However, ∆fF indicated that THP = 100% were significantly softer than THP = 0% at d = 0.6 – 1.1mm, but the higher impression depths were considered more interesting because they were closer to full contact. When considering the multivariate parameter set, at each of d = 1.0 – 1.9mm, a highly significant (p < 0.001) difference was found between THP = 100% and THP = 0%, regardless of tumour stiffness (Fig. 10). If increasing the size of the tumour group, i.e., considering THP 50 %, the significance was lowered for the multivariate analysis and the measured parameters could not show any significant differences individually. This was expected because the additional measurements had THP = 50 to 100%, i.e., less contact with tumour tissue. Reproducibility was shown to be high with low SD and CV values for (| f/ F|) at d = 1.9mm. ∆fF had higher CV. Compared to the variation in
33
the tumour and normal tissue groups, the variation due to reproducibility was much lower (Paper I). 0 −50
F
∆f (Hz)
−100 −150 −200 −250 −300 0
THP = 0% THP = 100% THP ≥ 50% 20
40
60 80 100 √(|∂∆f/∂F|) (√(Hz/N))
120
140
Figure 10. The measured parameters fF and f/ F for normal (THP=0%) and tumour tissue (THP=100% and THP 50%) shown at impression depth of 1.5mm (Paper I).
The analysis of prostate tissue in vitro shows that there are variations in stiffness between tumour tissue and normal tissue (Paper I). There are probably also variations between patients. The level of dehydration among the prostates might also influence the results, less fluid giving less contact with the sensor tip and thereby decreasing the f. Uneven amounts of saline solution would probably affect the contact area due to capillary attraction of the fluid film. Another source of error is the unknown contact area due to the irregular surface of the prostate tissue specimen. Variations within normal and tumour tissue are not surprising as the tissue composition in the prostate is highly variable. For example, there are variations in the amount of epithelium, stroma and prostate stones, and such variations have previously been shown to affect tissue stiffnes measured in fixed prostate tissue (Eklund et al 1999). It was shown that stroma and prostate stones gave a lower frequency, i.e., harder areas, than glandular tissue. The Gleason score varied marginally (6 or 7) and was therefore not a subject for further analysis in this study (Paper I). Recently, Phipps et al made measurements with a mechanical shaker and related the mechanical characteristics to the morphology of benign (Phipps et al 2005a) and malignant (Phipps et al 2005b) prostate tissue in vitro after TURP. Stroma showed a greater stiffness than epithelium. Malignant epithelium was less viscous than benign epithelium, and this was due to the 34
acinar gland lumen being smaller. However, no difference in stiffness was found. Furthermore, samples of predominantly stroma were excluded. It is important to note that the morphometrical investigation was done on a single 5- m superficial cut section from the prostate sample section, which means that the distribution of tumour and normal prostate tissue deeper in the tissue section was not considered. However, it is assumed that the superficial section indicated the presence of larger tumour areas and was thereby representative for the analysis (Paper I). Paper II studied the question about how the tissue content influences the stiffness measured by the resonance sensor in fresh prostate tissue. In addition, the paper studied how deep into the tissue the sensor could detect difference in tissue stiffness. The tissue proportions were modeled with the tissue proportion vector according to equation 7 and a predictor matrix according to equation 11. The model Y = X + was solved with multiple linear regression. A resulting R2 was obtained for the model of each pair of impression depth d and k. An example is shown in Figure 11. Similar shapes were obtained when studying the sensor parameter at each d. Deeper tissue layers were weighted less in the resulting model as suggested by the maximum R2 for a k > 0. The maximum R2 = 0.635 among all d was obtained at d = 1.7 mm, k = 0.5 when using weight w(1). For w(2) maximum R2 = 0.632 was obtained at d = 1.7 mm, k = 0.2. 0.64 0.63 (1)
w
0.62
(2)
R
2
w
0.61 0.6 0.59
0
0.5
k
1
1.5
Figure 11. The R2 values for the model with both weight vectors for increasing k. The sensor parameter was calculated at d = 1.7 mm. (Paper II)
The two types of weight vectors were studied to investigate the dependence of deeper tissue sections. Figure 12 shows the shape of these weight vectors normalized with the weight of the first layer, w1, when obtained for the maximum R2 at d = 1.7 mm. Tissue closest to the sensor tip, i.e., more superficial sections, would be assumed to contribute more to the measured stiffness (Figs. 11 and 12), and the above weight vector analysis confirmed
35
that assumption, where a decreasing weight was given to deeper tissues (Paper II). 1
j
w /w
1
0.8 0.6 0.4 w(2), k=0.2
0.2 0
(1)
w , k=0.5 1
2
j
3
4
Figure 12. The shape of the two weight vectors that gave maximum R2 at d = 1.7 mm (Paper II).
Using both weight vectors, w(1) and w(2), it could be established how k depends on d by calculating the maximum R2 for the model at each d and obtaining k as done earlier. A significant correlation was found between d and the corresponding k at which maximum R2 was found for both of the weight vectors, and this is illustrated in Figure 13. This negative correlation indicates that with increasing impression depth at which (| f/ F|) was calculated, deeper tissue sections (smaller values of k) were included and given more weight (Paper II). A small impression implies that the sensor tip measures the stiffness of the more superficial sections as suggested by the above analysis. For increasing impression depth more sections can be sensed. 1.5 1.2
r = −0.87
k
0.9 0.6 0.3 0
r = −0.92 0
0.5
1 d (mm)
1.5
2
Figure 13. Relation of k and d for the weight vectors w(1) (circles) and w(2) (dots) with their respective linear least squares fit (lines) and correlation coefficient r (p < 0.05). (Paper II)
36
Note that a thin layer on the surface of each paraffin tissue block is normally removed in order to get a flat surface for obtaining a complete section. This means that the first section is not cut from the actual measured surface. In addition, during formalin fixation, the tissue slice was held in place in a plastic box and pressed with the measured surface against one side of the box. This may have compressed the tissue as compared with the thickness during the resonance probe measurements. Therefore it is difficult to define the exact depths at which the sensor senses. The maximum R2 for the k and d from Figure 13 stayed fairly constant around 0.6 in the range of 0.5–1.7 mm, while at other impression depths it was lower. This indicated that this range was suitable for measurement (Paper II). The resulting model parameters, , for the model with maximum R2 for the respective weight vectors are presented in Paper II, Table 2. They suggest that malignant glandular tissue increases the stiffness as compared with normal glandular tissue. This could be due to an increased intratumoural pressure. Furthermore, an increase in stroma is suggested to increase the stiffness of the tissue. The showed that these two, stroma and malignant glandular tissue, were the tissue types which predominantly increased stiffness. However, the presence of a large concentration of prostate stones can also increase the stiffness as compared to glands without stones. Cancer develops in the prostate glandular tissue, which is normally soft. Therefore tumours could be detected if sensor measurements on tumours were compared with the surrounding glandular tissue. Large quantities of stroma are located in the central and anterior parts of the prostate where tumours are less likely to occur. Therefore, stiffness in the posterior area could indicate a malignant tumour.
5.3 Sensor parameters and measured stiffness In an earlier study the resonance frequency at constant force was utilized for stiffness measurements by Eklund et al (1999) and was correlated to an international hardness standard (DIN ISO 2137). The resonance frequency also correlates to stiffness of silicone rubber defined as the spring constant (Lindahl et al 1998, Omata et al 2004). fF can be considered as a parameter that describes the size of the oscillating system (sensor and measured object) or load at a constant force. The softer the object the larger the contact area will be at the predefined force F. In this study, this parameter is measurement dependent, i.e., it is calculated from at least two measurements as the force is chosen as constant from the one with the lowest force. This results in it being a relative measure 37
between the measurements. However, it suffers from drawbacks: it is sensitive to erroneous contact areas and forces that might be caused from uneven surfaces or liquid films (Paper I). The change in f relative to a change in force, f/ F, is a differential relation and probably would not be as sensitive to erroneous contact areas and forces because it is studied in an impression interval. A change is recorded instead of an absolute value. A differential relation of force relative to frequency has been reported earlier (Eklund et al 2003a). f/ F is interpreted as the differential relation of the change in load to the change in applied force. This change is due to a change in impression depth around a predefined impression depth. Both parameters together improved the significant difference between tumour tissue and normal tissue from the ten prostate specimens as compared to either parameter alone (Paper I). This was probably because the ten different prostate glands differed among themselves, but the relative measure of fF could aid in the differentiation together with f/ F. Such a relative parameter could be helpful in future comparisons between two or more different prostate glands. The term stiffness in this study can be considered to be a combination of the physical properties of the measured object. It is related to the term hardness or softness or the felt consistency by touch. Topographical plots as means of visualizing stiffness profiles were introduced in Paper II. See figure 14 for topographical plots of two prostate specimens.
Figure 14. The sensor parameter f/ F calculated at d = 1.7 mm from the measurement matrix on each of the prostate specimens visualized the measured stiffness. The light coloured areas demonstrate stiff areas. Dots represent the actual measurements and the grid surface is a cubic interpolation fit from the measurements to aid in the visualization. The starting point of the measurements was at (0,0). Single values are shown. In the left plot the lower left light area (near X=0, Y=0) and the upper right light area (near X=20,Y=0-10) contained predominantly cancer. In the right plot a high stromal content was found in the light areas as opposed to glandular tissue in the darker areas.
38
5.4 Measurements and variability For measurements done on biological tissue such as prostate tissue, a variation is likely to be found in the measured sensor parameter. This is because soft tissue is not a well-behaved material, since it is dependent on time and moisture (Fung 1981). One source of error can be the effect of a remaining deformation due to a previous measurement or a nearby measurement. However, these are probably of minor importance. Another unwanted influence could be the dehydration and ageing of the tissue, but regular application of saline solution was used to minimize this. An irregular surface on the tissue might cause an erroneous contact area during the impression. Uneven amounts of saline solution would probably affect the contact area due to capillary attraction of the fluid film. However, the differential relationship between frequency change and force of the sensor parameter might minimize these effects. The measurements were conducted with the impression depth set to 2 mm and impression speed set to the lowest possible, 1 mm s-1 (Paper I and Paper II). The main reason for not choosing a larger depth was to avoid pressing too deep into the object and thereby damaging the tissue or the sensor. In addition, a larger depth would not have given much more information because the sensor tip is shaped as a hemisphere with a radius of 2.5 mm. Therefore a saturation level would have been reached for the frequency change after which it would not change (Lindahl et al 1998). A lower speed probably would not affect the measured object as much as a higher speed, because a higher speed would give a higher force on the tissue and thus affect the tissue more, being a mixture of viscoelastic materials. Data were only studied from the impression part of the measurement, not during the removal of the probe, because it was assumed that the impression part was enough to detect stiffness variations.
5.5 Future This licentiate thesis indicates that a resonance sensor-based system could be developed to assess the stiffness of fresh prostate tissue in an objective manner. In a recent study (König et al 2005), real-time elastography was used in conjunction with ultrasound to guide biopsies toward suspicious areas of cancer. That, together with results of this thesis, are promising for the development of a resonance sensor based system for biopsy guidance, where a miniaturized resonance sensor could be used together with ultrasound. Another possibility could be a future pen-like instrument for diagnosing fresh prostate tissue samples of cancer instead of microscope based 39
morphometric investigation. This could be used in conjunction with a radical prostatectomy to determine if the cancer had spread to or through the prostate capsule. That would aid in the classification and treatment of the prostate cancer. Future work will consist of investigating if it is possible to distinguish between cancer tissue and other tissues that contribute to hardness, such as stroma and stones, in the prostate. The frequency change and force relationship will be studied further to gain knowledge about the measured object. The quality of contact between the sensor tip and the measured object will be examined to detect possible sources of error. In addition, measurements will be done on whole prostate specimens from radical prostatectomies to study how the peripheral prostate capsule affects the measurements.
40
6. General summary and conclusions
This licentiate thesis describes the evaluation of resonance sensor measurements of stiffness on prostate tissue in vitro. It describes how a commercially available resonance sensor system was used on prostate tissue in vitro to evaluate the sensor technology’s possibility to measure stiffness as a means to detect prostate cancer. The Venustron® resonance sensor system was able to differentiate between tumour and normal tissue from ten prostate specimens with statistically significant differences and with reproducible results. Furthermore, resonance sensor measurements on fresh human prostate tissue containing malignant tumours were analysed in vitro, and variations in tissue stiffness were correlated with the histological composition of the tissue after fixation. The measured stiffness, modelled by the tissue type proportion, was increased by prostate stones, stroma and cancer as compared with healthy glandular tissue. In conclusion, malignant tissue can be differentiated from non-malignant glandular tissue, at least in the two specimens that were subject to the morphometric analysis. The resonance sensor is a promising tool for soft tissue stiffness measurement and especially for prostate stiffness measurement with the goal of detecting prostate cancer. However, further studies must be conducted to determine the full potential of the method and its diagnostic power. Measurements of tissue stiffness should preferably be used in combination with other methods such as biopsies to increase the diagnostic power.
41
42
7. Acknowledgement
I would like to express my gratitude to the people involved in the realization of this work. First of all I would like to thank Professor Olof Lindahl for introducing me into the world of research. Furthermore, I want to thank him for the guidance, knowledge, never-ending optimism, for believing in my ideas, and for co-authoring. Dr. Britt Andersson, my co-supervisor, for valuable advice and discussions throughout the work, and for co-authoring. Anders Bergh, professor in pathology, for all the help and time with the preparation of the prostate specimens for measurement, for the help with the morphometrical studies, and for co-authoring. Börje Ljungberg, professor in urology, for providing the prostate specimens and for co-authoring. Kerstin Almroth, for coordinating the measurement occasions. All the prostatectomy patients who gave consent for our research. My fellow PhD students and friends, Peter Lindberg and Niklas Norén, for all the discussions and fun we have had. The resonance sensor group members at the Department of Biomedical Engineering and Informatics at the University Hospital of Umeå for valuable help and discussions: Dr. Anders Eklund, Tomas Bäcklund, and Dr. Per Hallberg. The thesis students for valuable work: Conny Reidefors, Mats Bengtsson, André Öberg, Nazanin Bitaraf and, Ulrika Löthgren. People at the Department of Applied Physics and Electronics: Staffan Andersson, head of the department, for giving me an opportunity as a PhD 43
student at the department. Annemaj Nilsson, economy and staff administrator at the department, for all the practical help. Mona-Lisa Gunnarson, for administrating my PhD studies. Linda Johansson and Leif Johansson, system administrators, for all the help to solve problems with computers. Sven Elmå and Lars Karlsson, for technical help in the research project. Professor Sadao Omata and Dr. Yoshinobu Murayama for valuable ideas and discussions during their visits. The study was supported by grants from the Objective 1 Norra Norrland – EU Structural Fund and from the Swedish Cancer Society.
44
8. References
Aarnink R G, Beerlage H P, Rosette J J M C H D L, Debruyne F M J and Wijkstra H 1998 Transrectal ultrasound of the prostate: Innovations and future applications J. Urol. 159 1568-1579. American Cancer Society 2006 Cancer facts and figures 2006 (Atlanta: American cancer society) Bancroft J D and Stevens A 1996 Theory and Practice of Histological Techniques (Edinburgh: Churchill Livingstone, Medical Division of Pearson Professional Limited) Bergh A, Grönberg H, Hedestig O, Stattin P, Widmark A and Wikström P 2005 Prostatacancer - mannens gissel (Umeå: Medicinska fakulteten, Umeå universitet) ISBN 91-7305-950-1, 86 pp Eklund A 2002 Resonator Sensor Technique for Medical Use - An Intraocular Pressure Measurement System, Dissertation (Umeå: Umeå University) ISBN 91-7305-269-8, 68 pp Eklund A, Bergh A and Lindahl O A 1999 A catheter tactile sensor for measuring hardness of soft tissue: measurements in a silicone model and in an in vitro human prostate model Med. Biol. Eng. Comput. 37 618-624. Fung Y C 1981 Biomechanics - Mechanical Properties of Living Tissues (New York: Springer-Verlag) Hallberg P 2006 Applanation Resonance Tonometry for Intraocular Pressure Measurement, Dissertation (Umeå: Umeå University) ISBN 91-7264-061-8, 63 pp Hook J R and Hall H E 1991 Solid State Physics (Chichester West Sussex: John Wiley & Sons Ltd) Ikeda T 1990 Fundamentals of Piezoelectricity (New York: Oxford University Press) Inaba H, Miyaji K, Kaneko Y, Ohtsuka T, Ezure M, Tambara K, Takamoto S and Omata S 2000 Use of tactile stiffness to detect fatigue in the latissimus dorsi muscle Artif. Organs 24 808-815. Inaba H, Miyaji K, Kaneko Y, Ohtsuka T, Takamoto S and Omata S 2001 Muscle contraction and relaxation described by tactile stiffness Artif. Organs 25 42-46. Johnson R A and Wichern D W 2002 Applied Multivariate Statistical Analysis (Upper Saddle River, NJ: Prentice Hall) Khazan A D 1994 Transducers and their Elements (Englewood Cliffs, NJ: Prentice Hall) Kleesattel C and Gladwell G M L 1968a The contact - impedance meter -1 Ultrasonics 6 175-180. Kleesattel C and Gladwell G M L 1968b The contact - impedance meter - 2 Ultrasonics 6 244-251. Kleesattel C and Gladwell G M L 1969 The contact - impedance meter - 3 Ultrasonics 7 57-62.
45
Kusaka K, Harihara Y, Torzilli G, Kubota K, Takayama T, Makuuchi M, Mori M and Omata S 2000 Objective evaluation of liver consistency to estimate hepatic fibrosis and functional reserve for hepatectomy J. Am. Coll. Surg. 191 47-53. König K, Scheipers U, Pesavento A, Lorenz A, Ermert H and Senge T 2005 Initial experiences with real-time elastography guided biopsies of the prostate J. Urol. 174 115-117. Lindahl O A and Omata S 1995 Impression technique for the assessment of oedema: comparison with a new tactile sensor that measures physical properties of tissue Med. Biol. Eng. Comput. 33 27-32. Lindahl O A, Omata S and Ängquist K-A 1998 A tactile sensor for detection of physical properties of human skin in vivo J. Med. Eng. Technol. 22 147-153. Miyaji K, Furuse A, Nakajima J, Kohno T, Ohtsuka T, Yagyu K, Oka T and Omata S 1997 The stiffness of lymph nodes containing lung carcinoma metastases - a new diagnostic parameter measured by a tactile sensor Cancer 80 1920-1925. Miyaji K, Sugiura S, Inaba H, Takamoto S and Omata S 2000 Myocardial tactile stiffness during acute reduction of coronary blood flow Ann. Thorac. Surg. 69 151-155. Miyaji K, Sugiura S, Omata S, Kaneko Y, Ohtsuka T and Takamoto S 1998 Myocaridal tactile stiffness: a variable of regional myocardial function J. Am. Coll. Cardiol. 31 1165-1173. Murayama Y, Constantinou C E and Omata S 2005 Development of tactile mapping system for the stiffness characterization of tissue slice using novel tactile sensing technology Sensors Actuators 120 543-549. Ohtsuka T, Furuse A, Kohno T, Nakajima J, Yagyu K and Omata S 1995 Application of a new tactile sensor to thoracoscopic surgery: experimental and clinical study Ann. Thorac. Surg. 60 610-614. Omata S 1990 New type tactile sensor for sensing hardness like the human hand and its application for living tissue Technical Digest of the 9th Sensor Symposium 257-260. Omata S and Constantinou C E 1995 Modeling of micturition characteristics based on prostatic stiffness modulation induced using hormones and adrenergic antagonists IEEE Trans. Biomed. Eng. 42 843-848. Omata S, Murayama Y and Constantinou C E 2004 Real time robotic tactile sensor system for the determination of the physical properties of biomaterials Sensors Actuators 112 278-285. Omata S and Terunuma Y 1992 New tactile sensor like the human hand and its applications Sensors Actuators 35 9-15. Phipps S, Yang T H J, Habib F K, Reuben R L and McNeill S A 2005a Measurement of the mechanical characteristics of benign prostatic tissue: A novel method for assessing benign prostatic disease Urology 65 1024-1028. Phipps S, Yang T H J, Habib F K, Reuben R L and McNeill S A 2005b Measurement of tissue mechanical characteristics to distinguish between benign and malignant prostatic disease Urology 66 447-50. Sakai S, Sasai S, Endo Y, Matue K, Tagami H and Inoue S 2000 Characterization of the physical properties of the stratum corneum by a new tactile sensor Skin Res. Tech. 6 128-134. Sasai S, Zhen Y-X, Suetake T, Tanita Y, Omata S and Tagami H 1999 Palpation of the skin with a robot finger: an attempt to measure skin stiffness with a probe loaded with a newly developed tactile vibration sensor and displacement sensor Skin Res. Tech. 5 237-246.
46
Schröder F H, van der Maas P, Beemsterboer P, Kruger A B, Hoedemaeker R, Rietbergen J and Kranse R 1998 Evaluation of the digital rectal examination as a screening test for prostate cancer J. Natl. Cancer Inst. 90 1817-1823. Takei M, Shiraiwa H, Omata S, Motooka N, Mitamura K, Horie T, Ookubo T and Sawada S 2004 A new tactile skin sensor for measureing skin hardness in patients with systemic sclerosis and autoimmune Raynaud's phenomenon J. Int. Med. Res. 32 222-231. Tamhane A C and Dunlop D D 2000 Statistics and Data Analysis: from Elementary to Intermediate (Upper Saddle River, NJ: Prentice Hall) Tobocman W, Resnick M I and Pretlow T G 1997 Ultrasound reflections fail to reflect the histopathology of the prostate Prostate 30 33-40. Tortora G J and Grabowski S R 2003 Principles of Anatomy and Physiology (New York: Harper Collins Publishers) Waanders J W 1991 Piezoelectric Ceramics - Properties and Applications (Eindhoven: Philips Components) Watanabe T, Omata S, Lee J Z and Constantinou C E 1997 Comparative analysis of bladder wall compliance based on cystometry and biosensor measurements during the micturition cycle of the rat Neurourol. Urodyn. 16 567-581.
47