Inquiry into Urban Air Quality in Australia
Residential and Local Sources
RESIDENTIAL AND LOCAL SOURCES OF AIR POLLUTION 1.
INTRODUCTION
Since the early 1970s, environmental agencies have focussed most of their attention on large point sources and transport sources of air pollutants. The myriad of small sources scattered throughout suburban Australia, such as people’s heating appliances, lawnmowers and suburban restaurants, have received little attention. Perhaps this is simply because they are so dispersed or they may have been considered negligible, harder to deal with for technical reasons, or harder to deal with for political reasons. The analysis in this report demonstrates that these sources are not negligible, in fact some, such as woodheaters, are significant contributors to decreased air quality. The report discusses the nature and costs of technical options for reducing emissions from these suburban sources, as well as reductions through changes in user behaviour. Examples of existing controls range from stringent approaches such as banning backyard burning in some locations, through to modest requests for users of woodheaters to try to burn their heaters with less smoke. In many cases, controlling these small sources will be a very cost effective means of reducing total inputs of key air pollutants. The range of sources dealt with in this report is summarised in Table 1.1. Apart from the major event sources (hazard reduction burns and bushfires), the impact on air quality results from the combined effects of many small sources located within the urban areas. Table 1.1. Sources of urban air pollution discussed in this report. Source In suburbs Woodheaters yes Gas space-heaters yes Oil space-heaters yes Gas water-heaters yes gas cooking yes lawn mowers yes back yard incinerators yes evaporative (paints, cleaners, etc.) yes restaurant cooking often road making often hazard reduction burning no bush fires no Indoor air pollution sources yes
Seasonal yes yes yes no no somewhat somewhat no no no yes yes no
All the sources in this report are characterised by being emitted at low heights, thus reducing the chance of dispersion because they are unlikely to penetrate low level inversions. This means that their contribution to air pollution in the suburbs might be greater than some larger point sources which discharge their emissions through tall chimneys. Many of the sources are seasonal, which means their impact might be greater than their total annual emissions would suggest because of high pollution levels on some days at some times of the year. One of the difficulties in preparing a report such as this is the rapid change that is occurring in the 'bigger picture'. Governments are changing the rules that apply to electricity and gas utilities, encouraging free competition and selling state owned utilities into the private sector. Governments are also trying to minimise subsidies and rebates.
Inquiry into Urban Air Quality in Australia
Residential and Local Sources
These changes could have large impacts on the community's preferences for heating fuels and so significantly alter the estimates of air pollution from these sources. It is not possible to build these 'external factors' into the discussion that follows. In places in this report, it is suggested that a rebate or other financial inducement might assist in reducing emissions of air pollutants. In other places, other forms of government intervention that would incur some cost to government are suggested. The political question of whether or not such costs are appropriate, or whether all costs should be borne directly by the 'polluter' (i.e. either the end-user or the supplier of fuel/equipment/etc.) has not been addressed. 1.1
Aim and objectives
The aim of this report is to provide a set of policy options for ensuring that residential and other suburban sources of air pollution do not cause unacceptable urban air quality in Australian cities. To realise this aim it is necessary to achieve the following objectives: • characterise the number and magnitude of sources of air pollution for those sources covered by this report; • estimate the significance of these sources relative to other sources in urban areas; • estimate trends in emissions from these sources over the next 5 and 10 years; • where the decrease in air quality is now, or might become, significant relative to levels at which health impacts may occur, provide options for reducing emissions from the most important sources; and • estimate the costs of the proposed control measures. There are many approximations and assumptions in a study of this nature. The report has been written to make these as clear as possible. The report also highlights areas where more research and analysis is required. Major uncertainties in estimating current pollution levels have meant that there has been little opportunity for discussing trends over the next five or ten years, exept in the broadest sense. The report is structured around each type of source, e.g. backyard incinerators, with estimates of the contribution of priority pollutants from each source and existing or new control measures. Costs of control are included. The combined effect from all the different sources is presented in Section 12 of this report. 1.2
Scope and general background 1.2.1 Sources
The broad scope of Task Group 3's (TG3) report has been set by the Inquiry Steering Committee. This has been reviewed at meetings of the Chairpersons of all seven Task Groups to minimise duplication between Groups and to try to avoid any gaps. As a result of this process, TG3 has been asked to examine all possible sources of air pollution from fixed sources (i.e. not cars, buses, etc.) dispersed through the urban areas of Australian cities. This includes emissions from people's homes and gardens, from suburban businesses, and from other suburban activities (e.g. road making).
Inquiry into Urban Air Quality in Australia
Residential and Local Sources
Evaporative emissions from paints, cleaning fluids, etc. are included. TG3's scope has been broadened to include emissions from burning vegetation (hazard reduction burning, bushfires, etc.) which might impact on urban areas. Specifically excluded from TG3's scope are: • small manufacturing or processing industries located in the suburbs (dealt with by TG2 as point sources); • dry cleaning and laundry businesses (dealt with by TG2 as point sources); • hospitals (dealt with by TG2 as point sources); and • off-road vehicles (dealt with by TG4 as transport vehicles). Evaporative emissions from petrol stations are included. Electricity use within people's homes is considered because improved efficiency will lead to reduced demand and, indirectly, reduced emissions from thermal power stations. While the discussion of the potential for improved end-use efficiency is discussed in this report, the actual emissions from power stations are dealt with by TG2 (point sources). In a similar vein, improved thermal insulation and solar building design are considered in this report. They offer means of reducing heating and cooling loads which will reduce electricity demand (air conditioners and electric heating) or reduce combustion of heating fuels (gas, oil and firewood). As with increased end-use efficiency, the reduction in electricity demand leads indirectly to reduced emissions of pollutants, while the reduced need for other fuels is a direct reduction in emissions from suburban sources and is covered in more detail in this report. Other indirect causes of air pollution, such as the environmental burden and embodied energy of goods and services (life-cycle assessment and energy analysis), are not dealt with in this report. They are important, because there is little point in solving one problem but creating another instead. TG6 (Urban Infrastructure) deals briefly with these topics. 1.2.2 Pollutants This report focuses on six priority pollutants: particles, carbon monoxide, nitrogen dioxide, photochemical oxidants, sulphur dioxide and lead. These pollutants are frequently used as general indicators of air quality and are the six pollutants dealt with in the National Environment Protection Measure (NEPM) which is being developed by the National Environment Protection Council. Time limitations have meant that other important air pollutants, such as polycyclic aromatic hydrocarbons (PAH) and many other groups of chemicals and specific compounds, have not been addressed. Some of these are significant when considering combustion of organic material such as firewood in woodheaters and open fires, garden refuse in backyard incinerators, and forest litter in hazard reduction burns. It is recommended that studies of toxic organic air pollutants be included in the development of pollution control measures for these sources. 1.2.3 Indoor air quality The terms of reference for the Inquiry specifically exclude indoor air quality. As most Australians spend over 90 percent of their time indoors, a discussion of residential and suburban sources of air pollution would be incomplete without some reference to air quality in homes and offices. However, it is not the intent of this report to examine indoor air quality, or measures for improving indoor air quality, in any detail. A brief review of indoor air quality issues, together with reference to more detailed reports, is included in Section 11 of this report. It should be noted that in some cases there is a
Inquiry into Urban Air Quality in Australia
Residential and Local Sources
conflict between improved thermal performance of buildings and indoor air quality. 1.3
Health impacts
A very brief discussion of the heath impacts of four of the six priority pollutants discussed in this report is presented here. There are many more detailed discussions of health impacts of these pollutants (e.g. Streeton 1990, NEPC 1997, Boyle et al. 1996). While some air pollutants might reach fatal concentrations in exceptional circumstances, such as carbon monoxide levels from petrol engines in closed spaces, we are generally dealing with levels of air pollution that cause much more subtle health impacts. Current levels of air pollution in major urban areas in Australia are at concentrations that may cause health impacts that are restricted to vulnerable groups, such as the elderly and very young. In some instances there may be ‘mild’ health effects on many people, such as headaches or eye irritation, and in other cases there may be severe health impacts, even death, on a very small number of susceptible people. The difficulty in working near the limits of detectable health impacts is that there is considerable uncertainty. Some studies show health impacts, while others under apparently identical conditions do not. Epidemiological studies are difficult because large numbers of people must be surveyed to pick up these small changes to health, and there are many confounding factors, such as whether people smoke, what other types of pollutants they are exposed to, genetic factors, weather conditions, income, etc. In general, environmental agencies try to err on the side of caution, setting acceptable limits that are on the lower limits of the uncertainty about health impacts. In some cases this is difficult because there are no clear health thresholds, such as the case with fine particles in the atmosphere. The ‘precautionary’ approach has to be tempered by economic, technical and social considerations. While it might sound crass, the fact is that some risk must be accepted. If the estimated cost of saving one life through control of a particular air pollutant is $10 million, but one life could be saved by spending $1 million on new equipment for a hospital, then, with limited money available, the air pollution control measures may be deferred. 1.3.1 Fine Particles In recent years there has been a lot of attention paid to fine particles in the atmosphere, that is particles less than 2.5 microns (millionths of a metre or µm) in diameter. These very small particles have the unfortunate property of being able to penetrate deep into the lungs, while larger particles in the air are trapped in the nose or throat. Even in 'clean' air we breathe millions of fine particles into and out of our lungs in the 10 000 litres of air that pass through our lungs each day. In polluted air, it seems that the normal cleansing functions of the lungs become overloaded and health problems, linked to the number and chemical composition of the fine particles, become apparent. In the United States, several studies in recent years have indicated that for each 10µg/m3 increase in fine particles (PM10, averaged over 24 hours) there is a 1% increase in mortality (e.g. Schwartz 1993, Dockery et al. 1992). In Europe, a similar, but slightly smaller 0.5% increase has been measured (Vedal 1997). At this stage, the epidemiological studies suggest that the chemical composition of the particles is not a critical factor, it is simply the mass of these fine particles in the air. These findings have far reaching implications for air pollution control. The situation is complex, with considerable variation in findings from one study to the next, and some experts feel that there may be more to the problem than simply the concentration of fine particles (Vedal 1997). Despite some uncertainty, these are very significant findings for those involved in pollution control. There are likely to be much stricter controls imposed on fine particle
Inquiry into Urban Air Quality in Australia
Residential and Local Sources
concentrations in the air. For example, the new Australian national standard for fine particles in ambient air (PM10) is likely to be 50 µg/m3 (NEPC 1997), a significant reduction from the current 'guideline' of 120 µg/m3 (Streeton 1990). As discussed in Section 3 (below), emissions woodheaters and open fireplaces can cause increases in fine particle concentrations in some suburban areas to levels greater than 120 µg/m3. Interest in fine particle matter in the air is such that the Australian and New Zealand Environment and Conservation Council (ANZECC) has commissioned a major report on the state of knowledge on this topic. The report should be available in 1997 or 1998. 1.3.2 Carbon monoxide (CO) At low concentrations (10 to 50 parts per million (ppm)) CO causes headaches and decreases reaction times. It can cause angina and impair vision. At high concentrations (300 to 500 ppm) it causes coma and death. Being odourless and colourless, people may not be aware that they are exposed to CO, which makes it more difficult to control. Motor vehicles and woodheaters are significant suburban sources of CO. 1.3.3 Nitrogen Dioxide (NO2) Nitrogen dioxide is an important contributor to the development of ozone in photochemical smog. It is also an air pollutant in its own right. Most of the nitrogen dioxide in city airsheds arises from motor vehicles and therefore would be associated with particles, carbon monoxide and other vehicle derived pollutants. Some asthmatics can have increased airway responsiveness to nitrogen dioxide at levels of 0.2 ppm. Hourly or longer term exposure could increase the frequency of other common respiratory illnesses. However, adverse heath effects at low levels of nitrogen dioxide (1 ppm hourly average) remain equivocal (Streeton 1997). 1.3.4 Lead (Pb) Atmospheric lead levels in suburban Australia are decreasing as more of the car fleet uses lead free petrol. There have also been significant reductions in average levels of lead in children's blood (Australian Institute of Health and Welfare 1995). But there are large quantities of lead in old paint on buildings that could be released into the atmosphere if painted wood is burnt or if old paint is burnt off prior to repainting. This could result in short term, but high, exposure in some people. Lead exposure (through air, water or food) can result in a range of health effects. Lead exposure from old paint dust or flakes is cause for concern. Young children and pregnant women are at greatest risk of lead poisoning. Children may exhibit a range of central nervous system disorders, including reduced learning ability. 1.4
Regional variations
The study of small sources of air pollutants dispersed through the suburbs presents quite different analysis and interpretation problems to the study of large point sources. The emission factor (grams of pollutant per unit of fuel burnt) or emission rate (grams of pollutant per unit time) for each small source should be known if total emissions are to be calculated. In practice, the best that can be done is to estimate average emissions for each type of source. To facilitate analysis of pollution inputs from many sources in this report, all emissions are converted to annual or monthly total emissions so that the significance of the source can be determined by comparing it to estimates of total emissions from all sources. In some cases the conversion from original units to this common unit introduces additional uncertainties in the accuracy of the final emission
Inquiry into Urban Air Quality in Australia
Residential and Local Sources
rate. The second important piece of information required is the number of each type of small source within a particular area. This, coupled with the average emission, allows the total emission per hectare for each pollutant to be calculated. The third important factor is the dispersion characteristic of the pollutants. If light winds are blowing then pollution from many dispersed sources will accumulate down wind. For example, light southerly winds blowing over a town with many woodheaters in use will leave the southern side of the town relatively free of smoke, whereas the northern side may experience high smoke concentrations. One consequence of this is that the average exposure to smoke for the whole town's population will be quite different to the worst case exposure for a small proportion of the town's population. Two approaches might be taken to deal with the very different exposures experienced by different sections of the population. One is to take several specific case studies, i.e. actual suburbs or towns, and carry out analysis for them. This has occurred in the National Pollutant Inventory (Boyle et al. 1996). The other approach is to consider a hypothetical town or suburb and model that. In this report the second approach has been adopted, but the hypothetical cases have been matched to examples of actual towns or suburbs to ensure the predicted pollution levels are realistic. The most significant direct impact on air quality from the residential sector is the emissions from heating appliances. Use of heating is very climate dependent and so it is inappropriate to try to predict a single emission contribution for the whole country. The availability of natural gas in suburban areas is another factor which influences choice of heating fuels. Ideally, emissions from heating sources should be estimated for individual cities, or suburbs, with knowledge of heating types and heating needs for that particular location. For the purposes of this analysis, four different zones for climate and fuel type have been used. Where sufficient data exists, individual cities have been used as examples. The report has adopted four representative zones: small city < 500 000 cool climate
large city > 500 000 cool climate
small city < 500 000 warm climate
large city > 500 000 warm climate
Some common characteristics are that small cities usually have access to low cost firewood which influences choice of heater type. The larger capital cities and some larger rural cities have access to natural gas. In the warm climates, the significance of emissions from heating sources obviously decreases. 1.4.1 Hypothetical suburbs The calculations in this report are based on four hypothetical suburban areas. The aim is to get a simple method of estimating maximum and average ambient concentrations of air pollutants from knowledge of the emission rate. This means having an estimate of the number of sources per unit area together with worst case and average dispersion rates for near ground level emissions. More sophisticated modelling is desirable, but well beyond the resources of this report. The National Pollutant Inventory should achieve this goal of greater sophistication
Inquiry into Urban Air Quality in Australia
Small city Houses/ha 15 Large city Houses/ha 25
Residential and Local Sources
Restaurants/ ha 0.1
Service Stations/ha 0.02
Wood heating 50 %
Gas heating 10 %
Oil heating 5%
Electric heating 35 %
Restaurants/ ha 0.2
Service Stations/ha 0.03
Wood heating 10 %
Gas heating 50 %
Oil heating 10 %
Electric heating 30 %
Cool climate: heating 40 GJ/year Warm climate: heating 10 GJ/year 1.4.2 Dispersion In seeking a convenient model for estimating the effect emissions have on ambient air quality, one approach is to consider a simple box model with good mixing up to 50 m (i.e. a low inversion) and then a gradual exchange of air into and out of this box. If an exchange rate of 2 air changes per hour is used for worst case conditions, this gives results that are consistent with worst case conditions in cities such as Launceston. If an exchange rate of 6 air changes per hour is used, the average monthly ambient air conditions are consistent with these cities. The significance might be calculated as follows: [sources per ha] x [emission rate (µg of pollutant per day)] ÷ [air volume (24 x 106 m3)] = worst case concentration (µg/m3) Note the air volume is 500 000 m3 x air changes per hour (2) x 24 Obviously, a model as simple as this is open to criticism from many angles. It still serves the useful purpose of putting orders of magnitude onto the impact of emissions from dispersed sources and without such a model it is not possible to link emissions to ambient conditions and hence to health impacts. 1.4.3 Ambient pollution concentration limits As a yard-stick for determining whether or not the emissions from a particular source are significant (i.e. are worth trying to control) the proposed ambient air standards outlined in the NEPC discussion paper have been used. Any combination of emission rate and source density, when used in the crude calculation outlined in section 1.4.2, which gives predicted pollutant concentrations that are 1% or more of these standards, is considered ‘significant’. The proposed ambient air standards are (NEPC 1997): Particles (PM10) Carbon Monoxide Nitrogen Dioxide Lead Photochemical Oxidants Sulfur Dioxide
50 µg/m3 (24 hour average) 9 ppm (10 µg/m3) (8 hour average) 0.125 ppm (250 µg/m3) (1 hour average) 0.03 ppm (60 µg/m3) (1 year average) 0.50 µg/m3 (3 month average) 0.10 ppm (200 µg/m3) (1 hour average) 0.08 ppm (160 µg/m3) (4 hour average) 0.20 ppm (600 µg/m3) (1 hour average) 0.08 ppm (240 µg/m3) (24 hour average) 0.02 ppm (60 µg/m3) (1 year average)
Inquiry into Urban Air Quality in Australia
1.5
Residential and Local Sources
Domestic Heating
The most recent information available on domestic heating preferences in Australia is the Australian Bureau of Statistics (ABS) survey “Environmental Issues People’s Views and Practices Australia June 1994”. The ABS report also contains information on insulation, double glazing and solar aspect, all of which is relevant to this report. One problem with using the information in Table 1.2 is that it is state-wide data and rural areas are known to have different energy mixes to urban areas. Capital city data will suffer the same shortcomings. For example, the National Fuelwood Study (Todd et al. 1989) demonstrated that in Victoria in 1988 the proportion of homes using firewood as their main heating fuel was 7.4%, in Ballarat city it was 15.2% and in the environs of Ballarat it was 28%. This four-fold difference would strongly influence estimates of wood-smoke emissions in a suburb of Melbourne compared to a smaller rural town. There was a gap of eight years to the previous national survey of domestic heating in Australia (ABS 1986) which makes it difficult to determine recent trends in heating preferences. In areas where natural gas has become available, gas has captured a significant proportion of the heating market (the ACT for example). Oil heating has continued a slow decline. Woodheaters appear to have peaked in popularity in 1992 or 1993 (based on sales figures for woodheaters). In some regions electric heating is increasing with greater use of heat-pumps (e.g. Tasmania). Large changes in heating practice can occur in the space of 10 years because of the relatively short life of domestic heating appliances (10 to 15 years) and possible rapid changes in the relative costs of heating fuels. In this report a conservative approach has been adopted, with only small changes in preferred heating type assumed.
Inquiry into Urban Air Quality in Australia
Residential and Local Sources
Table 1.2 Main heating fuels in homes in Australian states and territories in 1994. (Source ABS 1994). State Heating Territory type(%) gas gas oil firewood electric other none natural (LPG) ACT 45 1.2 4.5 10.2 37.8 0.9 0.4 NSW 14.9 4.8 3.5 17.1 46.3 1.8 11.7 NT 0.7 4.7 1.5 1.2 8.8 1.3 81.8 Qld. 1.1 1.9 3.7 10.1 26.6 2.0 54.6 SA 29.6 3.6 4.2 19.0 36.0 1.5 5.9 Tas. 0 5.2 4.8 60.5 28.8 0.6 0.2 Vic. 68.3 2.7 1.3 14.0 12.5 0.6 0.6 WA 29.1 3.0 3.9 31.6 17.1 2.1 13.2
Inquiry into Urban Air Quality in Australia
2.
Residential and Local Sources
DOMESTIC HEATING WITH FIREWOOD
The first domestic air pollution sources discussed in detail in this report are woodheaters and open fireplaces. Wood-smoke from these sources has received considerable media attention in the past few years. It is estimated that 1 200 000 households in Australia use firewood as their main heating fuel (ABS 1994) and a further 300 000 use firewood as an occasional or secondary heating fuel (Wood Heating Association 1997). Thus, about 20% of all households use firewood for heating. The mix of controlled combustion woodheaters and open fires is not well known (i.e. there are no recent, reliable statistics). The Wood Heating Association (1997) estimate 800 000 woodheaters are used as main household heaters and a further 700 000 open fireplaces are used as main or secondary heaters. It is estimated that around 5 million tonnes of firewood are consumed each year for domestic heating. Prior to 1992 there were no controls over the emissions of smoke from woodheaters or open fireplaces. The publication of the Australian Standard AS4013 in 1992, which set a maximum emission factor of 5.5 g/kg for particles, encouraged many Australian heater manufacturers to manufacture and sell appliances that complied with the standard. But the standard was only called up in legislation in some states (Tasmania 1993, ACT 1994, NSW 1996) and is still not a legal requirement in four states. 2.1
Emission factors
Estimates of emissions will depend on the proportion of homes using woodheaters or open fireplaces, the quantity of wood they burn annually, and the emission factors adopted for woodheaters and open fireplaces. The emission factor for particles for the current mix of woodheaters in Australia (taking into account poor heater operation and some wet firewood) has been taken as 13.6 g/kg based on a recent study by Todd (1997). Emission factors for this and other pollutants are as follows: CO NOx SO2 PM10
83.5 1.4 0.2 13.6
g/kg (derived from USEPA 1995, see below) g/kg (from USEPA 1995) g/kg (from USEPA 1995) g/kg (from Todd 1997)
The estimate for CO emissions (for which little Australian data is available) assumes changes in particle emissions are proportional to changes in CO emissions. This allows adaptation of USEPA data (which ranges from 115 to 70 g/kg) to Australian conditions. Emission factors for open fireplaces are based on USEPA (1995) data. There is no information available on emissions from open fireplaces burning typical Australian firewood species. Emission factors from the USEPA: CO NOx SO2 Particles (PM10) 2.2
126.3 1.3 0.2 17.3
g/kg g/kg g/kg g/kg
Wood-smoke contribution to ambient pollution
Inquiry into Urban Air Quality in Australia
Residential and Local Sources
It is well established that woodheaters contribute significant quantities of particulate pollution to cities such as Launceston, Tasmania (Lyons et al. 1996). Even larger cities, such as Melbourne, may experience wood-smoke problems in winter months (EPA Victoria 1991). Even though wood-smoke is known to contribute to urban air pollution, it is still useful to apply the rough calculation method outlined in section 1.4 to the woodheater and open fireplace emissions. The calculations below suggest that woodheaters and open fireplaces, in cool climates, may emit sufficient particles to cause ambient standards to be exceeded, even when no other sources are present. They may also contribute to carbon monoxide and nitrogen dioxide problems when other significant sources are present. 2.2.1 Woodheater contribution to air pollution For a small city in a cool climate, consider the case of 50% of houses using woodheaters, burning 5 tonnes of firewood per year (28 kg/day over 180 days), with emission factors as shown above (section 2.1). The ‘worst case’ 24 hour concentrations of particles calculated assuming conditions outlined in section 1.4.2 would be: 7.5 heaters/ha x 28 kg firewood/day x 13.6 g/kg = 2856 g of particles/day air volume 500 000 m3 with 2 air changes per hour = 24 x 106 m3 air per day particle concentration 2856/24 = 119 µg/m3 This is well above the proposed ‘standard’ 50 µg/m3 24 hour limit, and so woodheaters are considered significant sources of particles under these conditions. This crude estimate is consistent with observed particle concentrations observed in cities with a large proportion of woodheaters. Applying this same calculation to the other priority pollutants gives the following estimates of total emissions: carbon monoxide 730 µg/m3 compared to limit of 10 mg/m3 (10 000 µg/m3), i.e. > 1%, significant, but not as significant as particles. nitrogen dioxide 12.3 µg/m3 compared to a limit of 250 µg/m3, (this assumes all NOx is NO2) i.e. > 1%, significant, but not as significant as particles. sulphur dioxide 1.8 µg/m3 compared to a limit of 240 µg/m3, i.e. < 1%, so not significant for this report. In a large city in a cool region, with less woodheaters per hectare, particle emissions are still significant but carbon monoxide and nitrogen dioxide emissions are just on the 1% (arbitrary) cut-off line, i.e. they are probably not significant. In warmer regions in small cities, particles are still significant, and carbon monoxide and nitrogen dioxide might be significant on cold days when wood use is high. In warm, large cities there might be areas of particle pollution attributed to wood-smoke on cold days. 2.2.2 Open fireplace contribution to air pollution The emission factors for open fireplaces are as high or higher than for woodheaters and, when burning vigorously, they consume wood at a greater rate than woodheaters. Thus open fires have the potential to cause more air pollution than woodheaters. They are not used as frequently as woodheaters (i.e. may be used more for social reasons than as a main heat source). However, in areas with many open fires, the potential for reduced air quality is clearly evident. The role of open fires in air pollution incidents (i e particulate concentrations exceeding
Inquiry into Urban Air Quality in Australia
Residential and Local Sources
emission standards) requires further investigation. 2.3
Control options for wood-smoke
Given the current concern about emissions from woodheaters and open fires it is surprising that there has not been greater regulatory interest. There has been ample warning that wood-smoke might develop into a problem in Australia. In 1986 the state of Oregon in the USA introduced compulsory emission standards for new woodheaters because of wood-smoke problems there, and this was followed by national limits right across the United States in 1988 (Todd and Singline 1989). Four broad approaches are possible: • improved appliances (this is the responsibility of the manufacturing industry but it must be driven by the environmental agencies); • better use (the responsibility for community education is shared between the industry, state environmental agencies and local government); • restricted use (this is the responsibility of environmental agencies and local government); and • firewood quality (this is the responsibility of fuel merchants but it must be driven by state environmental agencies). Thus, any discussion of means of reducing wood-smoke must deal with both specific measures and the organisations with responsibility for implementing the measures. 2.3.1 Improved Appliances. The design of controlled combustion wood burning appliances (i.e. woodheaters as opposed to open fires) offers many opportunities for reducing emissions of particles and carbon monoxide. These have been summarised by Todd (1994) and include: a high temperature gas combustion zone, good mixing of volatiles and combustion air, avoiding flame quenching on cool surfaces or with cool combustion air, and sufficient retention time for combustion to take place. The shape of the combustion chamber, location and size of combustion air inlets, and materials used in the combustion chamber all influence emission of pollutants. Additional devices such as catalysts or afterburners may also be used to reduce emissions (although they are not used in the Australian industry at present). Reduced emissions of pollutants are synonymous with increased combustion efficiency. Increased heat transfer efficiency also reduces emissions because less fuel has to be burnt for a given heat output. Thus, consumers choosing appliances because of their high efficiency will be choosing appliances with lower emissions, although the optimum is to select appliances with both high efficiency and low emissions. Unlike the Australian gas appliance manufacturing industry, the Australian wood heating industry has not been self regulating. There is no voluntary performance or emission standard that manufacturers or importers of appliances must meet. Thus, minimum performance and emission levels are determined by consumer choice and government regulation. Until the publication, in 1992, of the Australian Standards for testing the performance (AS4012) and emissions (AS4013) of woodheaters there were many false or misleading claims about these appliances. This meant that consumers were not adequately informed and so could not influence the development of better appliances. Government regulation was not possible either because of the lack of standard test methods. 2.3.1 (a)
Compulsory compliance with standard
Inquiry into Urban Air Quality in Australia
Residential and Local Sources
The Australian Standards were published in 1992 after four years of development, but it was not until 1993 in Tasmania that the Standards were first called up in any State pollution control legislation. ACT followed suit in 1994 and NSW in 1996. Many Australian manufacturers chose to have appliances tested, and sold heaters that met the Standards prior to any legal requirement to do so. But with the delays in adopting uniform national standards, some manufacturer are now marketing untested models of heaters in those states which do not require heaters to conform with the Standards. These untested heaters probably have higher emissions than the heater models that comply. It is not known what proportion of heaters sold in States such as Victoria (which does not have legislation requiring compliance with AS4013) do not comply with the Standard. With a testing and heater certification system already in place, it would involve very minor additional costs for states such as Victoria to introduce legislation requiring all heaters sold in the state to meet the requirements of the Australian Standards. The advantage of the emission limit set in the Australian Standard (AS4013) of 5.5 grams of particulate material per kilogram of fuel burnt is that it means roughly half the emissions of heaters sold prior to 1992. This is a very significant reduction, but its benefits may be gradually being lost because of the failure of some states to make this standard mandatory. Unfortunately, even in those states and territories that have called up the Standard, the legislation is far from ideal. In Tasmania, for example, it is not illegal to modify an appliance once it has been sold. It is well known within the industry that some householders, or heater retailers, remove the minimum burn rate stop (the device that ensures sufficient air is present for clean burning) so that the heater will burn for longer periods unattended. This is very detrimental to the clean burning characteristics of the appliance. The fact that this was not included, despite representations at the time the legislation was drafted (Todd, pers. comm.), suggests that the environmental agencies desire to control wood-smoke was rather half-hearted. Another serious flaw in current appliance control measures is the lack of policing of the legislation. No heaters have been checked by authorities to ensure the model claiming to meet the emission standards is identical to the model that was tested. There is anecdotal evidence that some less scrupulous manufacturers are selling models that are quite different to the one tested. It would be a relatively low cost deterrent to randomly select some models of woodheater from retail outlets and check to see that they were the same as the heater tested. If the heater was not identical it should be retested at the manufacturers expense, and if it did not perform as well as the certificate indicated, the certificate should be withdrawn. The cost to environmental agencies would only be a few thousand dollars (typical heater price around $1200), some of which could be recouped by reselling models which were identical to those tested. A simple change to state legislation would be required to make this possible. Purchase and inspection of 10 heater models per year $12 000 less, say, $7000 resale = $5000 $5000 inspection fee (10 @ $500) Total $10 000 per year Note that this does not include the cost of redrafting legislation, nor does it include the possibility of offsetting these costs against money generated from fines for noncompliance. The benefits of this control measure can be roughly estimated by assuming that one third of models tested did not comply (pure speculation). Selection of heater models would probably not be random but rather based on prevalence of complaints or
Inquiry into Urban Air Quality in Australia
Residential and Local Sources
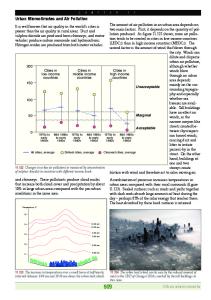
knowledge that certain models had been changed without retesting. Annual sales 45 000, about 200 models. Say the program identified 1500 heaters (i.e. one in 30) that did not comply. Assuming emissions are reduced from 10 to 5 g/kg (i.e. sales of complying heaters instead of non-complying heaters) each burning 4 tonnes per year, 1500 x 5 g/kg x 4000 kg = 30 tonnes of particles per year (on-going) over 10 year life of heater = 300 tonnes. So cost is $33/t. 2.3.1 (b) Star rating The impact of consumers choosing heater models with the lowest emission factors could be enhanced through a ‘star rating’ system for woodheaters. The Energy Information Centre in Adelaide, which presently acts as a clearing house for testing and certification, have proposed a star rating system (similar to the two sets of stars for air conditioners) with one set of stars for efficiency, one for emissions and a single figure for maximum power. Such a rating system would make it much easier for consumers to select heaters with the best performance and lowest emissions. It is proposed that the system would be self-funding through a small fee paid by heater manufacturers or importers. It is very difficult to quantify the benefits of such a system, but because the costs are low even a small shift to cleaner burning appliances would present good value for money. 2.3.1 (c) Reduced emission factor The Australian Standard AS4013 provides a test method that measures the appliances emissions at high, medium and minimum burn rates. It suggests an average emission factor of 5.5 g/kg as the maximum for appliances that comply with the standard. This figure was chosen to match as closely as possible the United States emission limit (which is expressed as an emission rate (g/h). But there is no reason why a lower limit should not be set within a particular state or local government area. For example, the city of Christchurch in New Zealand, has recently lowered the allowable limit for new heaters from 5.5 g./kg to 3 g/kg with a further reduction to 1.5 g/kg in the year 2000 (Canterbury Regional Council, pers. comm. June 1997). The Australian Wood Heating Association has suggested that a reduction in the emission factor by about 25% (from 5.5 g/kg to 4 g/kg) might be acceptable to the industry, provided sufficient warning was given and retailers were able to clear stock already held. Figure 2.1 shows the distribution of emission factors for all heaters tested to AS4013. This shows that some ‘approved’ heaters (i.e. which comply with AS4013) have considerably lower emission factors than others. Thus there is scope for lowering the allowable emission limit, while still leaving consumers with a wide choice of heater models.
Inquiry into Urban Air Quality in Australia
Residential and Local Sources
30 25 20 15 10 5 Num 0 1
1.5
2
2.5
3
3.5
4
4.5
5
Emission Factor (g/kg)
Figure 2.1 Distribution of emission factors for 180 models of woodheater tested to Australian Standard AS4013 (WHA 1997).
2.3.1 (d) Second hand heaters Newspaper advertisements suggest that there is a steady trade in second hand and reconditioned heaters. This is significantly prolonging the life of many heaters that would not comply with AS4013. Sale of pre-1992 heaters could be banned, or there could be a ‘pollution levy’ placed on sale of such heaters. Effective policing of such a levy would be impractical, so the only realistic solution appears be a ban on the sale of heaters that do not have compliance plates. Assuming a reduction of 6 g/kg (average) if a person uses a post-1992 woodheater compared to a pre-1992 heater with an average annual fuelwood use of 4 tonnes, the reduction in emissions in forcing a person to buy a new, rather than second hand heater, would be 24 kg of particles. Assuming a 10 year heater life this becomes 240 kg. Assuming a new heater costs $1000 more than a second hand heater the cost is $4200/t. 2.3.1 (e) Buy-back One important limitation on relying on emission limits for new woodheaters to reduce total emission is the large stock of older appliances in use across the country. The useful life of woodheaters is probably around 10 to 15 years, but heaters that are not run at excessive temperatures might last much longer. There are still a small number of heaters from the 1950s operating across the country. An outright ban on the use of heaters without AS4013 compliance plates is possible, but there would be a moral responsibility to compensate owners who had bought their appliances in good faith. With an estimated 600 000 pre-1992 heaters in use, and assuming an average value of $500 (probably a conservative estimate) the total cost would be $300 million. For a household consuming 4 tonnes of firewood per year, reducing the emission factor from 12 to 6 g/kg would reduce emissions from 48 kg to 24 kg of particles per year. Over 5 years (assumed average remaining life of pre-1992 heaters) this would save 120 kg. Thus the cost effectiveness of this approach would be about $4200/t of reduced particle emissions. One alternative might be to simply offer a small inducement to upgrade from a noncomplying heater to a new model. A refund to consumers of, say, $50 might encourage some householders to upgrade earlier than they would otherwise. Based on the above calculation, this would give a cost effectiveness of $420/t of reduced particles, but this might be a little optimistic because some people might claim the
Inquiry into Urban Air Quality in Australia
Residential and Local Sources
money even though they had to replace the heater anyway (because it was worn out). 2.3.2 Improved use of woodheaters The combustion properties of firewood in woodheaters depend on the geometry of the wood pieces in the combustion chamber and the amount of combustion air. Laboratory tests have shown that by deliberately loading wood to maximise emissions and controlling the combustion air to maximise emissions, it is possible to achieve emission factors 50 times higher than with good appliance use. If wet wood is used instead of dry wood, this increase can be still higher. This is an extreme case, but demonstrates the importance of correct heater use. A poll of technical staff in woodheater testing laboratories in Australia in 1994 (Todd 1994) suggested that a realistic estimate of relative smoke emissions of a well operated woodheater and one that was operated without any consideration of emissions would be around a factor of two, i.e. half as much smoke from the well operated woodheater. Table 2.1 indicates the sort of initiatives that can be used to reduce emissions. Table 2.1 Hints for correct use of woodheaters. 1. Always run the heater on its maximum burn rate setting for 20 minutes after refuelling or lighting the heater. 2. Do not over-fill the heater. There must be space above the wood load to allow gases to burn. 3. When lighting a cold heater always use sufficient kindling to get a good hot fire established quickly. 4. If the fuel load has burnt down very low so there are only a few red coals present do not just add large logs, instead add some paper and small wood pieces to get the fire re-established. 5. Use smaller logs for high heat outputs and larger logs for slower burning. 6. Always use dry firewood. It should have less than 20% by weight of water. Store wood in a well ventilated, covered space. 7. Place logs in the firebox with about 2 cm between logs to allow combustion air to penetrate the stack of wood. 8. Check your flue for visible smoke from time to time. There should be only very faint smoke or, preferably no visible smoke, except for a 10 to 15 minute period after lighting or refuelling. Try adjusting the fuel load and air settings to minimise smoke. 9. Keep your heater and flue in good working order. Inspect annually.
2.3.2 (a) Community education campaigns Breathe the Benefits In the winter of 1997, the Commonwealth Government conducted a trial community education campaign entitled “Breathe the Benefits” aimed at reducing domestic woodsmoke emissions. The campaign was coordinated by Environment Australia in conjunction with the Department of Environment and Land Management in Tasmania, and the Department of Environmental Protection in Western Australia. The key messages of the campaign were as follows; to reduce wood-smoke from woodheaters: use dry, seasoned, untreated wood, stack wood under cover, use small logs, burn the fire brightly, and maintain a flame if burning overnight. The information was disseminated using: television ads, posters and a booklet composed of five infopostcards. The info-postcards included a competition quizzing readers on the woodheater operation tips. Distribution in Tasmania included a small run of ads and
Inquiry into Urban Air Quality in Australia
Residential and Local Sources
letterboxing of the info-postcards. Posters, info-postcards and an A4 wood-smoke information sheet were distributed in supermarkets on the day that the program was launched. Some of the posters and info-postcards were distributed in Tasmanian schools and Environment Tasmania officers organised a woodheater display at the annual Agricultural Festival, AGFEST. Materials were given to some concerned nursing staff from the University of Tasmania to distribute as well. In parallel with the Breathe the Benefits campaign, the Bureau of Meteorology in Tasmania, with cooperation of television stations, made a daily forecast of Launceston’s air quality and one of the five tips were run on the bottom of the screen. There has also been a surge in community action groups concerned about the problem of wood-smoke. For example, in 1997 two groups of concerned citizens the “Australian Lung Foundation” and “The Tasmanian Air Quality Study Group” have organised public forums on the topic of air pollution with a focus on wood-smoke in Launceston. In the past in Tasmania, the main community education effort initiated was associated with a Working Party examining the air pollution, environmental health and respiratory diseases in Launceston and the Upper Tamar Valley (Todd, 1992). Additional education efforts in Tasmania Independent of the Commonwealth trial a community-based education program designed to inform woodheater owners about how to reduce wood-smoke was conducted in Tasmania throughout the winter of 1997 as part of a Master of Environmental Management project. A primary goal of the program was to involve voluntary community groups in dissemination of information about woodheaters and wood-smoke, and encourage them to adopt the role of educators themselves. An education kit about the problems associated with wood-smoke and clear steps that can be taken to reduce wood-smoke was produced and given to eight voluntary community groups in Hobart and Launceston, Tasmania. The groups were asked to disseminate the information in any way they thought fit. The researcher was available to participate in dissemination and support of the groups. The information kit comprised of overheads for a seminar, an information booklet, and a pamphlet. The outcomes of the project included a number of public seminars organised by the groups, door knocking with information pamphlets by community groups, and information being published in numerous newsletters. Western Australia In Western Australia, the Department of Environmental Protection were already running an education campaign for the winter of 1997. They designed a small “pop-up” house (12cm x 10cm x 20cm) colourfully decorated with cartoon style graphics. Inside they placed educational materials about operating woodheaters correctly, about saving money on home heating, some advertising from competitive heating industries, and a competition quizzing readers on the woodheater operation tips. Thirty thousand ‘popup’ kits were printed and distributed. Four suburbs with wood-smoke problems and two suburbs with indications of becoming problem areas were targeted for distribution. Twenty thousand kits were letter box dropped in these regions. A further two thousand kits were given to a random selection of schools, four thousand were given to shopping centres to hand out and the remainder were available at the Department to give away when appropriate. A trial is also about to begin targeting the suppliers of wood to help them sell dry and seasoned wood. Fifteen moisture meters are to be distributed to volunteering local wood merchants to assist them in measuring moisture levels of their wood before sale. This trial is to commence in the near future. An information campaign to encourage woodheater operators to purchase wood in the summer is in preparation for the summer of 1998. The Commonwealth trial was a timely bonus for Western Australia and, like Tasmania, involved the distribution of the posters, infopostcards and television ads. The Commonwealth trial is currently being evaluated through pre and post campaign telephone surveys. Preliminary results (unpublished at time of writing) indicate that television ads were the best way to reach the most people in the community
Inquiry into Urban Air Quality in Australia
Residential and Local Sources
Queensland In Queensland, wood-smoke is not a significant problem because of the low use of woodheaters. However, the Brisbane EPA has produced two brochures in recent years on woodheater operation and there is currently an Air Quality Discussion paper available for submissions in which woodheaters are included. Since August 1997, air quality forecasting on the weather segment of the news has been running in Brisbane. Victoria In Victoria, little education on wood-smoke has been done in recent years apart from a couple of brochures. In July 1997, the Victorian EPA produced an information newspaper lift out on air quality in general, woodheaters were mentioned but the primary focus was on motor vehicles emissions. This lift out was accompanied by some television ads and a media release. ACT Environment ACT currently has wood-smoke information pamphlets available for the public in their department and council offices. Inspectors who are sent out to investigate wood-smoke complaints give the woodheater owner advice and educational material on how to operate their woodheaters correctly. Two years ago, Environment ACT conducted a media based woodheater education campaign involving television and radio. NSW In June 1997, the Environment Protection Authority in New South Wales launched a trial community participation program along with education materials to reduce smoke from wood fires and heaters. The program was the first voluntary wood-smoke curtailment program to be trialed in Australia. This technique has been used in some regions in the USA since the late 1980s. The program entitled “Don’t light tonight” involved taking information from the EPA’s air pollution data, the Bureau of Meteorology, and the University of New South Wales to predict days of high pollution and poor ventilation. On predicted high pollution days a media release was made by the EPA to request people, particularly with older heaters that do not comply with the Australian Standard AS 4013, to refrain from using their woodheaters and to utilise alternative heating sources. Over the winter of 1997, two curtailment request were issued, the first on June 11 and the second on August 29. Air quality measurements made on the night of the first request indicated a 20% decrease in pollution levels, although a single measurement of something as variable as PM10 is not reliable. To provide user information to woodheater operators, a pollution information telephone line was made available and information posters and brochures were distributed to local government and community groups. Information in suitable languages for local papers were distributed to local government. The Armidale City Council has been active in trying to address the wood-smoke problem they have in their region and have utilised a range of community education techniques. A council representative regularly visits schools and provides discussion and information to students. Council has presented posters at conferences. In response to complaints about wood-smoke, a council representative will visit the woodheater owner and discuss operation techniques and provide information brochures. Woodsmoke education brochures are produced and updated annually at the council for distribution. Each year they have some radio advertising conducted on the topic to increase awareness. SA The SA Environment Protection Agency (EPA) have an agreement with the Australian Wood Heating Association (WHA) that they, the WHA, will attend complaints made to local councils and they will provide educational information and advice on correct
Inquiry into Urban Air Quality in Australia
Residential and Local Sources
operation and maintenance of woodheaters. The SA EPA produced a pamphlet entitled "Smoke is No Joke" in February 1992 that has recently been updated. It is widely available from council offices and government departments. Internationally According to the Department of Environmental Quality in the USA, five Oregon communities have meet the Federal Clean Air 1994 for the air quality standards for particulate matter (PM10). Some of the strategies included voluntary wood burning curtailment programs on “red” days with poor ventilation, banning the sale of uncertified woodheaters, home weatherisation and woodheater replacement programs and a maintenance of public education programs. To generate interest in air quality, public awareness and education programs conducted included: public radio announcements; posters, brochures, bulk mailing, mail inserts; community meetings and individual contacts; a wood-smoke advisory telephone number; newspaper articles; advertising in newspapers and radio; distribution of wood-smoke health effects information; public speaking engagements and forums on PM10 and health effects, proper wood burning methods, and local ordinance requirements; coordination with woodheater and home heating dealers, government agencies and public service organisations. The public education and voluntary curtailment programs have been very successful in reducing PM10 pollution and in all areas have generated a high level of awareness and participation (DEQ 1997). Cost effectiveness None of the Australian community education programs have been running long enough to determine how effective they will be. The following calculation is entirely speculative, it simply shows what might be possible. If it is assumed that the number of households operating their heaters poorly is reduced from 60% of all woodheater using households to 20%, then there would be a reduction in wood-smoke from woodheaters of about 25% (Todd 1997). This equates to about a 15 300 tonne per year reduction in wood-smoke particles nationally. The Breathe the Benefits trial (see above) is costing about $75 000. Assuming a national community education program cost $250 000, this would mean the cost of reducing the emissions of fine particles from woodheaters would be around $16/tonne. 2.3.2 (b) Target poorly performing heaters The estimates of wood-smoke emissions contained in Appendix A suggest that at present a relatively small percentage of heaters (17%) are contributing about 33% of the smoke from woodheaters. While these estimates are only speculative, it seems most plausible that heaters which are operated very poorly or are burning very wet wood are contributing a disproportionately high load of particle emissions into urban areas. A drive or walk through neighbourhoods with many woodheaters shows quite clearly that a few heaters are emitting far greater quantities of visible smoke than the majority of operating heaters. There seems to be some reluctance by environmental agencies (including local government authorities) to take specific action against the householders with these very poorly performing heaters. This might be because of reluctance to interfere in what people are doing in their own homes, or it might be because existing legislation does not give specific powers or instruction on how to deal with this source of pollution. The problem is compounded because there is no instrument available that will give a quantitative measure of smoke in this situation, and relying on a visible assessment is subjective and strongly influenced by lighting and background conditions. One exception to the point raised in the above paragraph is the City of Armidale in NSW where local government officials do some patrolling in the evening looking for
Inquiry into Urban Air Quality in Australia
Residential and Local Sources
very smoky chimneys and then providing advice to the householder on how to operate their heater better. More widespread use of this approach might be effective. To try to estimate the cost effectiveness, assume one ‘smoke-patrol’ person could identify and leave literature for about three smoky woodheaters per hour at a cost of $35/h (including overheads, vehicle, etc.), and that 75% of the households targeted reduced their emissions from about 30 g/kg to 7 g/kg. Further, the improved use continued for 5 years. This computes to a cost effectiveness of about $35/t. In regions where annual firewood use is greater than the national average, such as Launceston, this becomes more cost effective. This approach could be extended to include a ‘dob in a smoky neighbour’ campaign. This might allow better targeting of poorly performing heaters, but it would still require inspection by a pollution control official and so would probably be no more cost effective than random sampling. It also lends itself to abuse by neighbours with other types of disagreements between themselves. For these reasons this approach is not recommended here. 2.3.3 Restricted use 2.3.3 (a) Total ban A total ban on the use of woodheaters (and open fireplaces) would certainly solve the wood-smoke problem, but it raises an awkward question of compensation. The National gun buy-back scheme sets a precedent for compensation of owners of objects when they are asked to give them up for the national good. The compensation cost would be large. With 800 000 woodheaters in use, and an average current value of, say, $1000, the total cost would be $800 million. Householders might well be faced with costs exceeding $1000 to install an equivalent capacity gas, oil or electric heater, plus increased running costs. It seems unlikely that a total ban would be possible. 2.3.3 (b) Ban on installation of new heaters Rather than ban the use of existing heaters, another approach might be to ban the installation of any new heaters, and give a 10 year ‘period of grace’ before introducing a total ban. This approach was mentioned as worthy of consideration in the NEPC discussion paper (NEPC 1997, p.186). This would overcome the problem mentioned above of compensating owners of heaters, but it introduces difficult issues of what to do with the woodheater industry, i.e. the manufacturers, retailers, installers, etc. The Wood Heating Association (1997, p3) estimates that the industry generates 4000 direct jobs across the country. Removing woodheaters (and open fireplaces) from the domestic heating scene would improve urban air quality, but it would mean an increase in Greenhouse gas emissions and eliminate a modest local industry. It would also increase heating costs considerably in many smaller cities and rural areas where firewood is cheap. 2.3.3 (c) No-burn days Wood-smoke problems occur when dispersion is poor, although neighbours of homes with poorly operated or designed heaters may suffer smoke pollution at other times. It is possible to predict periods of poor dispersion as part of normal weather forecasting. The Bureau of Meteorology in Launceston, for example, has a model which forecasts periods of high smoke. These forecasts could be used to suggest to householders that they make additional efforts to reduce emission of air pollutants, i.e. a voluntary change of behaviour. For homes with woodheaters or open fires and alternative forms of heating, householders might choose not to burn firewood until forecast dispersion improved. A tougher approach would be to ban the use of open fireplaces or woodheaters during forecast periods of poor dispersion This would create problems for people with no
Inquiry into Urban Air Quality in Australia
Residential and Local Sources
alternative heating as poor dispersion often coincides with cold, clear evenings and nights. Low indoor temperatures are linked to health problems, so such a ban might reduce the health problems associated with smoke, while increasing health problems associated with inadequate heating. The costs and benefits of voluntary and compulsory bans on firewood use during forecast periods of poor dispersion have not been calculated. 2.3.4 Firewood Modern woodheaters are designed to burn at their cleanest with ‘air-dry’ firewood (roughly 15 to 20% moisture, wet weight basis). Once the moisture content exceeds about 25%, the emissions start to increase significantly. It is not known how much wet firewood is used or sold, so it is difficult to know whether there is a widespread problem. Anecdotal information suggests that there is a moderate problem (i.e. most woodheater owners have had occasional wet loads delivered, or know others who have had problems). It would be possible to make it illegal to sell wood as firewood with greater than 25% moisture content. This would need to be policed, either through random checks or in response to consumer complaints (probably a mix of both would be most effective). An approximate check can be made with an electronic probe on-the-spot. Wet, or marginal samples could be collected for accurate assessment using drying and weighing methods. It has only been possible to make an extremely rough estimate the cost/benefit of introducing and enforcing dry firewood legislation. Emissions increase two to fourfold when wood with 35% moisture is burnt (unpublished estimate, Todd pers comm). If only 5% of firewood is too wet, then there would be very roughly 5000 tonnes extra particulate matter (PM10) emitted per year, compared to using air dry wood. [Estimate based on 5% of 5 million tonnes of firewood, i.e. 250 000 tonnes wet wood, with each tonne of wet wood producing an extra 20 kg of particles (e.g. an emission factor of 30 g/kg instead of 10 g/kg).] If it cost $50 000 per year to police controls ($10 000 in each southern state) the cost effectiveness would be $10 per tonne of particles avoided. This seems promising, but is an extremely rough estimate. Further study of this option appears warranted. 2.3.5 Taxes and levies It has been suggested that there should be a tax or levy on woodheater owners ($50 annual tax, Sunday Mercury 20 July 1997), which would serve as a disincentive to use woodheaters. It might also be seen as a ‘polluter pays’ levy. In practice, this might prove very difficult to administer because there are not reliable registers of woodheaters or open fires which local or state governments could use to apply the tax. What should be done about homes with brick fireplaces which might never or rarely be used? The tax/levy approach is considered impractical at this stage. Another approach might be to introduce a ‘pollution tax’ on firewood. This would be more equitable than the tax on appliances because the tax paid would be roughly proportional to pollution produced. However, this would also present serious problems of implementation. About half the firewood used in Australia is collected by the end user (Todd et al. 1989). The remainder is supplied through a large number of small businesses (fuel merchants, wood cutters, farmers). It also seems impractical to tax firewood. 2 3 6 Reducing CO and NOx
Inquiry into Urban Air Quality in Australia
Residential and Local Sources
Much of the above discussion has focussed on reducing particle emissions from woodheaters. This is because, in Australia, most of the research and routine appliance monitoring has been restricted to particle emissions (reflecting the emission standard, which only applies to particles). Overseas research, particularly from Canada, suggests that carbon monoxide and particle emissions show good correlation, although this has not been observed in Australian research (Quraishi 1987). However, it is likely that measures to reduce particle emissions would also reduce carbon monoxide emissions, but probably not in the same proportion. The link between NOx and particles in woodheater emissions is even more tenuous. No information is available on the NOx emissions of cleaner burning models of woodheater compared to older 'dirty' models. 2.4
Open fires
Open fireplaces have received less attention from environmental agencies than controlled combustion woodheaters. This might be because they tend to be used for shorter periods (i.e. not left burning 24 hours per day) or only used occasionally. However, emission factors for open fireplaces are higher than for the new designs of woodheater. During periods of poor dispersion, open fireplaces could contribute significant amounts of particles, carbon monoxide and nitrogen dioxide to local airsheds. There are no design features that will reduce the emissions from conventional masonry fireplaces. Control would have to be through restricted use (see 2.3.3 above) or avoiding wet firewood (2.3.4 above).
Inquiry into Urban Air Quality in Australia
Residential and Local Sources
3. EMISSIONS FROM DOMESTIC COMBUSTION OF NATURAL GAS. Natural gas and liquid petroleum gas are used widely throughout urban Australia. They are used for space heating, water heating and cooking. Gas is considered a preferred fuel for domestic use because it burns relatively cleanly and is easy to transport (in areas where gas mains are present) and control. As discussed in this section, gas use in the residential sector only makes a minor contribution to air pollution loads. The main urban air pollution issues associated with gas combustion are nitrogen dioxide and fugitive gas (i.e. leakage of gas from mains). 3.1
Appliance Emissions
Emissions from gas appliances were calculated from the number of households in each capital city (ABS 1996) and the percentage of homes that used natural gas for cooking, space heating and hot water (ABS 1986). The energy load for each type of appliance for each city was estimated from AGL data for Sydney and Canberra and assumed to apply to other cities according to climatic area. Hot water and space heating percentages for homes in Sydney, Canberra and Darwin were taken from state figures from Environmental Issues: People’s Views and Practices. (ABS 1994). These were used because the ABS 1986 report was without data for Darwin, and the Sydney and Canberra figures had too great a discrepancy when compared to recent AGL marketing data. Discrepancies between the ABS data and the actual appliance frequencies are most likely for Perth, Darwin, Sydney and Canberra because of market growth. The appliance populations in Melbourne, Brisbane and Adelaide were assumed to be reasonably well established or stable in frequency because of the greater market penetration. The following emissions characteristics for gas appliances were used. Nitrogen oxides were estimates from AGL’s Camperdown Research Laboratory, sulfur dioxide was estimated from the sulfur content (10 mg S/m3) of odorised natural gas reaching Sydney, and carbon monoxide, particles and volatile organic compounds were calculated from US EPA emission factors (Boyle et al. 1996) using a natural gas heating value of 38.8 MJ/m3. The emission rates were as shown in Table 3.1. Table 3.1: Emission factors for each type of gas appliance Emissions (ng/J) CO SO2 Cookers Hot water heaters Blue flame space heaters Radiant space heaters Bowin Design Lo-NOx
17 17 17 17 17
0.52 0.52 0.52 0.52 0.52
NOx
VOC
PM10
20 60 20 10 3.5
3.1 3.1 3.1 3.1 3.1
4.7 4.7 4.7 4.7 4.7
The assumed percentage of homes that used gas for a particular purpose was as shown in Table 3.2. Table 3.2: Percentage of homes in each city that use gas for a specific purpose % of homes
Sydney
Melbourne
Brisbane
Adelaide
Perth
Hobart
Darwin
Canberra
Inquiry into Urban Air Quality in Australia
Cooking Hot water Heating
26 20 20
62 53 69
Residential and Local Sources
23 14 0.4
52 48 33
37 31 21
1 0 3
0 2 5
5 20 46
The annual energy load for each type of appliance was estimated (see Table 3.3) (from the AGL 1995 Household Appliance Survey (Sydney and Canberra), with estimates for other cities based on similar climates). Table 3.3 Annual appliance energy load (GJ/year) Load (GJ/year)
Cooking Hot water Heating
Sydney
Melbourne
4 16 10
Brisbane
4 22 38
4 16 10
Adelaide
4 16 10
Perth
4 16 10
Hobart
4 22 38
Darwin
Canberra
3 8 10
3 22 38
This data, along with the 1996 Census on households, provided the means to then estimate the contribution of pollutants from the domestic combustion of natural gas and LPG for various types of gas appliances in each capital city’s airshed. The following three tables for cooking (Table 3.4), hot water (Table 3.5) and space heating (Table 3.6) show emissions for carbon monoxide, sulfur dioxide, nitrogen oxides, volatile organic compounds and particulate matter 10 microns or less. When all the emissions are combined, the total contribution of each type of pollutant can be determined (Table 3.7). Table 3.4 Emissions from gas cooking Cooking
(t/year) CO SO2 NOx VOC PM10
Sydney
24 1 20 4 7
Melbourne
Brisbane
49 2 42 9 14
9 0.3 7 2 3
Adelaide
15 0.5 13 3 4
Perth
12 0.4 10 2 3
Hobart
0 0 0 0 0
Darwin
0 0 0 0 0
Canberra
0 0 0.2 0 0.1
Table 3.5 Emissions from gas hot water heaters Hot Water
(t/year) CO SO2 NOx VOC PM10
Sydney
71 2 259 13 20
Melbourne
218 7 794 41 62
Brisbane
21 1 76 4 6
Adelaide
53 2 194 10 15
Perth
38 1 139 7 11
Hobart
0 0 0 0 0
Darwin
0 0 0.3 0 0
Canberra
8 0.2 28 1 2
Table 3.6 Emissions from gas space heating Heating
(t/year)
Sydney
Melbourne
Brisbane
Adelaide
Perth
Hobart
Darwin
Canberra
Inquiry into Urban Air Quality in Australia
CO SO2 NOx VOC PM10
42 1 23 8 12
484 15 567 90 138
Residential and Local Sources
0 0 0.1 0.1 0.1
22 1 25 4 6
16 0.5 12 3 5
1 0 0.5 0.2 0.4
0 0 0.1 0 0.1
30 1 36 6 9
Table 3.7 Total emissions from natural gas appliances for each city Total
Sydney
(t/year) CO SO2 NOx VOC PM10
Melbourne
137 4 302 26 39
Brisbane
751 23 1403 140 215
Adelaide
30 1 83 6 9
Perth
90 3 232 17 26
Hobart
66 2 160 12 19
1 0 1 0.2 0.4
Darwin
Canberra
0 0 0.4 0.1 0.1
38 1 64 7 11
When comparing the last four tables, it can be seen that hot water heaters are a major contributor to total emissions. 3.2
Contribution to Airshed Inventory
Table 3.8 indicates that most emissions are not significant when compared to the total airshed inventory. The only pollutant of concern, when compared to the approximate inventory for each city, is oxides of nitrogen in Melbourne. Except for Melbourne, the contribution of each pollutant is less than 0.5% of total contributions and therefore is not considered significant as a pollution source. However, with the expected growth in natural gas because of its large greenhouse advantages and ease of use, a larger market penetration could provide a significant contribution to the airshed. Table 3.8 Significance of emissions from gas appliances in each city Total (kt/year)
CO SO2 NOx VOC
Sydney 1992
800 20 100 170 3.3
%
0.02 0.03 0.30 0.02
Melbourne 1990
%
800 0.09 15 0.16 80 1.75 170 0.08
Brisbane 1993
400 22 65 75
%
0.01 0.00 0.13 0.01
Perth 1992
250 18 45 55
%
0.03 0.01 0.36 0.02
Greenhouse Advantages
It was once felt that leakage from low pressure distribution systems negated any greenhouse advantage from natural gas. This may have been true in the early 1990s, for Sydney and its domestic customers. Other cities, such as Melbourne, would have had tighter low-pressure distribution systems. In Sydney in 1991/92, natural gas leakage was 80 000 tonnes per annum of natural gas or 1.6 million tonnes per annum of carbon dioxide equivalent greenhouse gas. Domestic customers in Sydney on natural gas would have saved around 1.5 million tonnes per annum of greenhouse gas by not using electricity, leading to no greenhouse benefit.
Inquiry into Urban Air Quality in Australia
Residential and Local Sources
Currently in 1997, the natural gas leakage is around 26 000 tonnes per annum of natural gas, or about 0.5 million tonnes per annum of greenhouse gases. This leakage will further decrease because of AGL’s mains rehabilitation program. Sydney now has 40% of households on natural gas, saving 1.6 million tonnes per annum of carbon dioxide equivalent greenhouse gas to provide a net benefit of around 1.1 million tonnes per annum. The important point to note is that if all of Sydney’s 1.3 million homes used natural gas, there would be a further saving of 2.6 million tonnes per annum for a potential net benefit of more than 3.7 million tonnes per annum. These are significantly large savings based on the average home use of natural gas, not its maximum potential home use. These savings could be extrapolated to other cities such as Melbourne, Perth and Adelaide. In a study of greenhouse benefits and leakage (Bavaro and Saxby 1995) it was shown that leakage is a fixed cost of the system. Therefore, even for existing natural gas distribution systems with excessive leakage, for any additional gas appliance added to the system there would not be an associated increase in leakage. Therefore the full greenhouse benefit from that appliance would apply. The study (Bavaro and Saxby 1995) looked at the states of New South Wales, South Australia and Victoria. The greenhouse emissions of an all-electric household in NSW and SA that changed to natural gas for cooking, heating and hot water, neglecting the base electric load, could reduce its CO2-equivalent emissions from 9 tonnes per annum to 2.6 tonnes per annum. Similarly in Victoria the change would reduce the emissions from 17 tonnes per annum to 2.8 tonnes per annum. The use of natural gas when substituted for electricity would thus produce 3 to 6 times less CO2-equivalent emissions than is currently the case. Natural gas as a domestic fuel helps Australia meet its international greenhouse gas obligations. It is of national interest to develop strategies that will increase the domestic use of natural gas for the full flow on of its benefits. 3.4
Gas Industry Regulation
The gas industry is regulated under the various gas acts of the state governments of Australia. These Acts give the gas utilities powers of entry to premises, the ability to disconnect gaseous fuel burning equipment, issue defect notices and, where necessary, discontinue the supply of gas. These powers are overseen by an authority within each state’s Department of Energy (or equivalent department). Disconnection and discontinuance of supply would occur where the gaseous fuel burning equipment or its installation does not comply with the Australian Gas Association (AGA) codes referred to in the Regulations of the Act. The Australian Gas Association is the national gas industry body representing gas utilities, gas producers, pipeline companies and appliance manufacturers. The AGA codes ensure the safe use of a highly useful indigenous energy source, used by industry, commercial premises and domestic dwellings throughout Australia. Gas burning equipment that does not meet AGA requirements does not receive AGA approval. Equipment without AGA approval will not be sold by vendors. Gas industry inspectors are allowed under the Act to disconnect unapproved appliances, with discontinuation of gas supply for continued non-conformance to the industry codes. 3.5
Control measures
The only emission of real significance for urban air quality from domestic gas appliances is nitrogen oxides from hot water heaters. Hot water heaters generally have a 10 year life The Table below shows that the replacement of hot water blue flame
Inquiry into Urban Air Quality in Australia
Residential and Local Sources
burners with the low NOx hot water burner could, in ten years through natural attrition, reduce appliance NOx emissions to insignificant levels. In Melbourne, with its large space heating load, it might be necessary to consider the use of low-NOx burners in flued space heating as well, although this option would take longer to take effect because of the lower turnover of these appliances. During the 1980s, the gas industry carried out research into lower emitting domestic appliances. Research by Unisearch at the University of New South Wales, the Gas Research Institute in the United States and by Bowin Designs in Australia have produced cooktop and heater burners that emit either lower nitrogen dioxide or lower total nitrogen oxides. Heater burners normally come in blue flame or surface combustion (radiant heater or Schwank burner) varieties. The blue flame heaters have a hotter flame and therefore produce more total nitrogen oxides, with emissions around 20 ng/J for space heaters and 60 ng/J for hot water heaters. Bowin Designs developed a llow-NOx burner suitable for space heaters and hot water heaters that had total nitrogen oxides at less than 5 ng/J. Unisearch developed a burner that reduced cooktop nitrogen dioxide emissions from 15 ng/J to 10 ng/J. The Gas Research Institute, by using ceramic inserts, is believed to have produced lower cooktop emissions. One control strategy would be to introduce this new technology to control emissions of oxides of nitrogen. The benefits of a low NOx burner, such as the Bowin Design burner with total NOx emissions of around 3.5 ng/J compared to the 20 ng/J to 60 ng/J emissions of radiant and blue flame burners, are shown in Table 3.9. There is a dramatic reduction in the contribution by natural gas hot water heaters to the total NOx, to levels that could be considered very acceptable. Table 3.9 Contribution of nitrogen oxides by gas appliances to city airsheds. Hot NOx Total Airshed Water Contribution NOx Contribution (t/a) (t/a) (%) City Normal Low-NOx Normal With LowNormal With LowHot Water NOx Hot NOx Hot Option Water Water Sydney 286 15 302 58 0.30 0.06 Melbourne 794 46 1403 655 1.75 0.82 Brisbane 76 4 83 12 0.13 0.02 Perth 139 8 160 30 0.36 0.07 The Bowin Design Low-NOx burner, at an additional retail cost of $40, could be used in these appliances with significant reductions in NOx emissions. This would be most effective in hot water systems because of the quick 10 year replacement cycle. The total number of natural gas hot water heaters based on the ABS data is around 1.3 million, however an estimate that takes into account market growth since 1986 would increase this figure to 2 million. Replacement of hot water heaters, with the additional cost of the Bowin Design burner, would increase the total cost of replacement of the annual turnover by $5 million to $8 million per annum (Table 3.10). Table 3.10 Estimate of Additional Cost for NOx Reductions from Gas Hot Water Heaters Total number of gas hot water heaters (est.) 1.3 to 2 million Replacement annually (at 10% p.a.) (est.) 130,000 to 200,000
Inquiry into Urban Air Quality in Australia
Replacement cost (at $900 per heater) (est.) Low NOx burner additional cost ($40 per burner)
Residential and Local Sources
$120 mill. to $180 mill. $5 mill. to $8 mill.
Using the best case example, a $40 investment in a low NOx burner on a water heater would reduce NOx emissions by 60 ng/J. On the basis of one household using 20 GJ of gas for water heating per year, and a 10 year life for the water heater, the cost of NOx reduction would be $3300/t. The Australian Gas Association domestic flueless space heater standard for nitrogen dioxide was lowered to 15 ng NO2/J in 1987, 10 ng/J in 1990 and 5 ng/J in 1991. In 1991, this effectively removed unmodified blue flame flueless space heaters from the market. In a similar manner, the gas industry could possibly reduce emissions from hot water heaters. The Australian Gas Association through its Environment Committee and Air Quality Task Force, in conjunction with appliance manufacturers, could investigate the feasibility of using lower NOx burner designs in more of its appliances, especially water heaters. The AGA and the gas industry have a proven track record in researching and controlling emissions from appliances and should be able to effectively reduce emissions through industry self regulation.
Inquiry into Urban Air Quality in Australia
4
Residential and Local Sources
OIL HEATING
The use of heating oil as a domestic fuel declined rapidly in Australia following the 1978 move to world parity oil pricing (i.e. large increase in oil prices). There are now just 3 to 4% of homes using oil heaters as their main heat source. Present sales of heating oil in Australia are around 110 ML per year (AIP 1996), a substantial drop compared to the 990 ML used 20 years ago (AIP 1977). Emission factors for domestic heating oil, based on NPi and USEPA data, are: CO NOx Particles (PM10) SO2 VOCs
0.6 kg/kL 2.2 “ 0.3 “ 1.7 “ 0.085 “
It is not known if these emission factors include the lighting phase, when the heating element in oil heaters seems to cause some evaporation of oil (odour) before ignition takes place. In the cool climate zones, it would require around 1500 L of heating oil to deliver 40 GJ heating to a home (appliance efficiency 70%). This seems higher than the quantities used in practice, but for the purpose of this exercise it will set an upper limit for air pollution effects. If average daily consumption is 8 L (180 days), then it is possible to estimate emissions of the priority pollutants using the rough method outlined in section 1.4.2. With 5% of homes using oil-fuelled heaters, the worst case contribution is: carbon monoxide nitrogen dioxide sulphur dioxide particles
0.15 µg/m3 compared to limit of 10 mg/m3 (10 000 µg/m3), i.e.