Reservoir Characterization of Water Zone above Oil-Water Contact in a Carbonate Reservoir, Offshore Abu Dhabi* Christophe Bassem Maalouf1, Irina Baca Espinoza1, Nusrat Afrin Afzal1, Jorge Costa Gomes1, and Salem Al-Jaberi1 Search and Discovery Article #41833 (2016)** Posted August 22, 2016
*Adapted from extended abstract prepared in relation to oral presentation at GEO 2016, 12th Middle East Geosciences Conference and Exhibition, Manama, Bahrain, March 7-10, 2016. Bahrain: Please refer to related article by first author and colleagues, Search and Discovery Article #41834 (2016). **Datapages © 2016. Serial rights given by author. For all other rights contact author directly. 1
ADMA-OPCOd, Abu Dhabi, UAE (
[email protected])
Abstract In a green field offshore Abu Dhabi, a carbonate reservoir layer is water-bearing across the entire field and is above the oil-water contact. This water zone is overlain by an oil-bearing zone. The existence of such a zone poses a great risk of early water breakthrough for wells completed in the oil zone. Hence, it is essential to understand the dynamic behavior of the water zone and of the corresponding oil-water interface. To characterize this zone and the oil-water interface, a pilot-hole was drilled and an extensive data gathering program was successfully executed. The well was logged (GR, Resistivity, Nuclear Magnetic Resonance (NMR), Density & Neutron) and cored across the zone of interest; Wireline Formation Testing (WFT) pressures were acquired; oil and water zones were sampled; and a Vertical Interference Test (VIT) was conducted between oil and water zones. Horizontal and vertical plugs were taken from the recovered cores every foot for Conventional Core Analysis (CCA). Thin sections were prepared for each plug to describe its texture, and Mercury Injection Capillary Pressure (MICP) was performed on trims taken from the plugs. The core description showed the existence of a thin stylolitic interval between the water and oil zones. CCA results showed similar porosities in water and oil zones but a much higher permeability in the oil zone than in the water zone. This permeability contrast is also characterized with NMR log. Thin sections described the water zone reservoir texture as a wackstone and the oil zone reservoir texture as a vuggy packstone to grainstone. MICP showed that the water zone reservoir is mainly microporous. Finally, the Vertical Interference Test established that there is a dynamic communication between oil and water zones. Therefore, we conclude that the water zone is caused by microporosity and not by a dynamic barrier. Hence, it does not represent a risk of water breakthrough for development wells. After integration of all available data, we found that WFT, NMR, and density/neutrons logs are sufficient for reservoir characterization of such water zones.
This paper showcases a special case where a water zone is present above the oil-water contact and presents extensive data gathering results that helped to characterize its behavior. The development of other fields with similar water zones can greatly profit from our study to optimize their development plans. Introduction The field was discovered by Well-1 in 1971 and was subsequently appraised with 9 wells drilled between 1975 and 2003. The reservoir is a layer-cake, oil-wet carbonate with 6 productive layers interbedded with 5 baffles in the oil zone and one micro-porous low-permeability layer at the bottom (Figure 1a and 1b). Productive layers are ~10 ft thick, whereas baffles are ~2 ft thick; Layer-B is ~24 ft thick. These layers are continuous laterally across the field. Based on appraisal wells, Layer-A is oil-bearing, but Layer-B, just below it, is water-bearing across the entire field even when located above the FWL. Since oil development wells were planned to reach Layer-A, it was critical to characterize the static and dynamic properties of LayerB in order to optimize the field development strategy. Ahead of the start-up of field development, two deviated pilot holes were drilled for data gathering. One of the main objectives of these pilot-holes was to understand the dynamic communication between oil and water-bearing layers. Therefore, extensive data gathering plan was performed to fully characterize Layer-B. Pilot holes were cored across this interval. CCA and MICP were subsequently performed in laboratory. These layers were covered by Neutron-Density and NMR wireline logs. WFT was used to acquire pressure and mobility across Layers A and B. Fluid was sampled from Layer-B to confirm water. Finally, a VIT was made to check the dynamic communication between Layers A and B. Depositional environment The reservoir layers were deposited during Early Cretaceous under warm tropical conditions optimal for carbonate production and deposition. Core and petrographic descriptions revealed that eleven sequences were deposited in four different depositional environments: Intertidal, SemiRestricted Lagoon, Subtidal and Open Shelf. Figure 2 shows possible depositional environments interpreted for Layers A and B. Cores and Thin Sections The difference in textures between Layers A and B is clearly seen in the core (Figure 3). A few vugs can be seen in Layer A. A stylolite pressure solution feature separates Layer-A from Layer-B. From petrographic and core description analysis, Layer-A consists mainly of grain-supported packstone which is commonly leached, undifferentiated skeletal grains with variable microporous, micritic and peloidal matrix (Figure 4). The textural features and allochems observed are indicative of shallow, intertidal deposition in a tidal flat environment.
Layer-B fabrics are wackestone, wackestone-packstone, and packstone. Evidence of slight dolomitization is observed in thin sections. Bioclasts of bivalves, occasional gastropods and stromatoporoids are also present. Moderate intensity of bioturbation and burrows are seen from the cored intervals. Calcitic fractures associated with stylolites are also observed at the base of Layer-B. Evidence from texture and fossil content indicates deposition of Layer-B in low-energy, shallow-water and semi-restricted lagoonal setting (Figure 5). Faults The Arabian platform consists of simple and large folds due to the structural development of the area. Folding occurred due to reactivation of basement faults that are in north-south direction. Adding to that, the formation of Hurmuz salt basin, with subsequent salt tectonics, caused salt doming and affected the structures in the studied area. As a result of orogeny, the studied field underwent principal horizontal compressional stress (PHS) in the northwest-southeast (NW-SE) direction and extension in northeast-south west (NE-SW) which created the normal extension faults in the NW direction for the studied field, as shown in Figure 6. The faults were interpreted from seismic and were seen to have a very small throw with a dip of ~90°. Formation Evaluation from OH Logs The full set of wireline conventional Triple Combo Logs (radioactive Neutron - Density and Resistivity logs) was acquired in all appraisal wells. In some cases, Sonic, NMR, and Resistivity Image Logs were also acquired. The results of open hole log interpretation show that, in all wells above FWL, Layer-A is oil-bearing and the underlying Layer-B is water-bearing (-see Figure 7). Nuclear Magnetic Resonance (NMR) In a pilot-hole drilled recently, an NMR log was acquired with the full set of wireline logging. NMR relaxation of hydrogen nuclei can be used to determine the distribution of reservoir fluids within a porous medium in relation to pore size. In a sample saturated fully with brine, the magnetization decay from NMR source is proportional to the pore size where a single exponential decay reflects a single pore. Smaller pores have faster magnetization decay times, which correspond to shorter T2 when compared to larger pores. Depending on the difference between relaxation times (T1, T2) and diffusivity (D) of different fluids, porosity and hence saturation can be quantitatively evaluated. Moreover, the permeability of the formation can be qualitatively estimated based on empirical and core-based models, derived as a function of spectralporosity measurement and pore sizes, with assumption from laboratories studies. Identification of the mobile from the immobile fluids, using a T2 cut-off, essentially defines the micro porosity from other types of porosity. The effective porosity, considering no clay content in this carbonate reservoir, is the same value as the Free Fluid Index (FFI), which is analogous to the NMR total porosity subtracted by the Bulk Volume Irreducible (BVI). The BVI corresponds to the volume of Swirr; hence the FFI represents the porosity of the rock available to contribute to fluid flow. This is crucial to understand the dynamic behavior of water in Layer-B. Unlike conventional open hole log interpretation of porosity and fluid saturation, NMR interpretation is less affected by borehole rugosity and mud cake, thanks to the tool design and its vertical resolution, which is higher than conventional logs. In the current study the permeability model was calibrated with WFT mobility.
Figure 8 shows the NMR data: Gamma Inversion, Partial Porosity distribution, T2 Intrinsic properties, Diffusivity, T2 Apparent, T1, and 2 D Cross-Plots. In the second to last track, the NMR-derived Permeability Index is compared with WFT mobility and with permeability derived from Stoneley waves. The last track shows interpreted fluid saturation: BVI water (light blue), Movable water (dark blue), Flashed oil (yellow), and Oil (green). Based on the T2 cut-off and on partial porosity results, we can see a clear contrast between porosity systems of Layers A and B. Pore distribution in Layer-B is mainly unimodal micro-porosity. Irreducible water is present in Layer-B; nevertheless, most of this water is movable. Conventional Core Analysis Recent pilot-holes were cored across our zone of interest and CCA study was made. Figure 9 shows that core porosity is generally in agreement with log porosity, especially in Layer-B. Although porosity in this layer is high (~20%) and comparable to porosity of Layer-A (~20-30%), its permeability is very low (~1 to 5 mD). In contrast, permeability of Layer-A is ~5-200 mD. Mercury Injection Capillary Pressure Pore Size Distribution One of the main objectives of MICP is to find the distribution of pore size, which is an area-equivalent diameter of the throats connecting the pore system. MICP was done on trims, taken from core plugs, from Layers A and B. Figure 10 shows the Pore Size Distribution (PSD) in these layers. It is clear that Layer-B is characterized mainly by micro-porosity, with PSD distributed around 0.5 microns. Conversely, Layer-A PSD covers a wide range between 0.1 and 10 microns. Height-Saturation Function An important application of the concept of drainage capillary pressures, attained from MICP, relates to the initial fluid distribution in a reservoir. Although the capillary pressures from MICP reach an unrealistic 5000 psi, they cannot be directly representative of the actual reservoir capillary pressure without knowing the maximum capillary pressure above the FWL. In this section we describe the conversion of the drainage capillary pressures into height-saturation function by using Equation 1 and Skelt-Harrison saturation method, Equation 2, for each height above the free water level (HAFWL). The first step is to identify the maximum hydrocarbon column from the shallowest depth of the reservoir to the FWL, which is a total of 90 ft. Converting
to height uses Equation 1 up to a maximum of 90 ft.
Quantifying the maximum capillary pressure for the given reservoir unit uses the above equation. It is apparent that approximately 12 psi is the maximum equivalent capillary pressure for 90 ft HAFWL [top of Layer-A], signifying that the measured drainage capillary pressures beyond 12 psi is ignored in subsequent saturation modelling. Visual representation is presented in Figure 11. Skelt-Harrison Saturation Method Drainage capillary pressure data was measured at multiple depth domains within the same reservoir to capture the general heterogeneity of the two most apparent carbonate cycles, Layers A and B. Estimating the saturation profile along the entire reservoir interval, a Reservoir Rock Typing [RRT] scheme was implemented to link Pc dynamic behaviors with specific porosity-permeability values. Out of 12 Pc curves in Layer-A, and 8 Pc curves in Layer-B, 6 RRTs were established, based on similar dynamic behaviors, and they would best represent that range of petrophysical properties. For each of the 6 RRTs, an individual saturation function using the Skelt-Harrison method was developed, as shown in Equation 2, where h is HAFWL and A, B, C and D are coefficients to match the experimental capillary pressure data to open-hole log data. Once the saturation models were established for each RRT, the next step was to assign the Skelt-Harrison accordance to the permeability ranges of the plug samples, as shown in Table 1.
function for a given HAFWL in
Using drainage capillary pressure curves obtained from MICP, we generated a water saturation height function for the well under study and compared the results with open-hole-derived water saturation. The Skelt-Harrison saturation model is comparatively good at capturing the same saturation distribution fluctuations as that of the saturation derived from resistivity. The results are illustrated in Figure 12. WFT Pressure and Fluid Sampling After coring and triple-combo logging, pressure points were recorded with WFT across Layer-B. Figure 13 shows that pressure points fall on the same water gradient (0.51 psi/ft). This proves the likely dynamic continuity of this layer. Mobility range was ~2-11 mD. Additionally, a fluid sample was collected in this layer from Well-11 after 6.6h pumping. During this period, 92 liters of fluid were recovered. Laboratory analysis of collected fluid confirmed that it was formation water. Vertical Interference Test The VIT is one of the pressure testing options of WFT, which deploys by combination of dual packer (DP) and single probes (SP). The maximum pressure drawdown initiated with DP across one of the formation can be monitored with SP located in the other formation. If the pressure disturbance from one pump-out element is seen through observation element, the communication between layers is established.
Conversely, if disturbance in pressure is not noticeable, then most probably there is no hydraulic communication between layers. The derivative of pressure build-up in the end of the test might help to estimate Kv/Kh ratio and horizontal permeability (Kh) if the radial flow is reached. In our case, two VITs were completed. VIT-1 was made within Layer-A to estimate its permeability. VIT-2 was made between Layers A and B in order to check the dynamic commination between them. The VIT-1 was performed in Layer-A using two SP probes (Figure 14). One SP was set top of Layer-A and the other was set 9.5ft deeper and was used as a pressure observation gauge. Pumping fluids from the probe set at the top of Layer-A generated a pressure drop of 250 psi and resulted in 3.3 psi pressure drop at the observation probe; this confirms the vertical communication within the tested zone (Figure 15a). The pressure derivative analysis (Figure 15b) estimates a horizontal permeability of ~70mD and vertical permeability of ~35mD. VIT-2 was made across Layers A and B using a SP and a DP (Figure 16). The DP was set in Layer-B, and observation SP was set 10ft shallower in Layer-A. The pressure drop of 250 psi at the DP generated by pumping fluids resulted in 2.8 psi pressure drop at the observation probe, thus confirmed the vertical communication between the tested zones (Figure 17a). The pressure derivative analysis was challenging as pressure build-up has not reached the radial flow (Figure 17b). A 3-layer model was built for pressure transient analysis (PTA). The three layers were Layer-A, Layer-B, and a thin layer to represent the stylolite in between. The results of VIT-1 were used as input for Layer-A in the interpretation of VIT-2 data. PTA estimated the permeability of Layer-B at ~2.4 mD, and the permeability of the stylolite layer at ~0.4 mD. Production data Three horizontal oil producers were recently completed in the oil zone with their toe in Layer-A. Well-1 toe’s vertical distance to top of LayerB is ~6ft; the well was put on stream ~9 months ago; it started with dry oil production, but its water-cut gradually increased to 4%. Well-2 toe’s vertical distance to top of Layer-B is ~8ft; the well was put on stream ~8 months ago and is still producing dry oil. Well-3 toe’s vertical distance to top of Layer-B is only ~3ft; the well was put on stream ~4 months ago but experienced early water breakthrough, and its water-cut is now around 15%. Since these wells are located at the top of the structure, the produced water is unlikely to be from the flanks. Therefore, the vertical distance of oil producers’ toes to the top of Layer-B seems to be the main parameter driving the water breakthrough in this early production phase. Conclusions The water zone found above the Oil-Water contact was characterized by extensive data gathering: Log interpretation showed that this zone was water-bearing. However, logs also showed good porosity in this interval. Therefore, it was not clear why this layer was water-bearing. NMR log confirmed that this layer is water-bearing and that it contains moveable fluid. The fluid content was also confirmed by both WFT pressure gradient and by fluid sampling.
The water zone was cored. Core description revealed the existence of a thin stylolite layer separating it from the above oil zone. CCA showed that, although the water zone has good porosity, its permeability is poor. To evaluate the dynamic role of the stylolite, VIT tests were performed; they revealed that the stylolite allows dynamic communication between the oil and water zones. Oil producers completed in proximity of this layer showed that early water breakthrough is dependent on the vertical distance from their toe to top of water zone. Acknowledgments The authors thank ADMA-OPCO for their support to complete and publish this study. Nomenclature BVI = D = DP = FFI = FWL = GR = HAFWL K = Kh = Kv = MICP = NMR = CCA = OH = Phi = PSD = SP = Swirr = Ti = VIT = WFT =
Bulk Volume Irreducible Diffusivity Dual Packer Free Fluid Index Free Water Level Gamma Ray = Height Above Free Water Level permeability, mD Horizontal Permeability, mD Vertical Permeability, mD Mercury Injection Capillary Pressure Nuclear Magnetic Resonance Conventional Core Analysis Open hole Porosity, fraction Pore Size Distribution Single Probe Irreducible Water Saturation Relaxation Time Vertical Interference Test Wireline Formation Tester
Selected References Ahmed, T., 2006, Reservoir Engineering Handbook: Gulf Professional Publishing, 2006, 1376p. Al-Amrie, O.Y., M.A. Ben-Saad, K.I. Al Marzouqi, A.H. Kshirsagar and S.B. Coskun, 2012, The use of formation tester to characterize the permeability and vertical communication across the stylolite zones in carbonate reservoir, in Sustainable Energy Growth: People, Responsibility, and Innovation.: Society of Petroleum Engineers, AbuDabi International Petroleum exhibition and Conference 2012 (ADIPEC2012), p. 666-681. Chen, S., G. Ostroff and D. T. Georgi, 1998, Improving estimation of NMR Log T2 cutoff value with core NMR and capillary pressure measurements: SCA 9822. Website accessed July 10, 2016, http://www.ux.uis.no/~s-skj/ipt/Proceedings/SCA.1987-2004/1-SCA1998-22.pdf. Funk, J., S. Siddiqui, M. BaTaweel, et al., 2000, Laboratory techniques to characterize NMR diffusion in carbonates: Society of Core Analysts (SCA), v. 3, p. 2000. Gomes, J,C. and A. AlSumaiti, 2014, Reservoir rock typing using NMR & centrifuge: SCA2014-096, 6p. Website accessed July 10, 2016, http://www.jgmaas.com/SCA/2014/SCA2014-096.pdf. Harrison, B. and X. Jing, 2001, Saturation height methods and their impact on volumetric hydrocarbon in place estimates: SPE 71326, 12p. Website accessed July 10, 2016, http://www.ux.uis.no/~s-skj/Svalex2004/prelim/00071326.pdf. Kasap, E., K. Huang, T. Shwe and D. Georgi, 1999, Formation-rate-analysis technique: combined drawdown and buildup analysis for wireline formation test data: SPEREE, June 1999, v.2/3, p. 273. Lyne, A., G. Varini and G. Ghilardotti, 1996, Determination of petrophysical properties of carbonate rocks by NMR relaxometry: SPE 36852MS, 9p.Se
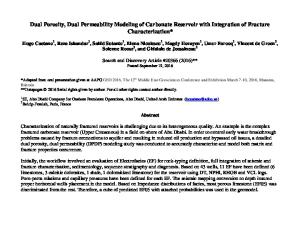
(a)
(b)
Figure 1. (a) East-west reservoir cross section. Oil-bearing reservoir layers are pictured in light green. Grey layers are low-porosity layers within the oil zone. Layer-A is the bottom layer in the oil zone. Layer-B is the light blue layer. This layer is micro-porous and is characterized by high porosity and low permeability. It separates the water zone from the oil zone. The dark blue layer is the permeable water zone. (b) Map of exploration and appraisal well locations with oil-water contact at top of reservoir.
OUTER SHOAL
•
+
+
" "
INNER SHOAl
UPPER INTERTIDAl FACIES
+
t
III