EUROPEAN COMMISSION
Brussels, 4.3.2014 COM(2014) 112 final
REPORT FROM THE COMMISSION TO THE EUROPEAN PARLIAMENT AND THE COUNCIL on the implementation of the provisions concerning producer organisations, operational funds and operational programmes in the fruit and vegetables sector since the 2007 reform ("Report on the fruit and vegetables regime") {SWD(2014) 54 final}
EN
EN
TABLE OF CONTENTS 1.
The 2007 reform........................................................................................................... 3
2.
National strategies for sustainable operational programmes ....................................... 4
3.
Sector development: relevant issues ............................................................................ 5
4.
Producer organisations ................................................................................................. 5
5.
Operational funds and EU financial support for operational programmes .................. 7
5.1.
Total expenditure under operational programmes and EU financial assistance .......... 7
5.2.
National financial assistance and EU reimbursement.................................................. 9
6.
Operational programmes: measures and types of actions implemented ...................... 9
7.
Member States’ mid-term evaluation of their national strategies .............................. 11
7.1.
Progress made towards objectives set for operational programmes .......................... 11
7.2.
Weaknesses in the management of national strategies .............................................. 12
7.2.1.
Weaknesses in the setting-up of national strategies................................................... 12
7.2.2.
Weaknesses in the monitoring and evaluation of national strategies......................... 13
8.
Conclusions and recommendations............................................................................ 13
2
REPORT FROM THE COMMISSION TO THE EUROPEAN PARLIAMENT AND THE COUNCIL on the implementation of the provisions concerning producer organisations, operational funds and operational programmes in the fruit and vegetables sector since the 2007 reform ("Report on the fruit and vegetables regime") 1.
THE 2007 REFORM
Producer organisations (POs) became the cornerstone of the EU regime for the fruit and vegetables (F&V) sector in the 1996 reform. The aim was to strengthen the position of producers in the face of a greater concentration of demand and to integrate environmental concerns in the production and marketing of F&V. For the first time, POs could receive EU support in the form of a contribution to the operational funds needed to implement operational programmes. The 2007 reform aimed to strengthen the POs further. A wider range of tools was made available to enable them to prevent and manage market crises. Incentives were created to encourage mergers between POs, associations of POs (APOs) and transnational cooperation. There was special emphasis on protecting the environment, with POs required to include a minimum level of environmental spending in their operational programmes. For the first time, MSs had to establish a national strategy for sustainable operational programmes, integrating a specific environmental framework. The 2007 reform also removed export refunds in the sector and decoupled aid for fruit destined for processing. Aid to encourage producer groups to establish themselves and make investments so as to become fully-fledged POs within five years was limited to MSs which joined the EU on 1 May 2004 or thereafter, the outermost regions, and the smaller Aegean Islands. This report complies with Article 184(4) of Council Regulation (EC) No 1234/20071. It is based primarily on information Member States (MSs) provided on the implementation of the EU fruit and vegetables scheme on their territory and, in particular, on information in the annual reports and evaluation reports sent to the Commission2. These are mainly based on data for 2008-20103. The CAP 2020 reform does not introduce major changes into the EU regime for the F&V sector, to the extent that the EU support is still granted to POs only through operational 1
2
3
Council Regulation (EC) No 1234/2007 of 22 October 2007 establishing a common organisation of agricultural markets and on specific provisions for certain agricultural products (Single CMO Regulation) (OJ L 299, 16.11.2007, p. 1). Reports sent to the Commission in accordance with Article 97(b) and Article 127 of Commission Implementing Regulation (EU) No 543/2011 of 7 June 2011 laying down detailed rules for the application of Council Regulation (EC) No 1234/2007 in respect of the F&V and processed F&V sectors (OJ L 157, 15.6.2011, p. 1). For some MSs, the annual reports for 2010 are still considered provisional. Following data quality checks by the Commission some amendments are likely.
3
programmes, with two important exceptions: (a) association of POs may now set up an operational fund, with the financial contributions from the associated POs and the EU financial assistance and (b) the extension of the set of crisis prevention and management (CPM) instruments4. A further significant amendment is the shift of the EU aid to producer groups from the first to the second pillar and making it available for all MSs5.
2.
NATIONAL STRATEGIES FOR SUSTAINABLE OPERATIONAL PROGRAMMES
Following the 2007 reform, 23 MSs established national strategies for sustainable operational programmes (NSs), which include a national framework for environmental actions (NEF)6. All NEFs have taken on board amendments required by the Commission7. However, the procedure of appraisal by the Commission of the NEFs proposed by MSs as well as the revision of the proposals following the Commission's requests for amendments constituted an important administrative burden for both the Commission's departments and the competent national authorities. Commission Implementing Regulation (EU) No 543/20118 establishes precise requirements regarding the monitoring and evaluation (M&E) of operational programmes by POs and of NSs by MSs including common performance indicators9, and MSs’ annual reports. Those requirements take account of recommendations the European Court of Auditors made shortly before the 2007 reform10. The evaluation requirements for Member States included the carrying out of a mid-term evaluation of their NS in 2012. To ensure coherence of the M&E system, the Commission has developed a common understanding of the M&E requirements on operational programmes and NSs11. This has been accompanied by software developments, including a system for applying automatic data quality controls to MS annual reports and a database of annual reports as from 2004, allowing for ad hoc analyses. New webpages on the F&V regime on the Commission’s Europa website give public access to NSs, NEFs and reports on 2012 evaluations12.
4
5
6
7 8 9
10 11
12
Two new CPM instruments have been included: (a) investments making the management of the volumes placed on the market more efficient and (b) replanting of orchards where that is necessary following mandatory grubbing up for health or phytosanitary reasons on the instruction of the Member State competent authority. Moreover, exchange of best practices has been added to the existing training measures. The Common Agricultural Policy is composed of two pillars: market measures and direct payments (first pillar) and rural development policy (second pillar). Article 103f of Regulation (EC) No 1234/2007. Estonia, Lithuania, Luxembourg and Slovenia are exempted from the obligation to establish a national strategy since they have no recognised POs. Article 103f(1), second subparagraph of Regulation (EC) No 1234/2007. OJ L 157, 15.6.2011, p. 1. MSs may specify in their NS additional indicators, reflecting national or regional needs, conditions and objectives specific to the operational programmes. European Court of Auditors’ Special Report No 8/2006 (OJ C 282, 20.11.2006, p. 32). The documents, in all EU languages, include guidelines on the common performance indicators, a new template for the annual report to be sent by MSs and guidelines on the 2012 evaluation of NSs by MSs. See http://ec.europa.eu/agriculture/fruit-and-vegetables/country-files/index_en.htm.
4
3.
SECTOR DEVELOPMENT: RELEVANT ISSUES
In 2003-2010 there was a gradual, slight decline in the total EU area cropped with F&V (6 %) and a sharper fall in the number of holdings with F&V crops (-39.1 %). These were steeper than the declines in the total utilised agricultural area (U.A.A.) and the total number of agricultural holdings (-0.7 % and -20.0 % respectively). Similar trends occurred in the EU-15 (-6.3 % for F&V area and -26.3 % for F&V holdings) and in the EU-12 (-5.1 % and -47.7 %). In general, there has been a rise in the average area cropped with F&V per holding (up to 1.9, 3.0 and 0.8 hectares, respectively, in the EU-27, EU-15 and EU-12), as a result of the concentration of production in a lower number of holdings13. In 2004-2010, there was also a small fall in the volume of F&V production in the EU (a -3 % decrease in average F&V production in 2008-2010 as compared to 2004-2006). In the same period, the value of F&V production, at current prices, rose slightly (a +6.5 % rise in the average value of the F&V production in 2008-2010, against 2004-2006)14. Persistent market uncertainties for some products are another relevant development after the 2007 reform. Market crises emerged in 2009 (e.g. peaches and nectarines, tomatoes) and in 2011 (E. coli crisis followed by a new market crisis for peaches and nectarines). Finally, in several MSs, the 2008 financial and economic crisis may have affected domestic F&V consumption (resulting in lower demand), access to export markets and credit, input costs and other factors15 that may have influenced the performance of POs and their operational programmes.
4.
PRODUCER ORGANISATIONS
In 2010, there were 1 599 recognised POs in 23 MSs16. Some preliminary conclusions regarding the possible impact of the 2007 reform can be drawn17: Increased organisation rate. In 2008-2010, the share of the total value of EU F&V production marketed by POs/APOs grew further. In 2010, the organisation rate was about 43.0 % (43.9 % if producer groups are also included).
13
14
15
16 17
Source: EC-DGAGRI-C.2 — calculations from results of Eurostat’s Farm Structure Surveys 2003 to 2010. Nota bene: the reduction in the number of the holdings is partially caused by a methodological change, since in 6 MSs (CZ, DE, LU, PL, SK et UK) the threshold for inclusion in the FSS increased between 2007 and 2010, with the exclusion of holdings with a small U.A.A. Source: EC-DGAGRI-C.2 — calculations from results of Eurostat’s Annual Crop Statistics and Economic Accounts for Agriculture 2004 to 2010. Nota bene: the decreasing trend calculated for the volume of F&V production between the two periods (2004-2006 and 2008-2010) may have been affected by the very good harvest recorded in 2004. These are effects/threats that are mentioned, for instance, by the reports on 2012 evaluation of the National strategy for sustainable operational programmes notified by HU, IT and PT. Estonia, Luxembourg, Lithuania and Slovenia have no recognised POs. See Table 1 in the Commission Staff Working Document for details.
5
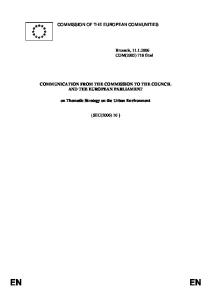
Chart 1: Fruit and vegetables sector — Organisation rate by MS (2010) Legend:
Producer groups
Producer organisations
100% 90% 80% 70% 43.0% + 0,9% (PGs)
60% 50% 40% 30% 20% 10%
Nederland
Belgique/België
Ireland
Sverige
Česká republika
Deutschland
España
Danmark
Italia
France
EU
Österreich
United Kingdom
Latvia
Malta
Kypros
Portugal
Elláda
Magyarország
Polska
Suomi/Finland
Slovensko
Bulgaria
Romania
Slovenija
Lituania
Luxembourg
Estonia
0%
Source: EC-DGAGRI-C.2 — calculations from data transmitted by MSs (Annual Reports 2010).
(a)
Improved attractiveness of POs. The share of total F&V producers that are member of POs has continued to increase (from 10.4 % in 2004 to 16.5 % in 2010).
(b)
Increased attractiveness of APOs. As compared to the situation before the reform, in 2008-2010 there was not only a faster rise in the number of APOs (55 in 2010) but also a substantial increase in the number and share of POs that are member of APOs (459 and 28.7 %, respectively, in 2010).
However, in several MSs: •
the organisation rate remains low (see Chart), with POs that are small both in number of producer members and in total value of market production, and
•
only a limited number of F&V producers are members of a PO. Thus, most producers are excluded from the direct benefits of the EU regime for the F&V sector18.
Moreover, despite progress made at the national level, in some Member States there are still significant regional imbalances in the degree of organisation of F&V producers. An example of that is Italy, where the relatively high national organisation rate (about 47%) is the result of
18
Certain non-organised producers benefit from the current EU regime. They can market their products through POs without being members and take advantage, against payment, of certain services provided by POs (e.g. access to storage and marketing facilities, crisis management measures).
6
the high organisation rate of some northern regions and the low organisation of several other regions19. Different factors may limit the development of POs in some regions or even entire Member States20. They include historically linked sociological patterns as lack of mutual trust, systematic suspicion and the temptation of taking advantage of the efforts done by others without paying the price (free rider behaviour). Grey economy may be also a further key reason for not joining POs: not paying taxes (in particular VAT) make that non organised farmers obtain higher profit (under grey economy) than the ones belonging to POs which are obliged to respect the legal framework. In addition, many producers sell exclusively in local or regional markets or through direct sales and therefore are less concerned by the benefits that the POs could bring them. Another possible obstacle to the development of POs is represented by the complexity of the procedures for obtaining recognition as a PO, for having an operational programme approved and, subsequently, for having access to the public financial aids21. This complexity can discourage small producers who do not have the necessary competences or consider that the advantages of adhering to the regime are lower than the administrative costs associated. A further factor that reduces the attractiveness of POs may be the perception by producers that there are very high risks of losing the public financial aids, which can put the survival of a PO at jeopardy. Thus, respect of recognition criteria, especially minimum number of members, democratic control, placing of products on the market and outsourcing, is critical for a PO to maintain its recognition22. EU
5.
OPERATIONAL PROGRAMMES
5.1.
Total expenditure under operational programmes and EU financial assistance
FUNDS
AND
FINANCIAL
SUPPORT
FOR
OPERATIONAL
POs in the F&V sector may set up an operational fund, which must be used only to finance operational programmes approved by the MSs. The fund is financed by the financial contribution of the PO’s members or the PO itself and EU financial assistance23. A twofold ceiling applies to the EU financial assistance24:
19 20
21
22
23 24
See Table 2 in the Commission Staff Working Documents for details. A recent study on EU cooperatives (which embraces also POs and APOs), financed by the European Commission, identifies some of the historical, cultural and economic obstacles to the development of joint initiatives amongst farmers (See Bijmans, J et alt (2013): Support for farmers' cooperatives: final report. European Commission available on http://ec.europa.eu/agriculture/externalstudies/2012/support-farmers-coop/fulltext_en.pdf). These include the submission of an aid application and the compilation of a detailed annual report which is an essential tool for monitoring the implementation of the F&V scheme but, on the other hand, also an administrative burden. Over the period 2004-2010, the majority of withdrawals of recognition took place in ES (148), FR (94) and IT (43). As a percentage on the total number of POs, withdrawals of recognition were particularly high in SI, IE, FI and BG. Article 103b of Regulation (EC) No 1234/2007. Article 103d of Regulation (EC) No 1234/2007.
7
(1)
it is capped at 4.1 % of the value of the marketed production of the PO (that percentage may be increased to 4.6 % if the amount in excess of 4.1 % is used solely for crisis prevention and management measures); and
(2)
it cannot be higher than 50 % of the actual expenditure incurred, a ceiling that may be increased to 60 % in certain cases, such as for operational programmes that are submitted by POs in MSs that joined the EU on 1 May 2004 or thereafter (for measures running until the end of 2013), in MSs where the POs market less than 20 % of F&V production or in the outermost regions.
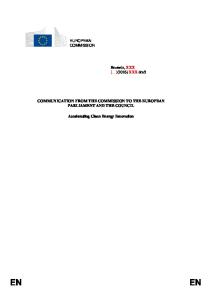
Chart 2: Total expenditure under operational programmes and EU financial assistance (2004-2010) Legend:
Total expenditure (€m)
EU financial assistance (€m)
Source: EC-AGRI-C.2 — calculations from data transmitted by MS (Annual Reports 2004-2010).
Chart 2 shows that, with the 2007 reform, there has been a substantial increase in the total expenditure on operational programmes and the related EU financial assistance. Some preliminary conclusions regarding the possible impact of the 2007 reform can be drawn25: •
both the number and the share of POs that implemented an operational programme has risen with the reform (about 3/4 of the total number of recognised POs in 20082010);
•
the increase in expenditure for operational programmes including the EU financial assistance is associated with a rise in both the number and the average economic size (value of products marketed) of POs with an operational programme;
•
even with the 2007 reform, overall EU financial assistance remains below the ceiling of 4.1 % of the value of the marketed production of the POs concerned and still
25
See Tables 3 and 4 in the Commission Staff Working Document for details.
8
accounts for a very small percentage (1.1–1.3 %) of the total value of EU F&V production. •
The biggest POs (about 18 % of all POs, with a turnover of more than € 20 m) receive about 70 % of the EU financial assistance. Such an asymmetric distribution of EU assistance is inherent in the mechanism of the support, which increases with the value of the marketed production.
5.2.
National financial assistance and EU reimbursement
Based on Article 103e of Regulation (EC) No 1234/2007, the Commission authorised certain MSs to pay national financial assistance (NFA) to POs operating in regions where the degree of organisation26 of producers in the F&V sector is particularly low. At the request of the MSs concerned, the NFA granted has been partially reimbursed by the EU27. In 2008-2010, only six MSs (ES, HU, IT, PT, RO and SK) used this instrument, with average total annual aid of € 12.2 m, partially reimbursed by the EU. Although other MSs have regions that could comply with the NFA requirements (low degree of organisation), they have chosen not to make use of it. This may partly be because MSs need to finance all or part of the aid granted. Before the Commission authorises the granting of national financial assistance or its partial reimbursement, cross-checks with data from previous requests and from the annual reports are done. When inconsistencies are found, the procedure is suspended until the errors are corrected (in the annual reports and / or in the NFA request). The swiftness of the decision by the Commission depends on the promptness of the National Authorities in correcting the inconsistencies detected. The current procedure is very cumbersome for the national authorities. In some cases, there is a considerable delay from the Member States in sending accurate information. Therefore, although there is a deadline for the Commission to approve the NFA authorisation decisions, this deadline is always extended due to the need for clarifications, corrections and explanations. The NFA reimbursement requests follow the same path.
6.
OPERATIONAL PROGRAMMES: MEASURES AND TYPES OF ACTIONS IMPLEMENTED
Table 4 indicates that, in 2008-2010, the annual expenditure for operational programmes (€ 1 252.1 m on average) mainly concerned actions to improve marketing (24.0 % of the total) and environmental actions (23.8 %), followed by actions to plan production (22.2 %) and to improve or maintain product quality (20.3 %).
26
The degree of organisation of producers is defined as the ratio between the value of F&V production obtained in the region and marketed by POs, APOs and PGs and the total value of the F&V production obtained in the region. The NFA is additional to the operational funds of the POs and equal to a maximum of 80 % of the financial contribution of the PO’s members or of the PO itself to its operational fund.
27
This is only possible in regions where POs market less than 15 % of the value of F&V production and whose F&V production represents at least 15 % of their total agricultural output.
9
The use of crisis prevention and management instruments was very low (€ 35.6 m; 2.8 % of total average annual expenditure), and even lower for training and advisory services or for research and experimental production. As regards the types of actions implemented in operational programmes (OPs) in 2008-2009: •
Expenditure for physical investments (on the POs’ premises or on the holdings of POs’ members) accounted, on average, for € 517.5 m (41.3 % of the total expenditure for OPs). They aimed mainly to improve product marketing (15.9 % of total expenditure; in 64.1 % of the OPs) and planning of production (15.4 %; in 56.6 % of the OPs), followed by improving or maintaining product quality (5.6 %; in 29.6 % of the OPs). On average, physical investments for environmental purposes28 accounted for 3.0 % of total expenditure (and were included in 34.5 % of the OPs).
Table 4: Expenditure for operational programmes devoted to different measures and number of POs having included different measures in their operational programmes (average 2008-2010) Expenditure % of total €m expenditure
POs concerned Number
% of total
Actions aimed at planning of production
277,9
22,2%
924
77.8 %
Actions aimed at improving and maintaining product quality
254,7
20,3%
1 097
92.4 %
Actions aimed at improving marketing
300,9
24,0%
1 009
85.0 %
Research and experimental production
10,7
0,9%
130
11.0 %
Training and advisory services
22,8
1,8%
388
32.7 %
Crisis prevention and management instruments
35,6
2,8%
192
16.2 %
298,3
23,8%
1 103
92.9 %
51,0
4,1%
1 063
89.6 %
100,0%
1 187
100.0 %
Environmental actions Other actions
1 252,1
All operational programmes
Source: EC-AGRI-C.2 — calculations from data provided by MSs (Annual Reports 2008-2010).
•
Environmental actions were implemented in 92.9 % of the OPs, with average total annual expenditure of € 298.3 m, corresponding to 23.8 % of the average total annual expenditure for OPs. The main types of actions implemented regarded waste reduction and management (€ 78.0 m; in 34.2 % of the OPs) and integrated production (€ 72 m; in 25.4 % of the OPs) which together covered about 2/3 of the total expenditure for environmental actions, followed by physical investment for environmental purposes (€ 38.1 m; in 34.5 % of the OPs). In August 2012, support to environmental actions related to management of packaging was abandoned, based on the experience gained in applying those actions. This is expected to encourage the implementation of more cost-effective
28
Physical investments for environmental purposes are investments in fixed assets that are expected to result in substantial benefits in terms of reduced use of inputs and/or reduced emissions of pollutants.
10
environmental actions and to reduce the costs related to the management of the Union regime29. •
The (very low) use of crisis prevention and management (CPM) instruments mainly concerned harvest insurance (average annual expenditure of € 13.9 m in 67 OPs), promotion and communication (€ 11.9 m in 60 OPs) and product withdrawal (€ 8.3 m in 73 OPs). Green harvesting, non-harvesting, training and setting up of mutual funds were virtually not used. Besides the complexity of procedures, a possible reason for the very low use of CPM instruments can be found in the small size of many POs: due to the low volumes of products covered, the low amount of support for market withdrawal and/or the limited financial means at their disposal, small POs consider the current CPM tools as ineffective or simply not attractive.
7.
MEMBER STATES’ MID-TERM EVALUATION OF THEIR NATIONAL STRATEGIES
19 MSs sent the Commission a report on the 2012 evaluation of their national strategy. The reports provide a first, mid-term assessment of the effects of the operational programmes implemented after the 2007 reform and point out weaknesses identified in the management of some NSs. 7.1.
Progress made towards objectives set for operational programmes
The following conclusions can be drawn from the analysis of the 2012 evaluation reports sent by BE, CY, CZ, DK, DE, ES, FR, HU, IT, NL, AT, PT and UK30: (1)
In most MSs, operational programmes are contributing positively to key objectives, such as promoting the placing on the market of PO members’ products, ensuring that production is adjusted to demand (in terms of quality and quantity) and improving competitiveness of POs.
(2)
In some MSs, operational programmes are also contributing to boosting the commercial value of products marketed by POs (e.g. CY, CZ, DE, HU, IT, UK) and promoting concentration of supply (e.g. CY, CZ, DK, ED, HU, IT, PT).
(3)
The reasons why operational programmes in other MSs are contributing little or nothing to boosting the commercial value of products marketed by POs or promoting concentration of supply may include the persistently low bargaining power of existing POs in the distribution chain due to their small number and size in some MS
29
See Commission Implementing Regulation (EU) No 755/2012 of 16 August 2012 amending Implementing Regulation (EU) No 543/2011 as regards the eligibility of specific costs of environmental actions under operational programmes of producer organisations in the fruit and vegetables sector (OJ L 223, 21.8.2012, p. 6).
30
Chapter 5 of the Commission Staff Working Document provides an overview of the effects of the operational programmes in the 13 Member States concerned. Reports sent by other MSs (Bulgaria, Finland, Poland, Romania, Slovakia and Sweden) do not provide clear answer to all evaluation questions regarding the effectiveness of operational programmes. The reasons are the very few operational programmes approved under the new regime (e.g. only 1 PO with operational programme in Bulgaria and Romania) and the scarcity of reliable data on the effects of those programmes.
11
concerned (e.g. PT) and the already high rate of organisation attained by the sector in other MSs concerned (e.g. NL). (4)
Operational programmes appear to be contributing little or nothing to the following objectives in most MSs: –
Optimising production costs. Based on evaluation reports, this probably has more to do with external factors, such as the rise in input prices (e.g. BE-VL, FR), or the difficulty of estimating and reporting changes in costs, due among other things to ignorance of the baseline situation, than with it not being a key concern for POs and/or their members.
–
Stabilising producer prices. Some reports (e.g. ES, FR, IT) indicate that this is mainly due to the low effectiveness of certain crisis management and prevention instruments available and/or the use of those instruments by too limited a number of POs.
–
Improving the attractiveness of POs. Reports indicate different reasons for the limited growth or even decline in membership, such as the very high level of organisation already attained in the sector (e.g. BE-VL), the very stringent requirements set for joining a PO (e.g. NL) and even the lack of clarity of certain rules set out by the EU legislation (e.g. UK).
–
Little or no contribution is being made to some environmental objectives, such as landscape preservation, climate change mitigation, preserving air quality and reducing waste production. While in some cases this is because of the low or non-existent uptake by POs or their members of dedicated actions (e.g. DK), in other cases it is because some of those objectives were not among the priorities of the NEFs (e.g. CY, CZ, PT). Moreover, for certain MSs (e.g. BE, ES, FR, NL), the report on the 2012 evaluation exercise indicates that there is no clear evidence that operational programmes are contributing to those environmental objectives.
7.2.
Weaknesses in the management of national strategies
7.2.1.
Weaknesses in the setting-up of national strategies
The reports have identified two important weaknesses in the NSs of some MSs: •
Too wide a range of objectives was adopted, instead of focus on a few priorities. This led to a large number of measures and types of actions being selected as eligible for support. One of the reasons for this was that stakeholders were not involved enough in the definition of the NS. As a result, POs implemented only a small number of measures and types of actions effectively, contributing only to certain objectives or, conversely, public support was spread over many actions aimed at different objectives, the result and impact of which were difficult to grasp.
•
Precise pre-defined targets were lacking for the different objectives set. This was one of the main difficulties for the 2012 evaluation exercise, due to the absence of
12
benchmarks against which the performance of measures supported could be assessed in a non-arbitrary way. 7.2.2.
Weaknesses in the monitoring and evaluation of national strategies
The reports from several MSs also indicate that a major difficulty for the 2012 evaluation exercise was the large number of incorrect records of performance indicators in the annual reports of POs. This not only hampered certain analyses but also risked undermining the validity of the conclusions from the evaluation. This appears to be the result of two important weaknesses regarding the M&E systems for the national strategies set up by the MSs concerned: (a) lack of preventive measures to help POs to understand, correctly calculate and use certain pre-defined performance indicators and (b) lack of checks by the national administration on the data recorded by POs in their annual reports and, in particular, regarding performance indicators. This suggests that in some MSs, the focus was essentially or exclusively put on the indicators of financial execution (expenditure), with little or no attention given to indicators that could help to measure progress towards objectives set in the national strategy. 8.
CONCLUSIONS AND RECOMMENDATIONS
In 2008-2010, at EU level, there were positive trends regarding the organisation rate of the F&V sector, the share of total F&V producers who are members of POs and the number of POs members of APOs. The annual reports and the 2012 evaluation reports also offer a more contrasting picture. A crucial issue is the persistently low degree or lack of organisation in some MSs. This needs careful analysis with a view to identifying, where appropriate, additional measures to encourage not only a further rise in the degree of organisation of producers in the whole EU but also a decrease of the imbalance of F&V producers' organisation within the EU. A low degree or lack of organisation also means that most F&V producers do not belong to a PO, so they do not directly benefit from specific EU aid for the sector. This proportion is highest in some southern Member States and some MSs that joined the EU in 2004 and later. Those producers, frequently the smallest, cannot even benefit from the services that POs could provide, have very weak bargaining power within the supply chain and are more exposed to the risks linked to market globalisation and climate change. Increasing the rate of organisation of the F&V sector remains crucial especially in Member States where the organisation is still very low. In this respect, there is also the need to explore measures to stimulate forms of cooperation to help PO's and non-organised producers to better deal with those challenges. Operational programmes could contribute more to key objectives such as improving attractiveness of POs, boosting products’ commercial value, optimising production costs, and stabilising producer prices.
13
The (very low) use of crisis prevention and management (CPM) instruments has revealed the limits of certain existing instruments. The improvement of the instruments of prevention and management of crisis needs to be considered. In most MSs, expenditure for ‘strategic’ measures, such as research and experimental production, remains negligible. Therefore, it could be relevant to reinforce the application of the resources available on certain priority measures, which have a stronger impact on competitiveness, income stability and market demand. Complexity of rules and lack of legal certainty have also been indicated as weaknesses of the current regime. Simplification and securing the legal framework need to be a priority in a future revision, also for reducing the red tape for farmers and managing authorities. Finally, the introduction of new measures for the sector might require the reallocation of some financial resources without increasing the overall amounts available for the sector in order to ensure the budget neutrality within market measures in pillar 1. To address the above-mentioned shortcomings, the current EU F&V regime needs to be reviewed to ensure that support for producer organisations is better focused so that it can achieve the overall objectives set for the 2007 reform31 and CAP 2020 in all Member States. The Commission could build upon the results of this report and the upcoming debate to present at a later stage legislative proposals to revise the Union aid scheme for the fruit and vegetables sector.
31
See in this respect the recital 2 of Council Regulation (EC) No 1182/2007 (OJ L 273, 17.10.2007, p. 1), the provisions of which were integrated in Regulation (EC) No 1234/2007.
14