RELATIONSHIP BETWEEN RICE SAMPLE MILLING CONDITIONS AND MILLING QUALITY Z. Pan, K. S. P. Amaratunga, J. F. Thompson
ABSTRACT. The objective of this study was to evaluate the effect of milling conditions on milling quality of medium grain rough rice M202. Using a McGill No. 3 mill, the conditions studied were milling weight and duration, and polishing weight and duration. This research examined the relationships among the milled rice quality parameters, namely total rice yield, head rice yield, whiteness index, and total lipid content. Head rice yield was more sensitive to changes in milling conditions than total rice yield. It decreased by 4.6 percentage points when milling weight was increased from 2.72 to 6.36 kg. Milling weight and milling duration had more influence on head rice yield than polishing weight and duration. For both milling and polishing, using lower weights for a longer duration could increase head rice yield without changing the whiteness compared to the standard procedures of the USDA Federal Grain Inspection Service. The total lipid content of milled rice, measured using a near‐infrared (NIR) method, correlated well with the whiteness index. This indicates that the NIR method could be used as an alternative to the whiteness index for measuring the degree of milling. Over‐milling significantly decreased head rice yield with little improvement in whiteness. The milling quality of M202 can be predicted by using the developed non‐linear regression models when the milling and polishing conditions are known. Keywords. Degree of milling, Head rice yield, Milling, Quality, Rice, Temperature, Total rice yield, Whiteness.
V
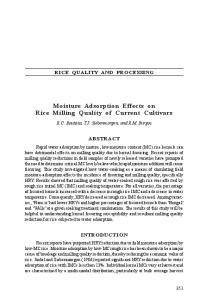
arious laboratory rice mills that simulate com‐ mercial milling conditions have been used to measure the milling quality of rough rice. The McGill No. 3 mill is the only official laboratory mill specified in the standard rice sample milling procedures of the USDA Federal Grain Inspection Service (USDA‐ FGIS, 1994) that is currently used in the U.S. However, the standard rice sample milling procedures specify different milling and polishing weights (pressures) for rice produced in the Western and Southern regions. We are aware of no comprehensive scientific documentation describing the ef‐ fect of milling and polishing conditions of the McGill No. 3 mill on milling quality, even though it is the only mill speci‐ fied in the official rice sample milling procedures. For official rice milling quality appraisal, a 1000 g rough rice sample is first shelled to remove the hulls and obtain brown rice (USDA‐FGIS, 1994). The brown rice is then milled with the McGill No. 3 mill in a batch process. The mill consists of a cutter bar (a lobed shaft), a weight and lever as‐ sembly, and a milling chamber (fig. 1). The pressure in the
Submitted for review in February 2006 as manuscript number FPE 6361; approved for publication by the Food & Process Engineering Institute Division of ASABE in May 2007. The authors are Zhongli Pan, ASABE Member Engineer, Research Engineer, Processed Foods Research Unit, USDA‐ARS Western Regional Research Center, Albany, California, and Associate Adjunct Professor, Department of Biological and Agricultural Engineering, University of California, Davis, California; and K. S. P. Amaratunga, ASABE Member Engineer, Post‐Doctoral Researcher, and James F. Thompson, ASABE Member Engineer, Extension Specialist, Department of Biological and Agricultural Engineering, University of California, Davis, California. Corresponding author: Zhongli Pan, Processed Foods Research Unit, USDA‐ARS Western Regional Research Center, 800 Buchanan St., Albany, CA 94710; phone: 510‐559‐5861; fax: 510‐559‐5851; zpan@ pw.usda.gov.
milling chamber is generated by the weight and lever arm as‐ sembly pressing a saddle against the top cover of the cham‐ ber. The cutter bar provides cutting and frictional force for removing the bran layer and germ from the rice kernels. Mill‐ ing occurs in the chamber due to the relative motion between the rotating cutter bar and the rice kernels, and among rice kernels, while the batch is under pressure. The weights speci‐ fied in the FGIS procedures vary with rice varieties (long, medium, and short grains) and the regions where rice is pro‐ duced. For medium grain rice, the FGIS milling procedures require that a rice sample be exposed to a 30 s milling cycle using a 4.54 kg (10 lb) or 3.18 kg (7 lb) milling weight for rice produced in the Western or Southern regions, respectively. After the first milling cycle, the weight is reduced to 0.98 kg (2 lb) for Western rice and to zero for Southern rice; thereaf‐ ter, the rice is milled again for an additional 30 s, which is nor‐ mally referred to as the polishing cycle. After the polishing cycle, the milled rice is unloaded and visually compared with a standard “well‐milled” sample. The polishing cycle may be repeated to achieve “well‐milled” rice. Well‐milled rice is defined as whole and broken kernels of rice from which the hulls and practically all of the germ and the bran layer have been removed (USDA‐FGIS, 1994). This Lever arm Milling or polishing weight
Cutter bar
Milling chamber
Figure 1. McGill No. 3 mill setup.
Transactions of the ASABE Vol. 50(4): 1307-1313
2007 American Society of Agricultural and Biological Engineers ISSN 0001-2351
1307
definition is qualitative rather than quantitative. The term “degree of milling,” referring to the quantity of bran and pol‐ ish removed from brown rice during rice milling, has been used to quantify “well‐milled” rice. Juliano (1985) and Wadsworth (1994) reviewed the methods used in research and commercial applications for measuring the degree of milling. The measurement methods include determining the amount of bran removal, the residual remaining endosperm, the chemical composition of milled rice and bran, and the physical properties of the milled rice. A typical measure of chemical composition is lipid content in the removed bran or milled rice. The physical property measurement mainly de‐ termines the optical properties, such as whiteness or degree of milling, using a Satake or Kett milling meter to measure transmittance and reflectance of the rice kernels. However, no universal standard measurement method of the degree of milling has been adopted by the rice industry and FGIS. Mea‐ surement methods and other factors, such as variety and com‐ position, may affect the degree‐of‐milling measurement. Degree of milling is also directly related to the milling quality of the rice sample. Milling quality is normally evalu‐ ated as the total rice yield (TRY) and head rice yield (HRY) in the FGIS milling procedures. TRY and HRY are percent‐ ages of total milled rice and head rice based on the rough rice weight. In general, over‐milling or milling for a longer dura‐ tion could result in low TRY and HRY, without any further improvement in the whiteness or degree of milling. In con‐ trast, under‐milling or shorter duration milling could result in high TRY and HRY, and produce a darker appearance and high lipid content in the milled rice. Both over‐milling and under‐milling are undesirable in rice sample milling, since they produce an appraised quality that does not reflect the po‐ tential quality in commercial milling. Only limited information is available about the develop‐ ment of the FGIS procedures and related research (Smith and McCrae, 1951; Smith, 1955a, 1955b, 1955c, 1955d). Smith (1955c) tested various milling weights in the first 30 s for milling various varieties of rice using the McGill No. 3 mill. He found that bran and germ were more easily removed from long grain rice varieties than from medium and short grain varieties. However, no detailed reports were published about the effect of milling duration and weight on milling quality. Since the McGill No. 3 mill uses a relatively large sample, the recently reported sample milling research has used relatively small samples, up to 150 g, milled in the McGill No. 2 or IRRI test tube mill (Takai and Barredo, 1981; Banaszek et al., 1989; Andrews et al., 1992; Sun and Siebenmorgen, 1992; Archer and Siebenmorgen, 1995; Reid et al., 1998; Bautista et al., 2001). It has been found that the relationships of HRY versus initial rice temperature and HRY versus the degree of milling are inversely linear. Andrews et al. (1992) reported that the reduced milling time or reduced milling weight (pres‐ sure) increased HRY but decreased the degree of milling with the McGill No. 2 mill. The official U.S. rice sample milling procedures have been updated several times (USDA‐FGIS, 1979, 1982, 1994), but no information is available about the effect of mill‐ ing conditions on milling quality. Pan and Thompson (2002) studied the effect of mill heat generation and rice temperature on milling quality using a McGill No. 3 mill. They found that high temperatures of the mill and milled rice resulted in sig‐ nificantly lower TRY and HRY. The high milling and polish‐ ing weights of the Western region milling procedure also
1308
caused higher milling temperatures and lower TRY and HRY than the Southern region milling procedure (Pan et al., 2005). Therefore, there is a great need to quantitatively understand the effect of milling and polishing weights and durations on milled rice quality in rice sample milling. The objectives of this study were to (1) study the effects of milling and polishing weights and durations on milled rice quality of medium grain rice using the McGill No. 3 mill, and (2) determine the relationships among TRY, HRY, whiteness, total lipid content, and milled rice temperature.
MATERIALS AND METHODS MATERIALS AND MILLING PROCEDURES Medium grain M202 rough rice with 12.3% (w.b.) mois‐ ture was used for this study because it is the major medium grain variety. The rough rice was provided by Farmer's Rice Cooperative (West Sacramento, Cal.). Thirty‐four samples (1000 g each) were obtained by splitting the rough rice using a standard FGIS grain sample divider. These samples were then milled with a McGill No. 3 mill at the California Depart‐ ment of Food and Agriculture (CDFA) Laboratory (West Sac‐ ramento, Cal.). The standard milling and polishing conditions of the U.S. Western regional milling procedure were included in the tests. Milled rice samples were handled with the standard post‐milling handling procedures of the FGIS. Rice samples were also milled with the standard U.S. Southern regional milling procedure in triplicate. The results from the two dif‐ ferent milling procedures were compared. The current practice at the CDFA Laboratory is to mill rice samples with cutter bar temperatures of 46°C to 54°C (115°F to 130°F). If the cutter bar temperature is below this range, one or two dummy samples are milled before milling an offi‐ cial rice sample. This is done to stabilize the mill temperature in the prescribed range. If the cutter bar temperature is above the prescribed range, a small fan is used to cool it. Before each milling test, the surface temperature of the cutter bar is measured to ensure that it is in the required range. In this study, the temperature was controlled within a range of 49°C to 51°C (120°F to 126°F). The cutter bar temperature was measured using an infrared thermometer (OSXL653, Omega Engineering, Inc., Stamford, Conn.). The bar's surface was first covered with a piece of thin paper tape to avoid reflection from the metal surface. The temperature of the milled rice was measured using a type‐T thermocouple (time constant 0.15 s, Omega Engineering, Inc., Stamford, Conn.) immedi‐ ately after the milled rice was unloaded into a container. The thermocouple was kept at the center of the rice mass until the temperature reading was stabilized, which normally took 10 to 30 s. RICE MILLING QUALITY The major indicators of rice milling quality quantified in the standard FGIS procedures are TRY and HRY. These were determined in this study by following the FGIS procedures. The degree of milling was measured as whiteness and total lipid content (TLC). Whiteness, evaluated based on white‐ ness index (WI), was determined with a whiteness tester (C‐300, Kett Electronic Laboratory, Tokyo, Japan). A higher WI number indicates whiter rice. The percentage of TLC of milled rice was measured using two different methods.
TRANSACTIONS OF THE ASABE
A�chemical method used standard AACC method 30‐10 by extracting lipid using petroleum ether solvent; these mea‐ surements were conducted at the CDFA Laboratory. A near‐ infrared (NIR) method with an Infratech 1221 Grain Analyzer (Foss North America, Inc., Eden Prairie, Minn.) was also used for the total lipid measurement performed at Pacific International Rice Mill, Inc. (Woodland, Cal.). The TLC results measured with the chemical and NIR methods are labeled TLC‐chemical and TLC‐NIR, respectively, and reported in this study as percentages of milled rice on a dry basis. EXPERIMENTAL DESIGN AND STATISTICAL ANALYSIS A central composite experimental design was used to de‐ termine the effect of four independent variables on the mill‐ ing quality (table 1). These variables were milling duration (MD), milling weight (MW), polishing duration (PD), and polishing weight (PW). The dependent variables (milling qualities) were TRY, HRY, WI, TLC, and milled rice temper‐ ature (MRT). The experimental design allowed the deter‐ mination of all the main effects, quadratic effects, interactions between the independent variables, and the de-
MD (s)
Table 1. Central composite experimental design and test results of milled rice quality and temperature.[a] TLC‐ TLC‐ MW PD PW TRY HRY MRT chem. NIR (kg) (s) (kg) (%) (%) WI (°C) (%) (%)
20 40 20 40 20 40 20 40 20 40 20 40 20 40 20 40 10 50 30 30 30 30 30 30 30 30 30 30 30 30 30
3.63 3.63 5.45 5.45 3.63 3.63 5.45 5.45 3.63 3.63 5.45 5.45 3.63 3.63 5.45 5.45 4.54 4.54 2.72 6.36 4.54 4.54 4.54 4.54 4.54 4.54 4.54 4.54 4.54 4.54 4.54
[a]
20 20 20 20 40 40 40 40 20 20 20 20 40 40 40 40 30 30 30 30 10 50 30 30 30 30 30 30 30 30 30
0.45 0.45 0.45 0.45 0.45 0.45 0.45 0.45 1.36 1.36 1.36 1.36 1.36 1.36 1.36 1.36 0.91 0.91 0.91 0.91 0.91 0.91 0 1.82 0.91 0.91 0.91 0.91 0.91 0.91 0.91
72.7 71.6 71.7 69.8 72.1 70.7 71.4 67.6 72.5 70.7 71.6 69.5 71.7 70.5 71.0 69.6 73.0 69.7 71.8 70.1 71.7 70.6 71.0 70.7 71.1 70.9 70.9 70.9 71.0 71.0 71.0
60.4 57.8 57.8 53.3 60.3 57.3 58.9 54.4 59.5 57.4 58.8 54.2 58.7 56.4 57.3 54.4 61.6 54.9 59.5 55.2 58.4 56.6 57.2 56.8 57.3 57.4 57.3 57.2 57.4 57.5 57
36.8 41.1 38.7 42.7 38.4 41.4 39.4 43.1 37.7 41.1 38.9 42.4 39.7 41.3 40.1 41.5 36.3 42.8 40.5 41.6 39.4 41.3 41.4 41.8 40.8 41.4 41 41.2 40.6 40.3 40.9
65 70 68 75 71 78 71 77 67 72 68 76 72 80 73 82 63 82 70 78 68 77 73 75 74 72 75 76 76 75 76
0.26 0.34 0.34 0.21 0.34 0.31 0.24 0.50 0.28 0.21 0.33 0.26 0.23 0.43 0.43 0.26 0.25 0.51 0.30 0.39 0.32 0.29 0.29 0.32 0.22 0.25 0.33 0.29 0.23 0.29 0.29
0.48 0.537 0.347 0.243 0.435 0.29 0.325 0.198 0.446 0.307 0.358 0.235 0.343 0.268 0.293 0.212 0.54 0.225 0.371 0.256 0.414 0.286 0.298 0.265 0.373 0.278 0.283 0.284 0.273 0.277 0.289
MD = milling duration, MW = milling weight, PD = polishing duration, PW = polishing weight, TRY = total rice yield, HRY = head rice yield, WI = whiteness index, MRT = milled rice temperature, TLC‐chem. = total lipid content obtained with chemical analysis method, TLC‐NIR = total lipid content obtained with NIR method.
Vol. 50(4): 1307-1313
velopment of regression models between dependent and in‐ dependent variables. Each independent variable was tested at five levels, which were chosen based on the weights and durations used in the current standard milling procedures. The MW was varied from 2.72 to 6.36 kg (6 to 14 lb) in steps of 0.908 kg, and PW was varied from 0 to 1.82 kg (0 to 4 lb) in steps of 0.454 kg. Both MD and PD were varied from 10 to 50 s in 10 s steps. A total of 31 tests were conducted, which included seven replications with independent variables set at central levels. The central levels are standard conditions of the U.S. Western regional milling procedure. The relationships between the dependent and independent variables were determined using nonlinear regression with SigmaStat Statistical Software (Jandel Scientific Software, Point Richmond, Cal.). The regression model between a de‐ pendent variable (Y) and independent variables can be gener‐ ally written as: Y = a + a1*MD + a2*MW + a3*PD +a4*PW + b12*MD*MW + b13*MD*PD + b14*MD*PW + b23*MW*PD + b24*MW*PW + b34*PD*PW + c1*MD2 + c2*MW2 + c3*PD2 + c4*PW2 The relationships among the quality parameters, such as TRY, HRY, WI, TLC, and MRT, were also examined using regression analysis.
RESULTS AND DISCUSSIONS EFFECT OF MILLING AND POLISHING CONDITIONS For all tested conditions, TRY varied by 5.1 percentage points (from 67.6% to 72.7%), and HRY varied by 8.3 per‐ centage points (from 53.3% to 61.6%) (table 1). Therefore, HRY was generally more sensitive to the changes in milling and polishing conditions in the tested ranges than was TRY. The large range of HRY was due to a large amount of rice ker‐ nel breakage that occurred under high weights and long dura‐ tions of milling and polishing. The results were very similar to the milling characteristics of a friction laboratory rice mill tested by Takai and Barredo (1981). The indicators of the de‐ gree of milling also varied in a relatively large range. WI ranged from 36.8 to 42.8, and TLC‐NIR varied from 0.198% to 0.54%. The milled rice sample with WI lower than 39 had a dark appearance, indicating that the rice has not reached the “well‐milled” stage, even though bran and germ apparently were completely removed. When the experimental results were examined, it was found that high TRY and HRY were generally obtained with short MD and PD and low MW and PW in the ranges tested. But these conditions produced milled rice with dark color, showing a low degree of milling. MRT also varied in a relatively large range, from 65°C to 82°C. The significant levels of the effect of each independent variable on the dependent variables are shown in table 2. The relationships between the independent and dependent vari‐ ables predicted with the regression models in the table, ex‐ cept for TLC‐chemical, were significant (P < 0.001), which indicates that the models are appropriate for use in predicting the TRY, HRY, WI, MRT, and TLC‐NIR of milled rice at dif‐ ferent milling and polishing conditions in the McGill No. 3 mill. It was found that even though some terms in the regres‐ sion models were not statistically significant, they still af‐ fected predicted results of milling quality. When all terms
1309
Variable
Coefficient
-MD MW PD PW MD*MW MD*PD MD*PW MW*PD MW*PW PD*PW MD2 MW2 PD2 PW2
a a1 a2 a3 a4 b12 b13 b14 b23 b24 b34 c1 c2 c3 c4
Equation [a]
Table 2. Milling qualities of rice samples and their influencing factors.[a] HRY (%) TRY (%) WI (unit) MRT (°C) TLC‐chem. (%)
TLC‐NIR (%)
69.285*** -0.138 -0.892 -0.0943 -1.407 -0.0447*** 0.00069 0.0372 0.0227* 0.621* -0.0648** 0.00201* -0.0291 0.00014 -0.5385
76.257*** -0.0186 0.1861 -0.042 -3.335* -0.0256 -0.0006 0.0233* -0.0034 0.19956 0.03436 0.00069 -0.0173 0.00019 -0.12423
17.693*** 0.553*** 1.674 0.35*** 3.5881* 0.00207 -0.00344** -0.0702** -0.0186 -0.2134 -0.0069 -0.0039*** -0.0112 -0.002* 0.2577
28.923** 0.472 5.675 0.839 -0.55 0.0345 0.00313 0.0689 -0.0757 0.152 0.0689 -0.00662* -0.347 -0.00662* -1.393
0.737 -0.0074 -0.1185 -0.0118 -0.0133 -0.0021 0.00028 -0.004 0.0005 0.0076 0.0004 0.00025 0.0083 0.00005 0.0105
1.591*** -0.0114 -0.187 -0.0201* -0.278 -0.0009 -7.4E-05 -0.00136 0.00192 0.055 0.00178 0.00022* 0.00605 0.00014 -0.0146
P < 0.001
P < 0.001
P < 0.001
P < 0.001
P = 0.667
P < 0.001
Independent variables: MD = milling duration, MW = milling weight, PD = polishing duration, and PW = polishing weight. Dependent variables (milling qualities): HRY = head rice yield, TRY = total rice yield, WI = whiteness index, MRT = milled rice temperature, TLC‐chem. = total lipid content obtained with chemical analysis method, and TLC‐NIR = total lipid content obtained with NIR method. Significance: *** indicates P < 0.001, ** indicates P < 0.01, and * indicates P < 0.05. 62 61 y = 0.9741x + 1.4829
Predicted HRY (%)
60
R 2 = 0.98
59 58 57 56 55 54 53 52 52
54
56
58
60
62
64
Measured HRY (%)
Figure 2. Correlation between measured head rice yield (HRY) and pre‐ dicted HRY of medium grain M202.
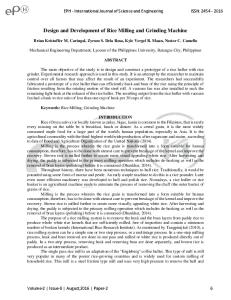
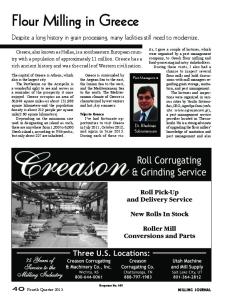
were included in the calculation of predicted milling quality, the predicted values were closer to the measured values than without including the non‐significant terms. Therefore, all non‐significant terms were included in the calculation of pre‐ dicted milling quality. To illustrate the accuracy of predicting milled rice quality, the model‐predicted HRY was plotted against the measured HRY (fig. 2). The predicted and mea‐ sured values had positive linear correlation (r2 = 0.98). The difference between predicted and measured values was less than 1 percentage point for HRY. However, the relationship between TLC results from the chemical method and the con‐ ditions of milling and polishing was not significant (P = 0.667), which means that the regression model cannot be used to predict the TLC from the chemical method. When each term in the regression equations was examined based on the significance level, different main, interaction, and quadratic terms made different contributions to the dif‐ ferent independent variables. To illustrate the effects of mill‐ ing and polishing conditions on rice quality and MRT, only one independent variable was varied in the experimental range; the other three independent variables were fixed at their central levels (fig. 3). MW only affected HRY through its interactions with MD, PD, and PW (fig. 3a). HRY de‐
1310
creased by 4.6 percentage points when MW increased from 2.72 to 6.36 kg when the rest of the factors were set at the cen‐ tral levels. The effect of MD on everything except WI was only through interactions with other variables (fig. 3b). HRY decreased by 5.6 percentage points, which corresponded to a 15.5°C increase in MRT, when MD increased from 10 to 50�s. However, TLC‐NIR and WI tended to level off after about 35 s of MD. Further increases in duration would not be expected to significantly change TLC‐NIR and WI, since the lipid content and color are relatively constant in the core re‐ gion of milled rice (Juliano and Bechtel, 1985). The effect of PW on HRY, TRY, and WI are shown in fig‐ ure 3c. All three quality indicators varied in relatively narrow ranges. Under the illustrated milling and polishing condi‐ tions, HRY was reduced by only 0.7 percentage points, and TRY had very limited change. PD had a significant effect through interactions with MW and PW on all milling quality indicators, except for TRY (fig. 3d). In the tested range under the illustrated conditions, the increase in PD resulted in a re‐ duction of 0.9 percentage points in HRY and 30% in TLC‐ NIR, but an increase of 1.6 units of WI. When WI was greater than 41, increased PD did not cause significant changes in WI values, which indicates that the rice could have reached at least the “well‐milled” stage. Based on above analysis and results, MW and MD caused a greater variation in HRY than PW and PD in the tested ranges. Therefore, to achieve a milling quality in a rice sam‐ ple that reflects the potential quality of a commercial rice mill, it is very important to select appropriate milling weights and durations. In addition, using lower MW and PW and lon‐ ger MD and PD could produce improved HRY without changing the whiteness of milled rice compared to current standard milling procedures. For example, milled rice with a 40.6 WI could be produced by two sets of milling and pol‐ ishing conditions: MD = 35 s, MW =2.72 kg, PD = 35 s, and PW = 0 kg; or standard Western milling conditions (MD = 30�s, MW = 4.1 kg, PD = 30 s, and PW = 0.9 kg). However, the first set of conditions could produce 2 percentage points more HRY and 0.8 percentage points more TRY, respective‐ ly, than the standard Western milling conditions. The slightly
TRANSACTIONS OF THE ASABE
60.0
TRY (%), HRY (%), and MRT (5C)
80.0
57.0 56.0 55.0 54.0 53.0 52.0 51.0
55.0 50.0 45.0
75.0
40.0
70.0
35.0
65.0
30.0 25.0
60.0 20.0 55.0
15.0
(b) MW = 4.54 kg, PD = 30 s, PW = 0.91 kg
(a) MD = 30 s, PD = 30 s, PW = 0.91 kg
10.0
50.0
50.0 3
4
5
6
7
5
15
25
Milling weight (kg)
35
45
55
Milling duration (s)
75.0
45.0
80.0
40.0
75.0
45.0 40.0
HRY TRY WI
65.0
30.0 25.0
60.0
20.0 55.0 15.0
HRY (%) and MRT (5C)
35.0
WI (unit)
TRY (%) and HRY (%)
70.0 35.0
70.0
30.0 65.0
HRY MRT TLC-NIR WI
60.0
15.0
(d) MD = 30 s, MW = 4.54 kg, PW = 0.91 kg 10.0
50.0 0.5
1 1.5 Polishing weight (kg)
20.0
55.0
(c) MD = 30 s, MW = 4.54 kg, PD = 30 s 0
25.0
WI (unit) and TLC-NIR (x 100)
2
WI (unit) and TLC - NIR (x 100)
58.0
HRY (%)
HRY MRT TLC-NIR TRY WI
85.0
59.0
50.0
10.0 5
2
15
25
35
45
55
Polishing duration (s)
Figure 3. Effect of (a) milling weight (MW), (b) milling duration (MD), (c) polishing weight (PW), and (d) polishing duration (PD) on milling quality and milled rice temperature (MRT). (Values calculated using the regression models).
longer MD and PD added only 10 s to the procedure time. The lighter weights could also reduce milled rice temperature by 2.8°C from the temperature produced using the higher weights. The results match with the current commercial rice milling practice using low MW and PW and long MD and PD or multiple milling steps (Harry and Ruiten, 1985). The TRY, HRY, and WI values predicted by the regression model under the standard Southern milling conditions were 72.2%, 59.6%, and 39.9, respectively. These results were very close to the measured TRY (72.0%), HRY (59.9%), and WI (38.9) (fig. 4) under the same milling and polishing condi‐ tions, but measured quality results with the Western and Southern procedures were significantly different. The South‐ ern procedure produced significantly higher TRY and HRY (1.1 and 2.6 percentage points, respectively) but WI 2 units lower than the Western procedure. If the rice is milled to simi‐ lar whiteness, the differences in HRY and TRY from the two different methods could be reduced, as discussed in the next section.
Figure 4. Comparison of milled rice quality from the U.S. Western and Southern regional milling procedures (TRY = total rice yield, HRY = head rice yield, and WI = whiteness index).
RELATIONSHIPS AMONG RICE QUALITY PARAMETERS TRY and HRY had a positive linear relationship regard‐ less of the milling and polishing conditions used (fig. 5). This indicates that the conditions that produced high TRY also re-
sulted in high HRY. In general, the increase of MRT corre‐ sponded to low TRY and HRY, but high WI (fig. 6), which was similar to the results from other types of mills reported by Archer and Siebenmorgen (1995). High milling tempera-
Vol. 50(4): 1307-1313
TRY (%), HRY (%), and WI (unit)
75
72.0 70.9
70
Southern
65
Western 59.9
60
57.3
55 50 45 38.9
40
40.9
35 30 TRY
HRY
WI
Quality of milled rice
1311
Table 3. Predicted HRY and change in WI.[a] WI Predicted HRY Change in HRY (unit) (%) per WI unit
74 y = 0.5011x + 42.22 73
R2 = 0.8357
36 37 38 39 40 41 42 43
72
TRY (%)
71 70 69 [a]
68 67 52
54
56
58
60
62
60.9 60.6 60.0 59.2 58.2 57.1 55.7 54.1
0.3 0.6 0.8 1.0 1.2 1.4 1.6 1.8
HRY = head rice yield, WI = whiteness index. 0.6
64
HRY (%)
85
TRY (%), HRY (%), and WI (unit)
80 70 65 60 55 50 45
WI
R2 = 0.6308
TLC-chemical
36
38
40
42
44
WI (unit)
Figure 8. Relationships between whiteness index (WI) vs. total lipid con‐ tents obtained with chemical method (TLC‐chemical) and NIR method (TLC‐NIR). 65
70
75
80
85
63 62 61 60 59 HRY (%)
y = -0.0427x + 2.0525
0 34
HRY
Figure 6. Relationships between milled rice temperature (MRT) and qual‐ ity (TRY = total rice yield, HRY = head rice yield, and WI = whiteness in‐ dex).
58 57 56 y = -0.0986x 2 + 6.8199x- 56.8 R2 = 0.8184
54 53 36
38
40
42
44
WI (unit)
Figure 7. Relationship between head rice yield (HRY) and whiteness index (WI).
ture could occur under high MW and PW and long MD and PD. After MRT reached about 70°C, change in WI was less significant with further increases in MRT. In the high temper‐ ature range, rice could be over‐milled. As expected, over‐ milling brought less improvement in whiteness of the milled rice, and could result in low TRY and HRY (fig. 7 and
1312
0.2
TLC-NIR
MRT (5C)
52 34
0.3
TRY
35
55
0.4
0.1
40
30 60
Total lipid content (%)
0.5
Figure 5. Relationship between total rice yield (TRY) and head rice yield (HRY) of medium grain M202.
table�3). The decrease in HRY was accelerated with the in‐ crease in whiteness of the milled rice. For example, HRY was reduced by 1.6 percentage points when WI increased from 42 to 43, compared to 0.6 percentage points when WI increased from 37 to 38. Therefore, over‐milling must be avoided in rice sample milling to ensure that the results reflect the poten‐ tial quality of rough rice in typical commercial milling. If the 38.9 WI value of milled rice obtained with the Southern pro‐ cedure is adjusted, using the regression model shown in fig‐ ure 7, to 40.9 as obtained using the Western procedure, then the difference in final HRY is reduced from 2.6 to 0.5 percent‐ age points. The results were similar to the findings of An‐ drews et al. (1992). Theoretically, lipid content should proportionally de‐ crease with the increase of the whiteness due to bran removal during milling. The results of degree of milling showed that the WI of milled rice was more closely related to the decrease in TLC‐NIR than TLC‐chemical (fig. 8). In general, the vari‐ ation of TLC‐NIR results was less than that of TLC‐chemical for a similar whiteness of milled rice. Therefore, TLC‐NIR can be an alternative to WI as an appropriate indicator of the degree of milling, which has also been suggested for on‐line determination and control of degree of milling (Wadsworth, 1994). The variation of TLC‐chemical may be caused by the measurement procedure of the chemical method. Since the TLC‐chemical results were obtained with the standard FGIS method at the official laboratory of California, the repeatabil‐ ity of the standard chemical method may need to be further studied.
TRANSACTIONS OF THE ASABE
CONCLUSIONS For medium grain rice, in general, higher MW and PW and longer MD and PD resulted in lower TRY, HRY, and TLC, and higher WI and MRT. The rice quality parameters, except for TLC‐chemical, can be predicted using regression models based on the milling and polishing conditions. Compared to higher weights with shorter durations of milling and polishing, lower weights with slightly longer durations can produce milled rice with similar whiteness but higher HRY. Since the rate of decrease in HRY accelerated with the increase in WI, over‐milling must be avoided. TLC‐NIR had a linear relationship with WI. Therefore, TLC‐NIR could be used as an additional indicator of the degree of milling. Compared to the Southern standard milling procedure, the current standard Western milling procedure produced lower TRY and HRY, but higher WI in rice sample milling. Since FGIS standard milling procedures do not specify a method for evaluating the degree of milling, the quality results using dif‐ ferent milling procedures are different. To accurately ap‐ praise rice milling quality, it is suggested that more research be done to develop a quantitative method that can be used for specifying the degree of milling in the FGIS procedures. ACKNOWLEDGEMENTS The authors thank Homer Formenteta, Dale Rice, and Sandra Newell of the California Department of Food and Agriculture, and Matt Alonso of Pacific International Rice Mills, Inc., for supporting the experiments; Farmer's Rice Cooperative for supplying the rice samples; and the Califor‐ nia Rice Research Board for providing financial support for this project.
REFERENCES Andrews, S. B., T. J. Siebenmorgen, and A. Mauromostakos. 1992. Evaluation of the McGill No. 2 miller. Cereal Chem. 69(1): 35‐43. Archer, T. A., and T. J. Siebenmorgen. 1995. Milling quality as affected by brown rice temperature. Cereal Chem. 72(3): 304‐307. Bautista, R. C., T. J. Siebenmorgen, S. C. Millsap, and B. K. Goh. 2001. Evaluation of the IRRI test tube mill for use in milling small samples of rice. ASAE Paper No. 016100. St. Joseph, Mich.: ASAE.
Vol. 50(4): 1307-1313
Banaszek, M. M., T. J. Siebenmorgen, and R. N. Sharp. 1989. Effects of moisture content at milling on head rice yield and degree of milling. Arkansas Farm Research Series 38: 15. Harry, T. L., and V. Ruiten. 1985. Rice milling: An overview. In Rice Chemistry and Technology, 349‐379. St. Paul, Minn.: American Association of Cereal Chemists. Juliano, B. O. 1985. Criteria and tests for rice grain qualities. In Rice Chemistry and Technology, 443‐524. St. Paul, Minn.: American Association of Cereal Chemists. Juliano, B. O., and D. B. Bechtel. 1985. The rice grain and its gross composition. In Rice Chemistry and Technology, 15‐57. St. Paul, Minn.: American Association of Cereal Chemists. Pan, Z., and J. F. Thompson. 2002. Improvement of accuracy and consistency of rice sample milling. Research Progress Report of California Rice Research Board. Pan, Z., J. F. Thompson, K. S. P. Amaratunga, T. Anderson, and X. Zheng. 2005. Effect of cooling methods and milling procedures on the appraisal of rice milling quality. Trans. ASAE 48(5): 1865‐1871. Reid, J. D., T. J. Siebenmorgen, and A. Mauromoustakos. 1998. Factors affecting the head rice yield versus degree of milling slope. Cereal Chem. 75(5): 738‐741. Smith, W. D. 1955a. The use of the Carter dockage tester to remove weed seeds and other foreign material from rough rice. Rice J. 58(9): 26‐27. Smith, W. D. 1955b. The use of the McGill sheller for removing hulls from rough rice. Rice J. 58(10): 20. Smith, W. D. 1955c. The use of the McGill miller for milling samples of rice. Rice J. 58(11): 20. Smith, W. D. 1955d. The determination of the estimate of head rice and total yield with the use of the sizing device. Rice J. 58(12): 9. Smith, W. D., and W. McCrea, Jr. 1951. Where breakage occurs in the milling of rice. Rice J. 54(2): 14‐15. Sun, H., and T. J. Siebenmorgen. 1992. Milling characteristics of various rough rice thickness fractions. Cereal Chem. 70(6): 727‐733. Takai, H., and I. R. Barredo. 1981. Milling characteristics of a friction laboratory rice mill. Agric. Eng. Res. 26(5): 441‐448. USDA‐FGIS. 1979. Rice Inspection Handbook for the Sampling, Grading, and Certification of Rice. HB 918‐11. Washington D.C.:USDA Federal Grain Inspection Service. USDA‐FGIS. 1982. Rice Inspection Handbook. Washington D.C.: USDA Federal Grain Inspection Service. USDA‐FGIS. 1994. Rice Inspection Handbook. Washington D.C.: USDA Federal Grain Inspection Service. Wadsworth, J. I. 1994. Degree of milling. In Rice Science and Technology, 139‐176. New York, N.Y.: Marcel Dekker.
1313
1314
TRANSACTIONS OF THE ASABE