Reducing Crop Production Costs: Focus on Fertility Jim Camberato, Professor of Agronomy & Soil Fertility Specialist Michael Langemeier, Professor & Associate Director James Mintert, Professor & Director
© 2017 Purdue Center for Commercial Agriculture
January 20, 2017
$850
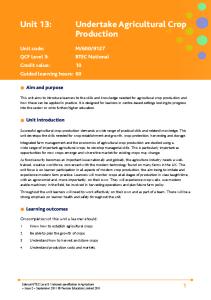
Estimated Revenue and Costs/Acre on a 50/50 Corn/Soybean Farm on Average Quality Indiana Land
$800
$824 $755 $740 $794 $729 $769
$750 $700
$728 $619
$650 $600
$601
$550 $450
$422 $427
$400
$435
$393
$575
$565 $624
$500
$628
Cost/Acre
$672 $683
$663 $650
$657 $603
$581
$740
$616 $598 $608
$634
Revenue
$350 $367 2005 2006 2007 2008 2009 2010 2011 2012 2013 2014 2015 2016 2017 2018 2019 © 2017 Purdue Center for Commercial Agriculture
January 20, 2017
(Variable Cost + Fixed Cost) ÷ Yield = Total Cost per Bu. Reduce cost by: 1. Reducing variable cost without impacting yield 2. Reducing fixed cost (lowers fixed cost per bushel) 3. Improving yield without increasing variable or fixed cost
© 2017 Purdue Center for Commercial Agriculture
January 20, 2017
Top 6 Cost Categories for Corn and Soybeans $ Per Bushel, Average Productivity Indiana Farmland Cost Category
Rotation Corn
Rotation Soybeans
Land (Fixed)
$1.14
$3.73
Machinery (Variable & Fixed)
$0.80
$2.42
Seed (Variable)
$0.71
$1.38
Fertilizer (Variable)
$0.64
$0.77
Pesticides (Variable)
$0.32
$0.90
Labor (Fixed)
$0.24
$0.79
Sub-Total
$3.85
$10.00
Total Cost per Bushel
$4.40
$10.88
© 2017 Purdue Center for Commercial Agriculture
January 20, 2017
Maximize efficiency of N application 1. Apply as much of the total N in-season as possible, preferably between growth stages V3 and V7 2. If using pre-plant anhydrous ammonia aim for 10-14 days before planting and ensure the depth of application is 7-8 inches or precision place between where the rows will be
© 2017 Purdue Center for Commercial Agriculture
January 20, 2017
Maximize efficiency of N application 3. Injected bands of UAN (28-32%) are less prone to N loss than broadcast UAN 4. Do not leave urea or urea-containing N fertilizers on the soil surface 5. Adjust the rate of application based on cost of N and anticipated value of grain
© 2017 Purdue Center for Commercial Agriculture
January 20, 2017
Grain yield (bu/ac)
250
Yield response to N is not a straight line
200 150 100 50 0 0
50 100 150 200 250 Total applied N fertilizer (lbs N / ac)
300
© Purdue Univ
© 2017 Purdue Center for Commercial Agriculture
January 20, 2017
Grain yield (bu/ac)
250
Optimum fertilization rate occurs here
200 150 100 50 0 0
50 100 150 200 250 Total applied N fertilizer (lbs N / ac)
300
© Purdue Univ
© 2017 Purdue Center for Commercial Agriculture
January 20, 2017
Grain yield (bu/ac)
250
Yield usually plateaus at some N rate
200 150
Yield response to N stops beyond the agronomic optimum N rate
100 50 0 0
50 100 150 200 250 Total applied N fertilizer (lbs N / ac)
300
© Purdue Univ
© 2017 Purdue Center for Commercial Agriculture
January 20, 2017
$50 $0
200
($50)
150
Actual yields
($100)
Est. yld
100
($150)
Loss to max. profit
50
($200)
0
($250) 0
50
100
150
200
250
300
Loss to maximum profit ($/ac)
Grain yield (bu/ac)
250
Total applied N (lbs/ac) © 2017 Purdue Center for Commercial Agriculture
January 20, 2017
$50 $0
200 150
($50)
Actual yields
($100)
Est. yld 100
Loss to max. profit
50
($150)
AONR = 227 lb N/a EONR = 200 lb N/a
0 0
© 2017 Purdue Center for Commercial Agriculture
50
100
150
($200)
Loss to maximum profit ($/ac)
Grain yield (bu/ac)
250
($250) 200
250
Total applied N (lbs/ac)
300
January 20, 2017
Optimal Nitrogen rates vary by region and predominant soil types in those regions
© 2017 Purdue Center for Commercial Agriculture
January 20, 2017
N rate recommendations
https://www.agry.purdue.edu/ext/corn/news/timeless/NitrogenMgmt.pdf © 2017 Purdue Center for Commercial Agriculture
January 20, 2017
https://www.agry.purdue.edu/ext/corn/news/timeless/NitrogenMgmt.pdf
© 2017 Purdue Center for Commercial Agriculture
January 20, 2017
Use the Corn Nitrogen Rate Calculator… http://cnrc.agron.iastate.edu
© 2017 Purdue Center for Commercial Agriculture
January 20, 2017
Phosphorus and potassium fertilization • Build-up, maintain, drawdown philosophy of P and K fertilization based on soil testing was built around soil fertility stewardship, land ownership or longterm renting, minimizing risk of yield loss
© 2017 Purdue Center for Commercial Agriculture
January 20, 2017
Soil test P (ppm) associated with limits for corn and soybeans
15
© 2017 Purdue Center for Commercial Agriculture
30
40 January 20, 2017
Traditional recommendation
Less than crop removal
© 2017 Purdue Center for Commercial Agriculture
January 20, 2017
Traditional recommendation
Crop removal
© 2017 Purdue Center for Commercial Agriculture
January 20, 2017
Traditional recommendation
Crop removal + ¼ amt. to buildup soil to critical level
© 2017 Purdue Center for Commercial Agriculture
January 20, 2017
Traditional recommendation – 200 bu/a 125
75 lb P2O5/a
© 2017 Purdue Center for Commercial Agriculture
January 20, 2017
Likelihood and magnitude of profit to fertilizer applied in a season
15
© 2017 Purdue Center for Commercial Agriculture
30
40 January 20, 2017
Alternative fertilizer recommendation ~90
~45 lb P2O5/a
© 2017 Purdue Center for Commercial Agriculture
January 20, 2017
Phosphorus drawdown is slow • Expect 1 ppm decrease in soil test per 20 lb P2O5 removed in excess of application • For example: • 200 bu/acre corn grown removing 75 lb P2O5 per acre
• Expected decrease in soil test P is about 4 ppm
© 2017 Purdue Center for Commercial Agriculture
January 20, 2017
Soil test K levels (ppm) associated with limits
75+2.5 CEC
© 2017 Purdue Center for Commercial Agriculture
+30
+50
January 20, 2017
Alternative fertilizer recommendation ~100
~50 lb K2O/a
© 2017 Purdue Center for Commercial Agriculture
January 20, 2017
Potassium drawdown is not as slow as P 1. Expect 1 ppm decrease in soil test per 6 lb K2O removed in excess of application 2. For example: 200 bu/acre corn grown removing 55 lb K2O per acre
3. Expected decrease in soil test K is about 9 ppm
© 2017 Purdue Center for Commercial Agriculture
January 20, 2017
Join us for our next webinar: January 31, 2017 “Family Business As a Competitive Advantage”
© 2017 Purdue Center for Commercial Agriculture
January 20, 2017