Randomized Algorithms for Scalable Machine Learning
Ariel Jacob Kleiner
Electrical Engineering and Computer Sciences University of California at Berkeley Technical Report No. UCB/EECS-2012-257 http://www.eecs.berkeley.edu/Pubs/TechRpts/2012/EECS-2012-257.html
December 14, 2012
Copyright © 2012, by the author(s). All rights reserved. Permission to make digital or hard copies of all or part of this work for personal or classroom use is granted without fee provided that copies are not made or distributed for profit or commercial advantage and that copies bear this notice and the full citation on the first page. To copy otherwise, to republish, to post on servers or to redistribute to lists, requires prior specific permission.
Randomized Algorithms for Scalable Machine Learning by Ariel Jacob Kleiner
A dissertation submitted in partial satisfaction of the requirements for the degree of Doctor of Philosophy in Computer Science and the Designated Emphasis in Communication, Computation, and Statistics in the Graduate Division of the University of California, Berkeley
Committee in charge: Professor Michael I. Jordan, Chair Professor Peter J. Bickel Professor Martin J. Wainwright Fall 2012
Randomized Algorithms for Scalable Machine Learning
Copyright 2012 by Ariel Jacob Kleiner
1 Abstract
Randomized Algorithms for Scalable Machine Learning by Ariel Jacob Kleiner Doctor of Philosophy in Computer Science Designated Emphasis in Communication, Computation, and Statistics University of California, Berkeley Professor Michael I. Jordan, Chair Many existing procedures in machine learning and statistics are computationally intractable in the setting of large-scale data. As a result, the advent of rapidly increasing dataset sizes, which should be a boon yielding improved statistical performance, instead severely blunts the usefulness of a variety of existing inferential methods. In this work, we use randomness to ameliorate this lack of scalability by reducing complex, computationally difficult inferential problems to larger sets of significantly smaller and more tractable subproblems. This approach allows us to devise algorithms which are both more efficient and more amenable to use of parallel and distributed computation. We propose novel randomized algorithms for two broad classes of problems that arise in machine learning and statistics: estimator quality assessment and semidefinite programming. For the former, we present the Bag of Little Bootstraps (BLB), a procedure which incorporates features of both the bootstrap and subsampling to obtain substantial computational gains while retaining the bootstrap’s accuracy and automation; we also present a novel diagnostic procedure which leverages increasing dataset sizes combined with increasingly powerful computational resources to render existing estimator quality assessment methodology more automatically usable. For semidefinite programming, we present Random Conic Pursuit, a procedure that solves semidefinite programs via repeated optimization over randomly selected two-dimensional subcones of the positive semidefinite cone. As we demonstrate via both theoretical and empirical analyses, these algorithms are scalable, readily benefit from the use of parallel and distributed computing resources, are generically applicable and easily implemented, and have favorable theoretical properties.
i
Contents Contents
i
1 Introduction
1
2 A Scalable Bootstrap for Massive Data 2.1 Introduction . . . . . . . . . . . . . . . . 2.2 Bag of Little Bootstraps (BLB) . . . . . 2.3 Statistical Performance . . . . . . . . . . 2.4 Computational Scalability . . . . . . . . 2.5 Hyperparameter Selection . . . . . . . . 2.6 Real Data . . . . . . . . . . . . . . . . . 2.7 Time Series . . . . . . . . . . . . . . . . 2.A Appendix: Proofs . . . . . . . . . . . . . 2.B Appendix: Additional Real Data Results 3 A General Bootstrap Performance 3.1 Introduction . . . . . . . . . . . . 3.2 Setting and Notation . . . . . . . 3.3 The Diagnostic . . . . . . . . . . 3.4 Simulation Study . . . . . . . . . 3.5 Real Data . . . . . . . . . . . . .
. . . . . . . . .
. . . . . . . . .
. . . . . . . . .
. . . . . . . . .
. . . . . . . . .
. . . . . . . . .
. . . . . . . . .
. . . . . . . . .
. . . . . . . . .
. . . . . . . . .
. . . . . . . . .
. . . . . . . . .
. . . . . . . . .
. . . . . . . . .
. . . . . . . . .
. . . . . . . . .
. . . . . . . . .
5 5 8 11 19 22 24 26 26 33
Diagnostic . . . . . . . . . . . . . . . . . . . . . . . . . . . . . . . . . . . . . . . .
. . . . .
. . . . .
. . . . .
. . . . .
. . . . .
. . . . .
. . . . .
. . . . .
. . . . .
. . . . .
. . . . .
. . . . .
. . . . .
. . . . .
. . . . .
. . . . .
36 36 38 39 42 45
. . . . . .
48 48 49 51 56 59 59
. . . . . . . . .
. . . . . . . . .
. . . . . . . . .
4 Random Conic Pursuit for Semidefinite Programming 4.1 Introduction . . . . . . . . . . . . . . . . . . . . . . . . . 4.2 Random Conic Pursuit . . . . . . . . . . . . . . . . . . . 4.3 Applications and Experiments . . . . . . . . . . . . . . . 4.4 Analysis . . . . . . . . . . . . . . . . . . . . . . . . . . . 4.5 Related Work . . . . . . . . . . . . . . . . . . . . . . . . 4.A Appendix: Proofs . . . . . . . . . . . . . . . . . . . . . .
. . . . . .
. . . . . .
. . . . . .
. . . . . .
. . . . . .
. . . . . .
. . . . . .
. . . . . .
. . . . . .
. . . . . .
5 Conclusion
63
Bibliography
66
ii
Acknowledgments I have been tremendously fortunate over the years—both as a Ph.D. student and beforehand— to be surrounded by wonderful family, friends, and colleagues. Their support, encouragement, mentorship, and collaboration have enduringly illuminated my path. First and foremost, I am deeply grateful to my mother Hanna, my father Myron, and my sister Orli. They have always supported me in every possible way, and any words that I might place upon this page would constitute only a pale facsimile of my true appreciation. I cannot imagine having a more amazing family. I also owe my profound thanks to my Ph.D. advisor, Michael Jordan. Mike’s mentorship and support throughout my years as a Ph.D. student have been truly irreplaceable. I could not have asked for a better academic role model or a better guide in my exploration of the world of machine learning and statistics. In addition to Mike, I have had the pleasure of collaborating and interacting with a remarkable group of colleagues and friends while at UC Berkeley. I had the good fortune to work with Ameet Talwalkar, Purnamrita Sarkar, and Ali Rahimi (as well as Mike) on different facets of the research presented in this dissertation. My interaction and collaboration with them and with various members of SAIL over the years have been an integral part of my development as a researcher and practitioner of machine learning and statistics. I am also very happy to count many of my colleagues in SAIL and in UC Berkeley Computer Science more broadly as my friends. My experience at Berkeley has been unparalleled, and it is difficult to imagine a group of people having greater collective academic and technical acumen. Finally, I am lucky to have extraordinary friends from throughout my life, who have been an enduring source of perspective, support, and fun. You all know who you are, and you have my sincere thanks.
1
Chapter 1 Introduction Massive datasets are increasingly common in modern data analysis applications, and dataset sizes are growing rapidly. For example, the datasets used to develop models of the actions of internet users (e.g., to predict the probability that a user will click on a given advertisement) routinely contain billions of data points, each having millions or tens of millions of covariates [1, 43]. In natural language processing, whether engaged in language modeling or machine translation, datasets can contain billions of documents and trillions of tokens [16, 75]. Beyond such computational fields, the natural sciences are faced with a similar deluge of data. For instance, experiments and data collection efforts in the physical sciences already generate petabytes of data [5], and modern biology involves the collection and analysis of rapidly growing troves of genomic data [20, 35, 68]. These vast quantities of data which are increasingly available present both substantial opportunities and substantial challenges for machine learning and statistics. Indeed, more data holds the promise of permitting more accurate, as well as more fine-grained, estimation and inference. However, realizing this potential requires the ability to efficiently store, process, and analyze large datasets, which often exceed the storage and processing capabilities of individual processors or compute nodes. With the emergence of multicore and cloud computing and the development of software systems—such as Google’s MapReduce [26], Hadoop MapReduce [41], and the Spark cluster computing system [82]—designed to permit robustly leveraging these parallel and distributed architectures, we now have available computing infrastructure which is well suited to storing and processing large datasets. Nonetheless, applying sophisticated data analysis techniques to large datasets often remains challenging, as many existing inferential procedures require computing time (or space) which scales quite adversely as the number of available data points or the data dimensionality increase; furthermore, existing inferential methods are frequently not readily able to utilize parallel and distributed computing resources to achieve scalability. As a result, procedures in machine learning and statistics have increasingly been developed with an eye toward computational efficiency and scalability. For instance, techniques which repose upon certain types of convex optimization problems (in particular, empirical risk minimizers including logistic regression and Support Vector Machines) have prompted
CHAPTER 1. INTRODUCTION
2
and benefited from advances in the efficiency and scalability of optimization algorithms. The realization that stochastic gradient descent, despite not readily providing high-precision solutions to optimization problems, yields substantial efficiency gains in statistical settings— without sacrificing statistical performance—was an important step [14]. Though stochastic gradient descent is not straightforwardly parallelizable, initially limiting its efficiency gains to the serial single-processor setting, subsequent efforts have successfully yielded variants well-suited to multicore and distributed computing architectures [62, 83]. Such work on optimization in the context of statistical learning in fact benefits from and is closely related to a larger body of work on scalable, parallel and distributed optimization algorithms [7, 29]. Beyond procedures based on convex optimization, estimation via the EM algorithm has witnessed analogous developments of (serial) online and large-scale distributed variants enabling more efficient and scalable maximum likelihood estimation in probabilistic models with latent variables [53, 79]. Distributed computation in these cases can be achieved via the map-reduce paradigm, which has been recognized as providing easily accessible (though not necessarily very optimized) data parallelism for the EM algorithm and various other basic learning algorithms that can be seen as optimizing sums of functions evaluated at individual data points [21]. Efficient and scalable inference in certain classes of probabilistic models has also recently received a good deal of attention. The latent Dirichlet allocation (LDA) model [13] has been a particular focus of work in this vein, which has yielded online inferential techniques as well as inferential methods that are well-suited to implementation on multicore or large-scale cluster computing architectures [4, 48, 61, 81]. Similar techniques for achieving scalable inference via data parallelism have also begun to emerge for other probabilistic models, such as the Indian Buffet Process [28]. Work having a slightly different focus within the realm of probabilistic modeling has yielded efficiently parallelizable approximate inference methods for graphical models having large numbers of nodes [38, 39, 37]; these algorithms have been accompanied by the development of a computational framework for the effective parallelization of learning procedures defined on large graphs [56, 57]. Despite this burgeoning body of work, the development of methodology for large-scale estimation and inference remains far from complete. Only specific classes of problems or models are addressed by recently developed techniques, such as those discussed above, and even in these cases, new and improved techniques continue to emerge. Importantly, a number of important classes of problems in machine learning and statistics have not been substantially addressed from the standpoint of computational efficiency and scalability. Thus, in this dissertation, we develop new methods which advance the state of the art in computational efficiency and scalability for two important problem classes: estimator quality assessment and semidefinite programming. In both cases, we use randomness to reduce complex, computationally difficult inferential problems to larger sets of significantly smaller and more tractable subproblems. This approach yields both serial efficiency gains and the ability to readily utilize parallel and distributed computing resources to achieve scalability, without sacrificing statistical performance. The resulting algorithms are furthermore generically applicable and easily implemented. In the case of estimator quality assessment, we also develop a novel diagnostic procedure which leverages increasing dataset sizes combined with increasingly
CHAPTER 1. INTRODUCTION
3
powerful computational resources to render existing estimator quality assessment methodology more automatically usable. Chapter 2 addresses computational efficiency and scalability for the core inferential problem of estimator quality assessment. Although the bootstrap [30] provides a simple and powerful means of assessing the quality of estimators, in settings involving large datasets— which are increasingly prevalent—the computation of bootstrap-based quantities can be prohibitively demanding computationally. While variants such as subsampling [67] and the m out of n bootstrap [9] can be used in principle to reduce the cost of bootstrap computations, we find that these methods are generally not robust to specification of hyperparameters (such as the number of subsampled data points), and they often require use of more prior information (such as rates of convergence of estimators) than the bootstrap. As an alternative, we introduce the Bag of Little Bootstraps (BLB), a new procedure which incorporates features of both the bootstrap and subsampling to yield a robust, computationally efficient means of assessing the quality of estimators. BLB is well suited to modern parallel and distributed computing architectures and furthermore retains the generic applicability and statistical efficiency of the bootstrap. We demonstrate BLB’s favorable statistical performance via a theoretical analysis elucidating the procedure’s properties, as well as a simulation study comparing BLB to the bootstrap, the m out of n bootstrap, and subsampling. In addition, we present results from a large-scale distributed implementation of BLB demonstrating its computational superiority on massive data, a method for adaptively selecting BLB’s hyperparameters, an empirical study applying BLB to several real datasets, and an extension of BLB to time series data. Remaining within the context of estimator quality assessment, Chapter 3 introduces a general performance diagnostic for the bootstrap which improves its level of automation by leveraging the availability of increasingly large datasets coupled with increasingly powerful computing resources. Indeed, as datasets become larger, more complex, and more available to diverse groups of analysts, it would be quite useful to be able to automatically and generically assess the quality of estimates, much as we are able to automatically train and evaluate predictive models such as classifiers. However, despite the fundamental importance of estimator quality assessment in data analysis, this task has eluded highly automatic solutions. While the bootstrap provides perhaps the most promising step in this direction, its level of automation is limited by the difficulty of evaluating its finite sample performance and even its asymptotic consistency. Thus, we present a general diagnostic procedure which directly and automatically evaluates the accuracy of the bootstrap’s outputs, determining whether or not the bootstrap is performing satisfactorily when applied to a given dataset and estimator. We show via an extensive empirical evaluation on a variety of estimators and simulated and real datasets that our proposed diagnostic is effective. Chapter 4 shifts to the problem of semidefinite programming, which underlies a variety of procedures in machine learning and statistics; standard generic methods for solving semidefinite programs (SDPs) generally scale quite adversely in the problem dimensionality. We present a novel algorithm, Random Conic Pursuit, that solves SDPs via repeated optimization over randomly selected two-dimensional subcones of the positive semidefinite cone.
CHAPTER 1. INTRODUCTION
4
This scheme is simple, easily implemented, applicable to very general SDPs, scalable, and theoretically interesting. Its advantages are realized at the expense of an ability to readily compute highly exact solutions, though useful approximate solutions are easily obtained. This property renders Random Conic Pursuit of particular interest for machine learning and statistical applications, in which the relevant SDPs are generally based upon random data and so exact minima are often not a priority. Indeed, we present empirical results to this effect for various SDPs encountered in machine learning and statistics; we also provide an analysis that yields insight into the theoretical properties and convergence of the algorithm. Finally, Chapter 5 concludes with a discussion of open questions and potential avenues of future work.
5
Chapter 2 A Scalable Bootstrap for Massive Data 2.1
Introduction
The development of the bootstrap and related resampling-based methods in the 1960s and 1970s heralded an era in statistics in which inference and computation became increasingly intertwined [30, 27]. By exploiting the basic capabilities of the classical von Neumann computer to simulate and iterate, the bootstrap made it possible to use computers not only to compute estimates but also to assess the quality of estimators, yielding results that are quite generally consistent [8, 36, 77] and often more accurate than those based upon asymptotic approximation [44]. Moreover, the bootstrap aligned statistics to computing technology, such that advances in speed and storage capacity of computers could immediately allow statistical methods to scale to larger datasets. Two recent trends are worthy of attention in this regard. First, the growth in size of datasets is accelerating, with “massive” datasets becoming increasingly prevalent. Second, computational resources are shifting toward parallel and distributed architectures, with multicore and cloud computing platforms providing access to hundreds or thousands of processors. The second trend is seen as a mitigating factor with respect to the first, in that parallel and distributed architectures present new capabilities for storage and manipulation of data. However, from an inferential point of view, it is not yet clear how statistical methodology will transport to a world involving massive data on parallel and distributed computing platforms. While massive data bring many statistical issues to the fore, including issues in exploratory data analysis and data visualization, there remains the core inferential need to assess the quality of estimators. Indeed, the uncertainty and biases in estimates based on large data can remain quite significant, as large datasets are often high dimensional, are frequently used to fit complex models with large numbers of parameters, and can have many potential sources of bias. Furthermore, even if sufficient data are available to allow highly
CHAPTER 2. A SCALABLE BOOTSTRAP FOR MASSIVE DATA
6
accurate estimation, the ability to efficiently assess estimator quality remains essential to allow efficient use of available resources by processing only as much data as is necessary to achieve a desired accuracy or confidence. The bootstrap brings to bear various desirable features in the massive data setting, notably its relatively automatic nature and its applicability to a wide variety of inferential problems. It can be used to assess bias, to quantify the uncertainty in an estimate (e.g., via a standard error or a confidence interval), or to assess risk. However, these virtues are realized at the expense of a substantial computational burden. Bootstrap-based quantities typically must be computed via a form of Monte Carlo approximation in which the estimator in question is repeatedly applied to resamples of the entire original observed dataset. Because these resamples have size on the order of that of the original data, with approximately 63% of data points appearing at least once in each resample, the usefulness of the bootstrap is severely blunted by the large datasets increasingly encountered in practice. In the massive data setting, computation of even a single point estimate on the full dataset can be quite computationally demanding, and so repeated computation of an estimator on comparably sized resamples can be prohibitively costly. To mitigate this problem, one might naturally attempt to exploit the modern trend toward parallel and distributed computing. Indeed, at first glance, the bootstrap would seem ideally suited to straightforwardly leveraging parallel and distributed computing architectures: one might imagine using different processors or compute nodes to process different bootstrap resamples independently in parallel. However, the large size of bootstrap resamples in the massive data setting renders this approach problematic, as the cost of transferring data to independent processors or compute nodes can be overly high, as is the cost of operating on even a single resample using an independent set of computing resources. While the literature does contain some discussion of techniques for improving the computational efficiency of the bootstrap, that work is largely devoted to reducing the number of resamples required [31, 33]. These techniques in general introduce significant additional complexity of implementation and do not eliminate the crippling need for repeated computation of the estimator on resamples having size comparable to that of the original dataset. Another landmark in the development of simulation-based inference is subsampling [67] and the closely related m out of n bootstrap [9]. These methods (which were introduced to achieve statistical consistency in edge cases in which the bootstrap fails) initially appear to remedy the bootstrap’s key computational shortcoming, as they only require repeated computation of the estimator under consideration on resamples (or subsamples) that can be significantly smaller than the original dataset. However, these procedures also have drawbacks. As we show in our simulation study, their success is sensitive to the choice of resample (or subsample) size (i.e., m in the m out of n bootstrap). Additionally, because the variability of an estimator on a subsample differs from its variability on the full dataset, these procedures must perform a rescaling of their output, and this rescaling requires knowledge and explicit use of the convergence rate of the estimator in question; these methods are thus less automatic and easily deployable than the bootstrap. While schemes have been proposed for data-driven selection of an optimal resample size [11], they require significantly
CHAPTER 2. A SCALABLE BOOTSTRAP FOR MASSIVE DATA
7
greater computation which would eliminate any computational gains. Also, there has been work on the m out of n bootstrap that has sought to reduce computational costs using two different values of m in conjunction with extrapolation [12, 10]. However, these approaches explicitly utilize series expansions of the estimator’s sampling distribution and hence are less automatically usable; they also require execution of the m out of n bootstrap for multiple values of m. Motivated by the need for an automatic, accurate means of assessing estimator quality that is scalable to large datasets, we introduce a new procedure, the Bag of Little Bootstraps (BLB), which functions by combining the results of bootstrapping multiple small subsets of a larger original dataset. Instead of applying the estimator directly to each small subset, as in the m out of n bootstrap and subsampling, BLB applies the bootstrap to each small subset; in the resampling process of each individual bootstrap run, weighted resamples are formed such that the effect is that of sampling the small subset n times with replacement, but the computational cost is that associated with the size of the small subset. This has the effect that, despite operating only on subsets of the original dataset, BLB does not require analytical rescaling of its output. Overall, BLB has a significantly more favorable computational profile than the bootstrap, as it only requires repeated computation of the estimator under consideration on quantities of data that can be much smaller than the original dataset. As a result, BLB is well suited to implementation on modern distributed and parallel computing architectures which are often used to process large datasets. Also, our procedure maintains the bootstrap’s generic applicability, favorable statistical properties (i.e., consistency and higher-order correctness), and simplicity of implementation. Finally, as we show in experiments, BLB is consistently more robust than alternatives such as the m out of n bootstrap and subsampling. The remainder of our presentation is organized as follows. In Section 2.2, we formalize our statistical setting and notation, present BLB in detail, and discuss the procedure’s computational characteristics. Subsequently, in Section 2.3, we elucidate BLB’s statistical properties via a theoretical analysis (Section 2.3.1) showing that BLB shares the bootstrap’s consistency and higher-order correctness, as well as a simulation study (Section 2.3.2) which compares BLB to the bootstrap, the m out of n bootstrap, and subsampling. Section 2.4 discusses a large-scale implementation of BLB on a distributed computing system and presents results illustrating the procedure’s superior computational performance in the massive data setting. We present a method for adaptively selecting BLB’s hyperparameters in Section 2.5. Finally, we apply BLB (as well as the bootstrap and the m out of n bootstrap, for comparison) to several real datasets in Section 2.6, and we present an extension of BLB to time series data in Section 2.7.
CHAPTER 2. A SCALABLE BOOTSTRAP FOR MASSIVE DATA
2.2 2.2.1
8
Bag of Little Bootstraps (BLB) Setting and Notation
We assume that we observe a sample X1 , . . . , Xn ∈ XPdrawn i.i.d. from some (unknown) underlying distribution P ∈ P; we denote by Pn = n−1 ni=1 δXi the corresponding empirical distribution. Based only on this observed data, we compute an estimate θˆn ∈ Θ of some (unknown) population value θ ∈ Θ associated with P . For example, θˆn might estimate a measure of correlation, the parameters of a regressor, or the prediction accuracy of a trained classification model. When we wish to explicitly indicate the data used to compute an ˆ n ). Noting that θˆn is a random quantity because it is based on n estimate, we shall write θ(P random observations, we define Qn (P ) ∈ Q as the true underlying distribution of θˆn , which is determined by both P and the form of the estimator. Our end goal is the computation of an estimator quality assessment ξ(Qn (P ), P ) : Q × P → Ξ, for Ξ a vector space; to lighten notation, we shall interchangeably write ξ(Qn (P )) in place of ξ(Qn (P ), P ). For instance, ξ might compute a quantile, a confidence region, a standard error, or a bias. In practice, we do not have direct knowledge of P or Qn (P ), and so we must estimate ξ(Qn (P )) itself based only on the observed data and knowledge of the form of the estimator under consideration. Note that we allow ξ to depend directly on P in addition to Qn (P ) because ξ might operate on the distribution of a centered and normalized version of θˆn . For example, √ ˆ if ξ computes a confidence region, it might manipulate the distribution of the statistic n(θn −θ), which is determined by both Qn (P ) and θ; because θ cannot in general be obtained directly from Qn (P ), a direct dependence on P is required in this case. Nonetheless, given knowledge of Qn (P ), any direct dependence of ξ on P generally has a simple form, often only involving the parameter θ. Additionally, rather than restricting Qn (P ) to be the distribution of θˆn , we could instead allow it to be the distribution of a more general statistic, such as (θˆn , σ ˆn ), where σ ˆn is an estimate of the standard deviation of θˆn (e.g., this would apply when constructing confidence intervals based on the distribution of the studentized statistic (θˆn − θ)/ˆ σn ). Our subsequent development generalizes straightforwardly to this setting, but to simplify the exposition, we will largely assume that Qn (P ) is the distribution of θˆn . Under our notation, the bootstrap simply computes the data-driven plugin approximation ξ(Qn (P )) ≈ ξ(Qn (Pn )). Although ξ(Qn (Pn )) cannot be computed exactly in most cases, it is generally amenable to straightforward Monte Carlo approximation via the following algorithm [33]: repeatedly resample n points i.i.d. from Pn , compute the estimate on each resample, form the empirical distribution Q∗n of the computed estimates, and approximate ξ(Qn (P )) ≈ ξ(Q∗n ). Similarly, using our notation, the m out of n bootstrap (and subsampling) functions as follows, for m < n [9, 67]: repeatedly resample m points i.i.d. from Pn (subsample m points without replacement from X1 , . . . , Xn ), compute the estimate on each resample (subsample), form the empirical distribution Q∗m of the computed estimates, approximate ξ(Qm (P )) ≈ ξ(Q∗m ), and apply an analytical correction to in turn approximate ξ(Qn (P )). This final analytical correction uses prior knowledge of the convergence rate of θˆn as n
CHAPTER 2. A SCALABLE BOOTSTRAP FOR MASSIVE DATA
9
increases and is necessary because each value of the estimate is computed based on only m rather than n points. We use 1d to denote the d-dimensional vector of ones, and we let Id denote the d × d identity matrix.
2.2.2
Bag of Little Bootstraps
The Bag of Little Bootstraps (BLB) functions by averaging the results of bootstrapping multiple small subsets of X1 , . . . , Xn . More formally, given a subset size b < n, BLB samples s subsets of size b from the original n data points, uniformly at random (one can also impose the constraint that the subsets be disjoint). Let I1 , . . . , Is ⊂ {1, . . . , n} be the P (j) corresponding index multisets (note that |Ij | = b, ∀j), and let Pn,b = b−1 i∈Ij δXi be the empirical distribution corresponding to subset j. BLB’s estimate of ξ(Qn (P )) is then given by s X (j) −1 s ξ(Qn (Pn,b )). (2.1) j=1 (j)
Although the terms ξ(Qn (Pn,b )) in (2.1) cannot be computed analytically in general, they can be computed numerically via straightforward Monte Carlo approximation in the manner (j) of the bootstrap: for each term j, repeatedly resample n points i.i.d. from Pn,b , compute the estimate on each resample, form the empirical distribution Q∗n,j of the computed estimates, (j) and approximate ξ(Qn (Pn,b )) ≈ ξ(Q∗n,j ). Now, to realize the substantial computational benefits afforded by BLB, we utilize the following crucial fact: each BLB resample, despite having nominal size n, contains at most b distinct data points. In particular, to generate each resample, it suffices to draw a vector of counts from an n-trial uniform multinomial distribution over b objects. We can then represent each resample by simply maintaining the at most b distinct points present within it, accompanied by corresponding sampled counts (i.e., each resample requires only storage space in O(b)). In turn, if the estimator can work directly with this weighted data representation, then the computational requirements of the estimator—with respect to both time and storage space—scale only in b, rather than n. Fortunately, this property does indeed hold for many if not most commonly used estimators, such as general M-estimators. The resulting BLB algorithm, including Monte Carlo resampling, is shown in Algorithm 1. Thus, BLB only requires repeated computation on small subsets of the original dataset and avoids the bootstrap’s problematic need for repeated computation of the estimate on resamples having size comparable to that of the original dataset. A simple and standard calculation [33] shows that each bootstrap resample contains approximately 0.632n distinct points, which is large if n is large. In contrast, as discussed above, each BLB resample contains at most b distinct points, and b can be chosen to be much smaller than n or 0.632n. For example, we might take b = nγ where γ ∈ [0.5, 1]. More concretely, if n = 1, 000, 000, then each bootstrap resample would contain approximately 632, 000 distinct points, whereas with
CHAPTER 2. A SCALABLE BOOTSTRAP FOR MASSIVE DATA
10
Algorithm 1: Bag of Little Bootstraps (BLB) Input: Data X1 , . . . , Xn b: subset size ˆ θ: estimator of interest s: number of sampled subsets ξ: estimator quality assessment r: number of Monte Carlo iterations Output: An estimate of ξ(Qn (P )) for j ← 1 to s do // Subsample the data Randomly sample a set I = {i1 , . . . , ib } of b indices from {1, . . . , n} without replacement [or, choose I to be a disjoint subset of size b from a predefined random partition of {1, . . . , n}] (j) // Approximate ξ(Qn (Pn,b )) for k ← 1 to r do Sample (n1 , . . . , nb ) ∼ Multinomial(n, 1b /b) P P∗n,k ← n−1 ba=1 na δXia ∗ ˆ ∗ ) θˆn,k ← θ(P n,k end P Q∗n,j ← r−1 rk=1 δθˆ∗ n,k
∗ ξn,j ← ξ(Q∗n,j ) end (j) // AveragePvalues of ξ(Qn (Pn,b )) computed for different data subsets s ∗ return s−1 j=1 ξn,j
b = n0.6 each BLB subsample and resample would contain at most 3, 981 distinct points. If each data point occupies 1 MB of storage space, then the original dataset would occupy 1 TB, a bootstrap resample would occupy approximately 632 GB, and each BLB subsample or resample would occupy at most 4 GB. As a result, the cost of computing the estimate on each BLB resample is generally substantially lower than the cost of computing the estimate on each bootstrap resample, or on the full dataset. Furthermore, as we show in our simulation study and scalability experiments below, BLB typically requires less total computation (across multiple data subsets and resamples) than the bootstrap to reach comparably high accuracy; fairly modest values of s and r suffice. Due to its much smaller subsample and resample sizes, BLB is also significantly more amenable than the bootstrap to distribution of different subsamples and resamples and their associated computations to independent compute nodes; therefore, BLB allows for simple distributed and parallel implementations, enabling additional large computational gains. In the large data setting, computing a single full-data point estimate often requires simultaneous distributed computation across multiple compute nodes, among which the observed dataset is partitioned. Given the large size of each bootstrap resample, computing the estimate on
CHAPTER 2. A SCALABLE BOOTSTRAP FOR MASSIVE DATA
11
even a single such resample in turn also requires the use of a comparably large cluster of compute nodes; the bootstrap requires repetition of this computation for multiple resamples. Each computation of the estimate is thus quite costly, and the aggregate computational costs of this repeated distributed computation are quite high (indeed, the computation for each bootstrap resample requires use of an entire cluster of compute nodes and incurs the associated overhead). In contrast, BLB straightforwardly permits computation on multiple (or even all) subsamples and resamples simultaneously in parallel: because BLB subsamples and resamples can be significantly smaller than the original dataset, they can be transferred to, stored by, and processed on individual (or very small sets of) compute nodes. For example, we could naturally leverage modern hierarchical distributed architectures by distributing subsamples to different compute nodes and subsequently using intra-node parallelism to compute across different resamples generated from the same subsample. Thus, relative to the bootstrap, BLB both decreases the total computational cost of assessing estimator quality and allows more natural use of parallel and distributed computational resources. Moreover, even if only a single compute node is available, BLB allows the following somewhat counterintuitive possibility: even if it is prohibitive to actually compute a point estimate for the full observed data using a single compute node (because the full dataset is large), it may still be possible to efficiently assess such a point estimate’s quality using only a single compute node by processing one subsample (and the associated resamples) at a time. Returning to equation (2.1), unlike the plugin approximation ξ(Qn (Pn )) used by the (j) bootstrap, the plugin approximations ξ(Qn (Pn,b )) used by BLB are based on empirical dis(j)
tributions Pn,b which are more compact and hence, as we have seen, less computationally (j)
demanding than the full empirical distribution Pn . However, each Pn,b is inferior to Pn as an approximation to the true underlying distribution P , and so BLB averages across multiple (j) different realizations of Pn,b to improve the quality of the final result. This procedure yields significant computational benefits over the bootstrap (as discussed above and demonstrated empirically in Section 2.4), while having the same generic applicability and favorable statistical properties as the bootstrap (as shown in the next section), in addition to being more robust than the m out of n bootstrap and subsampling to the choice of subset size (see our simulation study below).
2.3 2.3.1
Statistical Performance Consistency and Higher-Order Correctness
We now show that BLB has statistical properties—in particular, asymptotic consistency and higher-order correctness—which are identical to those of the bootstrap, under the same conditions that have been used in prior analysis of the bootstrap. Note that if θˆn is consistent (i.e., approaches θ in probability) as n → ∞, then it has a degenerate limiting distribution. Thus, in studying the asymptotics of the bootstrap and related procedures, it is typical
CHAPTER 2. A SCALABLE BOOTSTRAP FOR MASSIVE DATA
12
to assume that ξ manipulates the distribution of a centered and normalized version of θˆn (though this distribution is still determined by Qn (P ) and P ). Additionally, as in standard analyses of the bootstrap, we do not explicitly account here for error introduced by use of (j) Monte Carlo approximation to compute the individual plugin approximations ξ(Qn (Pn,b )). The following theorem states that (under standard assumptions) as b, n → ∞, the esP (j) timates s−1 sj=1 ξ(Qn (Pn,b )) returned by BLB approach the population value ξ(Qn (P )) in probability. Interestingly, the only assumption about b required for this result is that b → ∞, though in practice we would generally take b to be a slowly growing function of n. Theorem 1. Suppose that θˆn = φ(Pn ) and θ = φ(P ), where φ is Hadamard differentiable at (j) P tangentially to some subspace, with P , Pn , and Pn,b viewed as maps from some Donsker class F to R such that Fδ is measurable for every δ > 0, where Fδ = {f − g : f, g ∈ 1/2 F, ρP (f − g) < δ} and ρP (f ) =√(P (f − P f )2 ) . Additionally, assume that ξ(Qn (P )) is a function of the distribution of n(φ(Pn ) − φ(P )) which is continuous in the space of such distributions with respect to a metric that metrizes weak convergence. Then, s
−1
s X
(j)
P
ξ(Qn (Pn,b )) − ξ(Qn (P )) → 0
j=1
as n → ∞, for any sequence b → ∞ and for any fixed s. See the appendix for a proof of this theorem, as well as for proofs of all other results in this section. Note that the assumptions of Theorem 1 are standard in analysis of the bootstrap and in fact hold in many practically interesting cases. For example, M-estimators are generally Hadamard differentiable (under some regularity conditions) [76, 77], and the assumptions on ξ are satisfied if, for example, ξ computes a cdf value. Theorem 1 can also be generalized to hold for sequences s → ∞ and more general forms of ξ, but such generalization (j) appears to require stronger assumptions, such as uniform integrability of the ξ(Qn (Pn,b )); the need for stronger assumptions in order to obtain more general consistency results has also been noted in prior work on the bootstrap (e.g., see [42]). Moving beyond analysis of the asymptotic consistency of BLB, we now characterize its higher-order correctness (i.e., the rate of convergence of its output to ξ(Qn (P ))). A great deal of prior work has been devoted to showing that the bootstrap is higher-order correct in many cases (e.g., see the seminal book by Hall [44]), meaning that it converges to the true value ξ(Qn (P )) at a rate of OP (1/n) or faster. In contrast, methods√based on analytical asymptotic approximation are generally correct only at order OP (1/ n). The bootstrap converges more quickly due to its ability to utilize the full empirical distribution of the observed data (rather than, for example, only low-order sample moments), which allows it to better capture finite-sample deviations of the distribution of the quantity of interest from its asymptotic limiting distribution. As shown by the following theorem, BLB shares the same degree of higher-order correctness as the bootstrap, assuming that s and b are chosen to be sufficiently large. Importantly,
CHAPTER 2. A SCALABLE BOOTSTRAP FOR MASSIVE DATA
13
sufficiently large values of b here can still be significantly smaller than n, with b/n → 0 as n → ∞. Following prior analyses of the bootstrap, we now make the standard assump√ tion that ξ can be represented via an asymptotic series expansion in powers of 1/ n. In fact, prior work provides such expansions in a variety of settings. When ξ computes a cdf value, these expansions are termed Edgeworth expansions; if ξ computes a quantile, then the relevant expansions are Cornish-Fisher expansions. See [44] for a full development of such expansions both in generality as well as for specific forms of the estimator, including smooth functions of mean-like statistics and curve estimators. Theorem 2. Suppose that ξ(Qn (P )) admits an expansion as an asymptotic series � � pk 1 p1 , ξ(Qn (P )) = z + √ + · · · + k/2 + o n nk/2 n
(2.2)
where z is a constant independent of P and the pk are polynomials in the moments of P . Additionally, assume that the empirical version of ξ(Qn (P )) for any j admits a similar expansion � � (j) (j) pˆk pˆ1 1 (j) ξ(Qn (Pn,b )) = z + √ + · · · + k/2 + oP , (2.3) n nk/2 n (j)
(j)
where z is as defined above and the pˆk are polynomials in the moments of Pn,b obtained by (j)
replacing the moments of P in the pk with those of Pn,b . Then, assuming that b ≤ n and (1)
E(ˆ pk )2 < ∞ for k ∈ {1, 2}, q � � � � (1) s X Var(ˆ p − p |P ) k n 1 1 k −1 (j) √ + OP . +O √ ξ(Qn (Pn,b )) − ξ(Qn (P )) = OP s n ns b n j=1 (2.4)
√ Therefore, taking s = − pk |Pn )) and b = Ω( n) yields � � s X 1 −1 (j) ξ(Qn (Pn,b )) − ξ(Qn (P )) = OP , s n (1) Ω(n Var(ˆ pk
j=1
in which case BLB enjoys the same level of higher-order correctness as the bootstrap. (j)
Note that it is natural to assume above that ξ(Qn (Pn,b )) can be expanded in powers of √ √ (j) 1/ n, rather than 1/ b, because Qn (Pn,b ) is the distribution of the estimate computed on (j)
(j)
n points sampled from Pn,b . The fact that only b points are represented in Pn,b enters via (j)
the pˆk , which are polynomials in the sample moments of those b points. Theorem 2 indicates that, like the bootstrap, BLB can converge at rate OP (1/n) (as(1) suming that s and b grow at a sufficient rate). Additionally, because Var(ˆ pk − pk |Pn ) is decreasing in probability as b and n increase, s can grow significantly more slowly than n
CHAPTER 2. A SCALABLE BOOTSTRAP FOR MASSIVE DATA
14
√ (j) (1) (indeed, unconditionally, pˆk − pk = OP (1/ b)). While Var(ˆ pk − pk |Pn ) can in principle be computed given an observed dataset, as it depends only on Pn and the form of the estimator under consideration, we can also obtain a general upper bound (in probability) on the rate of decrease of this conditional variance: √ (1) (1) Remark 1. Assuming that E(ˆ pk )4 < ∞, Var(ˆ pk − pk |Pn ) = OP (1/ n) + O(1/b). The following result, which applies to the alternative variant of BLB that constrains the s randomly sampled subsets to be disjoint, also highlights the fact that s can grow substantially more slowly than n: Theorem 3. Under the assumptions of Theorem 2, and assuming that BLB uses disjoint random subsets of the observed data (rather than simple random subsamples), we have � � � � s X 1 1 −1 (j) +O √ . (2.5) ξ(Qn (Pn,b )) − ξ(Qn (P )) = OP √ s b n nbs j=1
√ Therefore, if s ∼ (n/b) and b = Ω( n), then � � s X 1 −1 (j) , ξ(Qn (Pn,b )) − ξ(Qn (P )) = OP s n j=1 in which case BLB enjoys the same level of higher-order correctness as the bootstrap. Finally, while the assumptions of the two preceding theorems generally require that ξ studentizes the estimator under consideration (which involves dividing by an estimate of standard error), similar results hold even if the estimator is not studentized. In particular, not studentizing slows the convergence rate of both √ the bootstrap and BLB by the same factor, generally causing the loss of a factor of OP (1/ n) [76].
2.3.2
Simulation Study
We investigate empirically the statistical performance characteristics of BLB and compare to the statistical performance of existing methods via experiments on simulated data. Use of simulated data is necessary here because it allows knowledge of P , Qn (P ), and hence ξ(Qn (P )); this ground truth is required for evaluation of statistical correctness. For different datasets and estimation tasks, we study the convergence properties of BLB as well as the bootstrap, the m out of n bootstrap, and subsampling. We consider two different settings: regression and classification. For both settings, the ˜ i , Yi ) ∼ P , i.i.d. for i = 1, . . . , n, where X ˜ i ∈ Rd ; Yi ∈ R for data have the form Xi = (X regression, whereas Yi ∈ {0, 1} for classification. In each case, θˆn estimates a parameter ˜ i and Yi . vector in Rd for a linear or generalized linear model of the mapping between X We define ξ as a procedure that computes a set of marginal 95% confidence intervals, one
CHAPTER 2. A SCALABLE BOOTSTRAP FOR MASSIVE DATA
15
for each element of the estimated parameter vector. In particular, given an estimator’s sampling distribution Q (or an approximation thereof), ξ computes the boundaries of the relevant confidence intervals as the 2.5th and 97.5th percentiles of the marginal componentwise distributions defined by Q (averaging across ξ’s simply consists of averaging these percentile estimates). To evaluate the various quality assessment procedures on a given estimation task and true underlying data distribution P , we first compute the ground truth ξ(Qn (P )) by generating 2, 000 realizations of datasets of size n from P , computing θˆn on each, and using this collection of θˆn ’s to form a high-fidelity approximation to Qn (P ). Then, for an independent dataset realization of size n from the true underlying distribution, we run each quality assessment procedure (without parallelization) until it converges and record the estimate of ξ(Qn (P )) produced after each iteration (e.g., after each bootstrap resample or BLB subsample is processed), as well as the cumulative processing time required to produce that estimate. Every such estimate is evaluated based on the average (across dimensions) relative deviation of its component-wise confidence intervals’ widths from the corresponding true widths; given an estimated confidence interval width c and a true width co , the relative deviation of c from co is defined as |c − co |/co . We repeat this process on five independent dataset realizations of size n and average the resulting relative errors and corresponding processing times across these five datasets to obtain a trajectory of relative error versus time for each quality assessment procedure. The relative errors’ variances are small relative to the relevant differences between their means, and so these variances are not shown in our plots. Note that we evaluate based on confidence interval widths, rather than coverage probabilities, to control the running times of our experiments: in our experimental setting, even a single run of a quality assessment procedure requires non-trivial time, and computing coverage probabilities would require a large number of such runs. All experiments in this section were implemented and executed using MATLAB on a single processor. To maintain consistency of notation, we refer to the m out of n bootstrap as the b out of n bootstrap throughout the remainder of this section. For BLB, the b out of n bootstrap, and subsampling, we consider b = nγ with γ ∈ {0.5, 0.6, 0.7, 0.8, 0.9}; we use r = 100 in all runs of BLB. In the regression setting, we generate each dataset from a true underlying distribution P ˜ T 1d + �i or a model Yi = X ˜ T 1d + X ˜TX ˜ i + �i having consisting of either a linear model Yi = X i i i ˜ i and �i are drawn independently a quadratic term, with d = 100 and n = 20, 000. The X ˜ from one of the following pairs of distributions: Xi ∼ Normal(0, Id ) with �i ∼ Normal(0, 10); ˜ i,j ∼ StudentT(3) i.i.d. for j = 1, . . . , d with �i ∼ Normal(0, 10); or X ˜ i,j ∼ Gamma(1 + X 5(j − 1)/ max(d − 1, 1), 2) − 2[1 + 5(j − 1)/ max(d − 1, 1), 2] independently for j = 1, . . . , d ˜ i = E�i = 0, and the last with �i ∼ Gamma(1, 2) − 2. All of these distributions have E X ˜ i distribution has non-zero skewness which varies among the dimensions. In the regression X setting under both the linear and quadratic data generating distributions, our estimator θˆn ˜ i ) least squares regression with a small L2 penalty on the parameter consists of a linear (in X vector to encourage numerical stability (we set the weight on this penalty term to 10−5 ). The true average (across dimensions) marginal confidence interval width for the estimated parameter vector is approximately 0.1 under the linear data generating distributions (for all
CHAPTER 2. A SCALABLE BOOTSTRAP FOR MASSIVE DATA 1
0.6
0.4
0.8
0.2
5
10 Time (sec)
15
0 0
20
0.4
0.2
10
0 0
15
15
0.4
5
10
0.4
0 0
15
5
0.2
20
0.6
0.4
0 0
15
1 SS−0.5 SS−0.6 SS−0.7 SS−0.8 SS−0.9 BOOT
0.2
15
10 Time (sec)
0.8 Relative Error
0.4
10 Time (sec)
0.6
0.2
1
0.6
15
BOFN−0.5 BOFN−0.6 BOFN−0.7 BOFN−0.8 BOFN−0.9 BOOT
0.8
Time (sec)
0.8
10
1 BOFN−0.5 BOFN−0.6 BOFN−0.7 BOFN−0.8 BOFN−0.9 BOOT
0.6
0 0
20
SS−0.5 SS−0.6 SS−0.7 SS−0.8 SS−0.9 BOOT
5
5 Time (sec)
0.2
1
Relative Error
5
0.8 Relative Error
Relative Error
0.6
10 Time (sec)
0.4
0.2
1 BOFN−0.5 BOFN−0.6 BOFN−0.7 BOFN−0.8 BOFN−0.9 BOOT
5
0.6
Time (sec)
0.8
0 0
0.4
0.2
1
0 0
0.6
BLB−0.5 BLB−0.6 BLB−0.7 BLB−0.8 BLB−0.9 BOOT
0.8
Relative Error
0 0
1 BLB−0.5 BLB−0.6 BLB−0.7 BLB−0.8 BLB−0.9 BOOT
SS−0.5 SS−0.6 SS−0.7 SS−0.8 SS−0.9 BOOT
0.8 Relative Error
Relative Error
0.8
Relative Error
BLB−0.5 BLB−0.6 BLB−0.7 BLB−0.8 BLB−0.9 BOOT
Relative Error
1
16
0.6
0.4
0.2
5
10 Time (sec)
15
0 0
5
10
15
Time (sec)
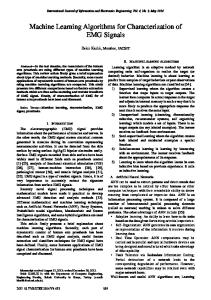
Figure 2.1: Relative error vs. processing time for regression setting. The top row shows BLB with bootstrap (BOOT), the middle row shows b out of n bootstrap (BOFN), and the bottom row shows subsampling (SS). For BLB, BOFN, and SS, b = nγ with the value of γ for each trajectory given in the legend. The left column shows results for linear regression with linear ˜ i distribution. The middle column shows results data generating distribution and Gamma X ˜ i distribution. for linear regression with quadratic data generating distribution and Gamma X The right column shows results for linear regression with linear data generating distribution ˜ i distribution. and StudentT X ˜i distributions) and approximately 1 under the quadratic data generating distributions. X Figure 2.1 shows results for the regression setting under the linear and quadratic data ˜ i distributions; similar results hold generating distributions with the Gamma and StudentT X ˜ for the Normal Xi distribution. In all cases, BLB (top row) succeeds in converging to low relative error significantly more quickly than the bootstrap, for all values of b considered. In contrast, the b out of n bootstrap (middle row) fails to converge to low relative error for smaller values of b (below n0.7 ). Additionally, subsampling (bottom row) performs strictly
CHAPTER 2. A SCALABLE BOOTSTRAP FOR MASSIVE DATA
17
worse than the b out of n bootstrap, as subsampling fails to converge to low relative error for both smaller and larger values of b (e.g., for b = n0.9 ). Note that fairly modest values of s suffice for convergence of BLB (recall that s values are implicit in the time axes of our plots), with s at convergence ranging from 1-2 for b = n0.9 up to 10-14 for b = n0.5 , in the experiments shown in Figure 2.1; larger values of s are required for smaller values of b, which accords with both intuition and our theoretical analysis. Under the quadratic ˜ i distribution (plots not shown), none of the data generating distribution with StudentT X procedures (including the bootstrap) converge to low relative error, which is unsurprising given the StudentT(3) distribution’s lack of moments beyond order two. For the classification setting, we generate each dataset considered from either a linear ˜ iT 1 − ˜ iT 1))−1 ) or a model Yi ∼ Bernoulli((1 + exp(−X model Yi ∼ Bernoulli((1 + exp(−X ˜ iT X ˜ i ))−1 ) having a quadratic term, with d = 10. We use the three different distributions X ˜ i defined in the regression setting. Our estimator, under both the linear and quadratic on X ˜ i ) logistic regression fit via Newton’s data generating distributions, consists of a linear (in X method, again using an L2 penalty term with weight 10−5 to encourage numerical stability. For this estimation task with n = 20, 000, the true average (across dimensions) marginal confidence interval width for the estimated parameter vector is approximately 0.1 under the ˜i distributions) and approximately 0.02 under linear data generating distributions (for all X the quadratic data generating distributions. Figure 2.2 shows results for the classification setting under the linear and quadratic data ˜ i distributions, and n = 20, 000 generating distributions with the Gamma and StudentT X ˜ (as in Figure 2.1); results for the Normal Xi distribution are qualitatively similar. Here, the performance of the various procedures is more varied than in the regression setting. The ˜ i distribution (left column of case of the linear data generating distribution with Gamma X Figure 2.2) appears to be the most challenging. In this setting, BLB converges to relative error comparable to that of the bootstrap for b > n0.6 , while converging to higher relative errors for the smallest values of b considered. For the larger values of b, which are still significantly smaller than n, we again converge to low relative error faster than the bootstrap. We are also once again more robust than the b out of n bootstrap, which fails to converge to low relative error for b ≤ n0.7 . In fact, even for b ≤ n0.6 , BLB’s performance is superior to that of the b out of n bootstrap. Qualitatively similar results hold for the other data generating distributions, but with BLB and the b out of n bootstrap both performing better relative to the bootstrap. In the experiments shown in Figure 2.2, the values of s (which are implicit in the time axes of our plots) required for convergence of BLB range from 1-2 for b = n0.9 up to 10-20 for b ≤ n0.6 (for cases in which BLB converges to low relative error). As in the regression setting, subsampling (plots not shown) has performance strictly worse than that of the b out of n bootstrap in all cases. To further examine the cases in which BLB (when using small values of b) does not converge to relative error comparable to that of the bootstrap, we explore how the various procedures’ relative errors vary with n. In particular, for different values of n (and b), we run each procedure as described above and report the relative error that it achieves after it converges (i.e., after it has processed sufficiently many subsets, in the case of BLB, or
CHAPTER 2. A SCALABLE BOOTSTRAP FOR MASSIVE DATA 1
0.6
0.4
0.8
0.2
0 0
5
10 Time (sec)
15
0.4
0 0
20
1
2 3 Time (sec)
4
0.4
0.2
10 Time (sec)
15
20
0.6
4 6 Time (sec)
8
10
BOFN−0.5 BOFN−0.6 BOFN−0.7 BOFN−0.8 BOFN−0.9 BOOT
0.8
0.4
0 0
2
1
0.2
5
0.4
0 0
5
BOFN−0.5 BOFN−0.6 BOFN−0.7 BOFN−0.8 BOFN−0.9 BOOT
0.8 Relative Error
0.6
0.6
0.2
1 BOFN−0.5 BOFN−0.6 BOFN−0.7 BOFN−0.8 BOFN−0.9 BOOT
0.8 Relative Error
0.6
BLB−0.5 BLB−0.6 BLB−0.7 BLB−0.8 BLB−0.9 BOOT
0.8
0.2
1
0 0
1 BLB−0.5 BLB−0.6 BLB−0.7 BLB−0.8 BLB−0.9 BOOT
Relative Error
Relative Error
0.8
Relative Error
BLB−0.5 BLB−0.6 BLB−0.7 BLB−0.8 BLB−0.9 BOOT
Relative Error
1
18
0.6
0.4
0.2
1
2 3 Time (sec)
4
5
0 0
2
4 6 Time (sec)
8
10
Figure 2.2: Relative error vs. processing time for classification setting with n = 20, 000. The top row shows BLB with bootstrap (BOOT); bottom row shows b out of n bootstrap (BOFN). For both BLB and BOFN, b = nγ with the value of γ for each trajectory given in the legend. The left column shows results for logistic regression with linear data generating ˜ i distribution. The middle column shows results for logistic distribution and Gamma X ˜ i distribution. The regression with quadratic data generating distribution and Gamma X right column shows results for logistic regression with linear data generating distribution ˜ i distribution. and StudentT X resamples, in the case of the b out of n bootstrap and the bootstrap, to allow its output to stabilize). Figure 2.3 shows results for the classification setting under the linear data ˜ i distributions; qualitatively similar generating distribution with the Gamma and StudentT X ˜ i distribution. As expected based on our previous results for results hold for the Normal X fixed n, BLB’s relative error here is higher than that of the bootstrap for the smallest values of b and n considered. Nonetheless, BLB’s relative error decreases to that of the bootstrap as n increases—for all considered values of γ, with b = nγ —in accordance with our theoretical analysis; indeed, as n increases, we can set b to progressively more slowly growing functions of n while still achieving low relative error. Furthermore, BLB’s relative error is consistently substantially lower than that of the b out of n bootstrap and decreases more quickly to the low relative error of the bootstrap as n increases.
CHAPTER 2. A SCALABLE BOOTSTRAP FOR MASSIVE DATA
1
1 BOFN−0.5 BLB−0.5 BOFN−0.6 BLB−0.6 BOFN−0.7 BLB−0.7 BOOT
0.6
BOFN−0.5 BLB−0.5 BOFN−0.6 BLB−0.6 BOFN−0.7 BLB−0.7 BOOT
0.8 Relative Error
Relative Error
0.8
0.4
0.2
0 0
19
0.6
0.4
0.2
1
2
3 n
4
5
0 0
5
x 10
1
2
3 n
4
5 5
x 10
Figure 2.3: Relative error (after convergence) vs. n for BLB, the b out of n bootstrap (BOFN), and the bootstrap (BOOT) in the classification setting. For both BLB and BOFN, b = nγ with the relevant values of γ given in the legend. The left plot shows results for ˜ i distribution. The logistic regression with linear data generating distribution and Gamma X right plot shows results for logistic regression with linear data generating distribution and ˜ i distribution. StudentT X
2.4
Computational Scalability
The experiments of the preceding section, though primarily intended to investigate statistical performance, also provide some insight into computational performance: as seen in Figures 2.1 and 2.2, when computing on a single processor, BLB generally requires less time, and hence less total computation, than the bootstrap to attain comparably high accuracy. Those results only hint at BLB’s superior ability to scale computationally to large datasets, which we now demonstrate in full in the following discussion and via large-scale experiments on a distributed computing platform. As discussed in Section 2.2, modern massive datasets often exceed both the processing and storage capabilities of individual processors or compute nodes, thus necessitating the use of parallel and distributed computing architectures. As a result, the scalability of a quality assessment method is closely tied to its ability to effectively utilize such computing resources. Recall from our exposition in preceding sections that, due to the large size of bootstrap resamples, the following is the most natural avenue for applying the bootstrap to large-scale data using distributed computing: given data partitioned across a cluster of compute nodes, parallelize the estimate computation on each resample across the cluster, and compute on one resample at a time. This approach, while at least potentially feasible, remains quite problematic. Each computation of the estimate will require the use of an entire cluster of compute nodes, and the bootstrap repeatedly incurs the associated overhead, such as
CHAPTER 2. A SCALABLE BOOTSTRAP FOR MASSIVE DATA
20
the cost of repeatedly communicating intermediate data among nodes. Additionally, many cluster computing systems currently in widespread use (e.g., Hadoop MapReduce [41]) store data only on disk, rather than in memory, due to physical size constraints (if the dataset size exceeds the amount of available memory) or architectural constraints (e.g., the need for fault tolerance). In that case, the bootstrap incurs the extreme costs associated with repeatedly reading a very large dataset from disk—reads from disk are orders of magnitude slower than reads from memory. Though disk read costs may be acceptable when (slowly) computing only a single full-data point estimate, they easily become prohibitive when computing many estimates on one hundred or more resamples. Furthermore, as we have seen, executing the bootstrap at scale requires implementing the estimator such that it can be run on data distributed over a cluster of compute nodes. In contrast, BLB permits computation on multiple (or even all) subsamples and resamples simultaneously in parallel, allowing for straightforward distributed and parallel implementations which enable effective scalability and large computational gains. Because BLB subsamples and resamples can be significantly smaller than the original dataset, they can be transferred to, stored by, and processed independently on individual (or very small sets of) compute nodes. For instance, we can distribute subsamples to different compute nodes and subsequently use intra-node parallelism to compute across different resamples generated from the same subsample. Note that generation and distribution of the subsamples requires only a single pass over the full dataset (i.e., only a single read of the full dataset from disk, if it is stored only on disk), after which all required data (i.e., the subsamples) can potentially be stored in memory. Beyond this significant architectural benefit, we also achieve implementation and algorithmic benefits: we do not need to parallelize the estimator internally to take advantage of the available parallelism, as BLB uses this available parallelism to compute on multiple resamples simultaneously, and exposing the estimator to only b rather than n distinct points significantly reduces the computational cost of estimation, particularly if the estimator computation scales super-linearly. Given the shortcomings of the m out of n bootstrap and subsampling illustrated in the preceding section, we do not include these methods in the scalability experiments of this section. However, it is worth noting that these procedures have a significant computational shortcoming in the setting of large-scale data: the m out of n bootstrap and subsampling require repeated access to many different random subsets of the original dataset (in contrast to the relatively few, potentially disjoint, subsamples required by BLB), and this access can be quite costly when the data is distributed across a cluster of compute nodes. We now detail our large-scale experiments on a distributed computing platform. For this empirical study, we use the experimental setup of Section 2.3.2, with some modification to accommodate larger scale and distributed computation. First, we now use d = 3, 000 and n = 6, 000, 000 so that the size of a full observed dataset is approximately 150 GB. The full dataset is partitioned across a number of compute nodes. We again use simulated data to allow knowledge of ground truth; due to the substantially larger data size and attendant higher running times, we now use 200 independent realizations of datasets of size n to numerically compute the ground truth. As our focus is now computational (rather than statistical)
CHAPTER 2. A SCALABLE BOOTSTRAP FOR MASSIVE DATA
21
performance, we present results here for a single data generating distribution which yields representative statistical performance based on the results of the previous section; for a given dataset size, changing the underlying data generating distribution does not alter the computational resources required for storage and processing. For the experiments in this ˜ i distribution. The mapping section, we consider the classification setting with StudentT X ˜ i and Yi remains similar to that of the linear data generating distribution in between X Section 2.3.2, but with the addition of a normalization factor to prevent degeneracy when √ −1 T ˜ using larger d: Yi ∼ Bernoulli((1+exp(−Xi 1/ d)) ). We implement the logistic regression using L-BFGS [63] due to the significantly larger value of d. We compare the performance of BLB and the bootstrap, both implemented as described above. That is, our implementation of BLB processes all subsamples simultaneously in parallel on independent compute nodes; we use r = 50, s = 5, and b = n0.7 . Our implementation of the bootstrap uses all available processors to compute on one resample at a time, with computation of the logistic regression parameter estimates parallelized across the available compute nodes by simply distributing the relevant gradient computations among the different nodes upon which the data is partitioned. We utilize Poisson resampling [77] to generate bootstrap resamples, thereby avoiding the complexity of generating a random multinomial vector of length n in a distributed fashion. Due to high running times, we show results for a single trial of each method, though we have observed little variability in qualitative outcomes during development of these experiments. All experiments in this section are run on Amazon EC2 and implemented in the Scala programming language using the Spark cluster computing framework [82], which provides the ability to either read data from disk (in which case performance is similar to that of Hadoop MapReduce) or cache it in memory across a cluster of compute nodes (provided that sufficient memory is available) for faster repeated access. In the left plot of Figure 2.4, we show results obtained using a cluster of 10 worker nodes, each having 6 GB of memory and 8 compute cores; thus, the total memory of the cluster is 60 GB, and the full dataset (150 GB) can only be stored on disk (the available disk space is ample and far exceeds the dataset size). As expected, the time required by the bootstrap to produce even a low-accuracy output is prohibitively high, while BLB provides a high-accuracy output quite quickly, in less than the time required to process even a single bootstrap resample. In the right plot of Figure 2.4, we show results obtained using a cluster of 20 worker nodes, each having 12 GB of memory and 4 compute cores; thus, the total memory of the cluster is 240 GB, and we cache the full dataset in memory for faster repeated access. Unsurprisingly, the bootstrap’s performance improves significantly with respect to the previous disk-bound experiment. However, the performance of BLB (which also improves), remains substantially better than that of the bootstrap.
CHAPTER 2. A SCALABLE BOOTSTRAP FOR MASSIVE DATA
1
1 BLB−0.7 BOOT
BLB−0.7 BOOT 0.8 Relative Error
Relative Error
0.8
0.6
0.4
0.2
0 0
22
0.6
0.4
0.2
5000
10000 Time (sec)
15000
0 0
1000
2000 3000 Time (sec)
4000
5000
Figure 2.4: Relative error vs. processing time for BLB (with b = n0.7 ) and the bootstrap (BOOT) on 150 GB of data in the classification setting. The left plot shows results with the full dataset stored only on disk; the right plot shows results with the full dataset cached in memory. Because BLB’s computation is fully parallelized across all subsamples, we show only the processing time and relative error of BLB’s final output.
2.5
Hyperparameter Selection
Like existing resampling-based procedures such as the bootstrap, BLB requires the specification of hyperparameters controlling the number of subsamples and resamples processed. Setting such hyperparameters to be sufficiently large is necessary to ensure good statistical performance; however, setting them to be unnecessarily large results in wasted computation. Prior work on the bootstrap and related procedures—which largely does not address computational issues—generally assumes that a procedure’s user will simply select a priori a large, constant number of resamples to be processed (with the exception of [73], which does not provide a general solution for this issue). However, this approach reduces the level of automation of these methods and can be quite inefficient in the large data setting, in which each subsample or resample can require a substantial amount of computation. Thus, we now examine the dependence of BLB’s performance on the choice of r and s, with the goal of better understanding their influence and providing guidance toward achieving adaptive methods for their selection. For any particular application of BLB, we seek to select the minimal values of r and s which are sufficiently large to yield good statistical performance. Recall that in the simulation study of Section 2.3.2, across all of the settings considered, fairly modest values of r (100 for confidence intervals) and s (from 1-2 for b = n0.9 up to 10-20 for b = n0.6 ) were sufficient. The left plot of Figure 2.5 provides further insight into the influence of r and s, giving the relative errors achieved by BLB with b = n0.7 for different r, s ˜i pairs in the classification setting with linear data generating distribution and StudentT X
CHAPTER 2. A SCALABLE BOOTSTRAP FOR MASSIVE DATA
500
1
0.4
200
BLB−0.6 BLB−0.7 BLB−0.8 BLB−0.9 BOOT
0.35
0.8
100
r
0.25 40 0.2 30 0.15
20 10
0.1
5
0.05 1
3
5
10
25 s
50
100
200
Relative Error
0.3 50
23
0.6
0.4
0.2
0 0
10
20 Time (sec)
30
r Stats mean min max
CI 89.6 50 150
STDERR 67.7 40 110
40
Figure 2.5: Results for BLB hyperparameter selection in the classification setting with linear ˜ i distribution. The left plot shows the relative data generating distribution and StudentT X error achieved by BLB for different values of r and s, with b = n0.7 . The right plot shows relative error vs. processing time (without parallelization) for BLB using adaptive selection of r and s (the resulting stopping times of the BLB trajectories are marked by large squares) and the bootstrap (BOOT); for BLB, b = nγ with the value of γ for each trajectory given in the legend. The table gives statistics of the different values of r selected by BLB’s adaptive hyperparameter selection (across multiple subsamples, with b = n0.7 ) when ξ is either our usual confidence interval width-based quality measure (CI), or a component-wise standard error (STDERR); the relative errors achieved by BLB and the bootstrap are comparable in both cases. distribution. In particular, note that for all but the smallest values of r and s, it is possible to choose these values independently such that BLB achieves low relative error; in this case, selecting s ≥ 3, r ≥ 50 is sufficient. While these results are useful and provide some guidance for hyperparameter selection, we expect the sufficient values of r and s to change based on the identity of ξ (e.g., we expect a confidence interval to be harder to compute and hence to require larger r than a standard error) and the properties of the underlying data. Thus, to help avoid the need to set r and s to be conservatively and inefficiently large, we now provide a means for adaptive hyperparameter selection, which we validate empirically. Concretely, to select r adaptively in the inner loop of Algorithm 1, we propose an iterative scheme whereby, for any given subsample j, we continue to process resamples and update ∗ ∗ ξn,j until it has ceased to change significantly. Noting that the values θˆn,k used to compute ∗ ∗ ξn,j are conditionally i.i.d. given a subsample, for most forms of ξ the series√of computed ξn,j values will be well behaved and will converge (in many cases at rate O(1/ r), though with unknown constant) to a constant target value as more resamples are processed. Therefore, it ∗ suffices to process resamples (i.e., to increase r) until we are satisfied that ξn,j has ceased to fluctuate significantly; we propose using Algorithm 2 to assess this convergence. The same scheme can be used to select sP adaptively by processing more subsamples (i.e., increasing s) s −1 ∗ until BLB’s output value s j=1 ξn,j has stabilized; in this case, one can simultaneously also choose r adaptively and independently for each subsample. When parallelizing across subsamples and resamples, one can simply process batches of subsamples and resamples
CHAPTER 2. A SCALABLE BOOTSTRAP FOR MASSIVE DATA
24
Algorithm 2: Convergence Assessment Input: A series z (1) , z (2) , . . . , z (t) ∈ Rd w ∈ N: window size (< t) � ∈ R: target relative error (> 0) Output: true if and only if the input series is deemed to have ceased to fluctuate beyond the target relative error P |z(t−j) −z(t) | if ∀j ∈ [1, w], d1 di=1 i (t) i ≤ � then |zi | return true else return false end
(with batch size determined by the available parallelism) until the output stabilizes. The right plot of Figure 2.5 shows the results of applying such adaptive hyperparameter selection in a representative empirical setting from our earlier simulation study (without parallelization). For selection of r we use � = 0.05 and w = 20, and for selection of s we use � = 0.05 and w = 3. As illustrated in the plot, the adaptive hyperparameter selection allows BLB to cease computing shortly after it has converged (to low relative error), limiting the amount of unnecessary computation that is performed without degradation of statistical performance. Though selected a priori, � and w are more intuitively interpretable and less dependent on the details of ξ and the underlying data generating distribution than r and s. Indeed, the aforementioned specific values of � and w yield results of comparably good quality when also used for the other data generation settings considered in Section 2.3.2, when applied to a variety of real datasets in Section 2.6 below, and when used in conjunction with different forms of ξ (see the table in Figure 2.5, which shows that smaller values of r are selected when ξ is easier to compute). Thus, our scheme significantly helps to alleviate the burden of a priori hyperparameter selection. Automatic selection of a value of b in a computationally efficient manner would also be desirable but is more difficult due to the inability to easily reuse computations performed for different values of b. One could consider similarly increasing b from some small value until the output of BLB stabilizes (an approach reminiscent of the method proposed in [11] for the m out of n bootstrap); devising a means of doing so efficiently is the subject of future work. Nonetheless, based on our fairly extensive empirical investigation, it seems that b = n0.7 is a reasonable and effective choice in many situations.
2.6
Real Data
In this section, we present the results of applying BLB to several different real datasets. In this case, given the absence of ground truth, it is not possible to objectively evaluate the
CHAPTER 2. A SCALABLE BOOTSTRAP FOR MASSIVE DATA
Absolute CI Width
0.4
0.3
0.2
0.1
0 0
BOFN−0.6 BOFN−0.7 BOFN−0.8 BOFN−0.9 BOOT
0.5
Absolute CI Width
BLB−0.6 BLB−0.7 BLB−0.8 BLB−0.9 BOOT
0.5
25
0.4
0.3
0.2
0.1
50
100 Time (sec)
150
200
0 0
50
100 Time (sec)
150
200
Figure 2.6: Average (across dimensions) absolute confidence interval width vs. processing time on the UCI connect4 dataset (logistic regression, d = 42, n = 67, 557). The left plot shows results for BLB (using adaptive hyperparameter selection, with the output at convergence marked by large squares) and the bootstrap (BOOT). The right plot shows results for the b out of n bootstrap (BOFN). For both BLB and BOFN, b = nγ with the value of γ for each trajectory given in the legend.
statistical correctness of any particular estimator quality assessment method; rather, we are reduced to comparing the outputs of various methods (in this case, BLB, the bootstrap, and the b out of n bootstrap) to each other. Because we cannot determine the relative error of each procedure’s output without knowledge of ground truth, we now instead report the average (across dimensions) absolute confidence interval width yielded by each procedure. Figure 2.6 shows results for BLB, the bootstrap, and the b out of n bootstrap on the UCI connect4 dataset [34], where the model is logistic regression (as in the classification setting of our simulation study above), d = 42, and n = 67, 557. We select the BLB hyperparameters r and s using the adaptive method described in the preceding section. Notably, the outputs of BLB for all values of b considered, and the output of the bootstrap, are tightly clustered around the same value; additionally, as expected, BLB converges more quickly than the bootstrap. However, the values produced by the b out of n bootstrap vary significantly as b changes, thus further highlighting this procedure’s lack of robustness. We have obtained qualitatively similar results on six additional datasets from the UCI dataset repository (ctslice, magic, millionsong, parkinsons, poker, shuttle) [34] with different estimators (linear regression and logistic regression) and a range of different values of n and d (see the appendix for plots of these results).
CHAPTER 2. A SCALABLE BOOTSTRAP FOR MASSIVE DATA
2.7
26
Time Series
While we have focused thus far on the setting of i.i.d. data, variants of the bootstrap— such as the moving block bootstrap and the stationary bootstrap—have been proposed to handle other data analysis settings such as that of time series [33, 45, 50, 54, 66]. These bootstrap variants can be used within BLB, in computing the requisite plugin approximations (j) ξ(Qn (Pn,b )), to obtain variants of our procedure which are applicable in non-i.i.d. settings. The advantages (e.g., with respect to scalability) of such BLB variants over variants of the bootstrap (and its relatives) remain identical to the advantages discussed above in the context of large-scale i.i.d. data. We briefly demonstrate the extensibility of BLB by combining our procedure with the stationary bootstrap [66] to obtain a “stationary BLB” which is suitable for assessing the quality of estimators applied to large-scale stationary time series data. To extend BLB in this manner, we must simply alter both the subsample selection mechanism and the resample generation mechanism such that both of these processes respect the underlying data generating process. In particular, for stationary time series data it suffices to select each subsample as a (uniformly) randomly positioned block of length b within the observed time series of length n. Given a subsample of size b, we generate each resample by applying the stationary bootstrap to the subsample to obtain a series of length n. That is, given p ∈ [0, 1] (a hyperparameter of the stationary bootstrap), we first select uniformly at random a data point in the subsample series and then repeat the following process until we have amassed a new series of length n: with probability 1 − p we append to our resample the next point in the subsample series (wrapping around to the beginning if we reach the end of the subsample series), and with probability p we (uniformly at random) select and append a new point in the subsample series. Given subsamples and resamples generated in this manner, we execute the remainder of the BLB procedure as described in Algorithm 1. We now present simulation results comparing the performance of the bootstrap, BLB, the stationary bootstrap, and stationary BLB. In this experiment, initially introduced in [66], we generate observed data consisting of a stationary time series X1 , . . . , Xn ∈ R where Xt = Zt + Zt−1 + Zt−2 + Zt−3 + Zt−4 and the Zt are drawn independently from P Normal(0,√1). We consider the task of estimating the standard deviation of the rescaled mean ni=1 Xt / n, which is approximately 5; we set p = 0.1 for the stationary bootstrap and stationary BLB. The results in Table 2.1 (for n = 5, 000) show the improvement of the stationary bootstrap over the bootstrap, the similar improvement of stationary BLB over BLB, and the fact that the statistical performance of stationary BLB is comparable to that of the stationary bootstrap for b ≥ n0.7 . Note that this exploration of stationary BLB is intended as a proof of concept, and additional investigation would help to further elucidate and perhaps improve the performance characteristics of this BLB extension.
2.A
Appendix: Proofs
We provide here full proofs of the theoretical results included in Section 2.3.1 above.
CHAPTER 2. A SCALABLE BOOTSTRAP FOR MASSIVE DATA Method BLB-0.6 BLB-0.7 BLB-0.8 BLB-0.9 BOOT
Standard 2.2 ± .1 2.2 ± .04 2.2 ± .1 2.2 ± .1 2.2 ± .1
27
Stationary 4.2 ± .1 4.5 ± .1 4.6 ± .2 4.6 ± .1 4.6 ± .2
Table 2.1: Comparison of standard and stationary bootstrap (BOOT) and BLB on stationary time series data with n = 5, 000. We report the average and standard deviation of estimates (after convergence) of the standard deviation of the rescaled mean aggregated over 10 trials. The true population value of the standard deviation of the rescaled mean is approximately 5.
2.A.1
Consistency
We first define some additional notation, following that used in [77]. Let l∞ (F) be the set of all uniformly bounded real functions on F, and let BL1 (l∞ (F)) denote the set of all functions h : l∞ (F) → [0, 1] such that |h(z1 ) − h(z2 )| ≤ kz1 − z2 kF , ∀z1 , z2 ∈ l∞ (F), where k · kF is the uniform norm for maps from F to R. We define P f to be the expectation of f (X) when X ∼ P ; as suggested by this notation, throughout this section we will view distributions (j) such as P , Pn , and Pn,b as maps from some function class F to R. E(·)∗ and E(·)∗ denote the outer and inner expectation of (·), respectively, and we indicate outer probability via d P ∗ . X = Y denotes that the random variables X and Y are equal in distribution, and Fδ is defined as the set {f − g : f, g ∈ F, ρP (f − g) < δ}, where ρP (·) is the variance semimetric: 1/2 ρP (f ) = (P (f − P f )2 ) . Following prior analyses of the bootstrap [36, 77], we first observe that, conditioning on (j) (j) Pn,b for any j as b, n → ∞, resamples from the subsampled empirical distribution Pn,b behave asymptotically as though they were drawn directly from P , the true underlying distribution: P (j) (j) Lemma 1. Given Pn,b for any j, let X1∗ , . . . , Xn∗ ∼ Pn,b i.i.d., and define P∗n,b = n−1 ni=1 δXi∗ . √ (j) Additionally, we define the resampled empirical process G∗n,b = n(P∗n,b − Pn,b ). Then, for F a Donsker class of measurable functions such that Fδ is measurable for every δ > 0, ∗ P sup EP(j) h(G∗n,b ) − Eh(GP ) → 0, h∈BL1 (l∞ (F ))
n,b
as n → ∞, for any sequence b → ∞, where EP(j) denotes expectation conditional on the n,b contents of the subscript and GP is a P -Brownian bridge process. “Furthermore, the sequence EP(j) h(G∗n,b )∗ − EP(j) h(G∗n,b )∗ converges to zero in probability for every h ∈ BL1 (l∞ (F)). If n,b
n,b
P ∗ kf − P f k2F < ∞, then the convergence is also outer almost surely.” [77] (j) d
Proof. Note that Pn,b = Pb . Hence, applying Theorem 3.6.3 in [77] with the identification (n, kn ) ↔ (b, n) yields the desired result.
CHAPTER 2. A SCALABLE BOOTSTRAP FOR MASSIVE DATA
28
(j)
Lemma 1 states that, conditionally on the sequence Pn,b , the sequence of processes G∗n,b converges in distribution to√the P -Brownian bridge process GP , in probability. Noting that the empirical process Gn = n(Pn − P ) also converges in distribution to GP (recall that F is (j) a Donsker class by assumption), it follows that size n resamples generated from Pn,b behave asymptotically as though they were drawn directly from P . Under standard assumptions, it P (j) then follows that ξ(Qn (Pn,b )) − ξ(Qn (P )) → 0: Lemma 2. Under the assumptions of Theorem 1, for any j, P
(j)
ξ(Qn (Pn,b )) − ξ(Qn (P )) → 0 as n → ∞, for any sequence b → ∞. √ Proof. Let R be the random element to which n(φ(Pn ) − φ(P )) converges in distribution; note that the functional delta method [76] provides the form of R in terms of φ and P . The delta method for the bootstrap (see Theorem 23.9 in [76]) in conjunction with Lemma 1 √ (j) implies that, under our assumptions, n(φ(P∗n,b ) − φ(Pn,b )) also converges conditionally in √ (j) distribution to R, given Pn,b , in probability. Thus, the distribution of n(φ(Pn ) − φ(P )) √ (j) (j) and the distribution of n(φ(P∗n,b ) − φ(Pn,b )), the latter conditionally on Pn,b , have the same asymptotic limit in probability. As a result, given the assumed continuity of ξ, it follows (j) that ξ(Qn (Pn,b )) and ξ(Qn (P )) have the same asymptotic limit, in probability. (j)
The above lemma indicates that each individual ξ(Qn (Pn,b )) is asymptotically consistent as b, n → ∞. Theorem 1 immediately follows: Proof of Theorem 1. Lemma 2 in conjunction with the continuous mapping theorem [76] implies the desired result.
2.A.2
Higher-Order Correctness
We first prove two supporting lemmas. Lemma 3. Assume that X1 , . . . , Xb ∼ P are i.i.d., and let pˆk (X1 , . . . , Xb ) be the sample version of pk based on X1 , . . . , Xb , as defined in Theorem 2. Then, assuming that E[ˆ pk (X1 , . . . , Xb )2 ] < ∞, Var(ˆ pk (X1 , . . . , Xb ) − pk ) = Var(ˆ pk (X1 , . . . , Xb )) = O(1/b). Proof. By definition, the pˆk are simply polynomials in sample moments. Thus, we can write ! Aβ B b X Y X −1 (β) pˆk = pˆk (X1 , . . . , Xb ) = cβ b gα (Xi ) , (2.6) β=1
α=1
i=1
CHAPTER 2. A SCALABLE BOOTSTRAP FOR MASSIVE DATA
29
(β)
where each gα raises its argument to some power. Now, observe that for any β, ! Aβ b Y X b−1 Vβ = gα(β) (Xi ) α=1
i=1
is a V-statistic of order Aβ applied to the b observations X1 , . . . , Xb . Let hβ (x1 , . . . , xAβ ) QAβ (β) gα (xα ). It denote the kernel ofPthis V-statistic, which is a symmetrized version of α=1 B follows that pˆk = c V is itself a V-statistic of order A = max A β β β β with kernel PB β=1 h(x1 , . . . , xA ) = β=1 cβ hβ (x1 , . . . , xAβ ), applied to the b observations X1 , . . . , Xb . Let U denote the corresponding U-statistic having kernel h. Then, using Proposition 3.5(ii) and Corollary 3.2(i) in [70], we have Var(ˆ pk − pk ) = Var(ˆ pk ) = Var(U ) + O(b−2 ) ≤
A Var(h(X1 , . . . , XA )) + O(b−2 ) = O(1/b). b
Lemma 4. Assume that X1 , . . . , Xb ∼ P are i.i.d., and let pˆk (X1 , . . . , Xb ) be the sample version of pk based on X1 , . . . , Xb , as defined in Theorem 2. Then, assuming that E|ˆ pk (X1 , . . . , Xb )| < ∞, |E[ˆ pk (X1 , . . . , Xb )] − pk | = O(1/b). Proof. As noted in the proof of Lemma 3, we can write pˆk (X1 , . . . , Xb ) =
B X
cβ
β=1
Aβ Y α=1
b−1
b X
! gα(β) (Xi ) ,
i=1
(β)
where each gα raises its argument to some power. Similarly, pk =
B X β=1
cβ
Aβ Y
Egα(β) (X1 ),
α=1
and so ! B Aβ Aβ b B X X Y X Y −1 (β) (β) |E[ˆ pk (X1 , . . . , Xb )] − pk | = cβ b gα (Xi ) − cβ Egα (X1 ) β=1 α=1 α=1 i=1 β=1 ! Aβ Aβ B b X Y X Y ≤ |cβ | · E b−1 gα(β) (Xi ) − Egα(β) (X1 ) . α=1 α=1 i=1 β=1
CHAPTER 2. A SCALABLE BOOTSTRAP FOR MASSIVE DATA
30
Given that the number of terms in the outer sum on the right-hand side is constant with respect to b, to prove the desired result it is sufficient to show that, for any β, ! A β � � Aβ b Y X Y 1 −1 (β) (β) ∆β = E b Egα (X1 ) = O gα (Xi ) − . b α=1 α=1 i=1 Observe that E
Aβ
Y
α=1
b−1
b X
!
gα(β) (Xi ) = b−Aβ E
b X
Aβ
Y
gα(β) (Xiα ) .
(2.7)
i1 ,...,iAβ =1 α=1
i=1
QAβ QAβ (β) (β) Egα (X1 ) because X1 , . . . , Xb gα (Xiα ) = α=1 If i1 , . . . , iAβ are all distinct, then E α=1 are i.i.d.. Additionally, the right-hand summation in (2.7) has b!/(b − Aβ )! terms in which i1 , . . . , iAβ are all distinct; correspondingly, there are bAβ − b!/(b − Aβ )! terms in which ∃α, α0 s.t. iα = iα0 . Therefore, it follows that ! Aβ Aβ Aβ b Y X Y X Y b! −1 (β) −Aβ (β) (β) E b gα (Xi ) =b Egα (X1 ) + E gα (Xiα ) (b − Aβ )! α=1 α=1 α=1 i=1 1≤i ,...,i ≤b 1
Aβ
∃α,α0 s.t. iα =iα0
and ! Aβ Aβ b Y X Y −1 (β) (β) b ∆β = E gα (Xi ) − Egα (X1 ) α=1 α=1 i=1 � � A A β β X Y Y b! gα(β) (Xiα ) − bA β Egα(β) (X1 ) + E = b−Aβ (b − Aβ )! α=1 α=1 1≤i1 ,...,iAβ ≤b ∃α,α0 s.t. iα =iα0 Aβ Y (β) A b! b! −Aβ Aβ −A + b β b β − C, ≤b − b · Eg (X ) (2.8) 1 α (b − Aβ )! (b − Aβ )! α=1 where C
=
max
1≤i1 ,...,iAβ ≤b ∃α,α0 s.t. iα =iα0
Aβ Y (β) E gα (Xiα ) . α=1
Note that C is a constant with respect to b. Also, simple algebraic manipulation shows that b! = bAβ − κbAβ −1 + O(bAβ −2 ) (b − Aβ )!
CHAPTER 2. A SCALABLE BOOTSTRAP FOR MASSIVE DATA
31
for some κ > 0. Thus, plugging into equation (2.8), we obtain the desired result: Aβ � � Y 1 (β) −Aβ Aβ −1 Aβ −2 −Aβ Aβ −1 Aβ −2 Egα (X1 ) + b κb + O(b ) C=O ∆β ≤ b κb + O(b ) · . b α=1 We now provide full proofs of Theorem 2, Remark 1, and Theorem 3. Proof of Theorem 2. Summing the expansion (2.3) over j, we have s
−1
s X
(j) ξ(Qn (Pn,b ))
−1/2 −1
=z+n
s
s X
(j) pˆ1
−1 −1
+n s
(j) pˆ2
j=1
j=1
j=1
s X
� � 1 + oP . n
Subtracting the corresponding expansion (2.2) for ξ(Qn (P )), we then obtain � � s s s X X X 1 −1 −1 −1 (j) (j) (j) −1/2 −1 ξ(Qn (Pn,b )) − ξ(Qn (P )) ≤ n pˆ1 − p1 +n s . pˆ2 − p2 +oP s s n j=1 j=1 j=1 (2.9) We now further analyze the first two terms on the right-hand side of the above expression; for the remainder of this proof, we assume that k ∈ {1, 2}. Observe that, for fixed k, the (j) pˆk are conditionally i.i.d. given X1 , . . . , Xn for all j, and so ! s � (1) � X Var(ˆ pk − pk |Pn ) (j) (1) −1 , Var s [ˆ pk − pk ] − E[ˆ pk − pk |Pn ] Pn = s j=1 (1)
(1)
where we denote by E[ˆ pk − pk |Pn ] and Var(ˆ pk − pk |Pn ) the expectation and variance (1) (1) (j) of pˆk − pk over realizations of Pn,b conditionally on X1 , . . . , Xn . Now, given that pˆk is a (1)
permutation-symmetric function of size b subsets of X1 , . . . , Xn , E[ˆ pk −pk |Pn ] is a U-statistic of order b. Hence, we can apply Corollary 3.2(i) in [70] in conjunction with Lemma 3 to find that � � � � � � b 1 (1) (1) (1) (1) Var E[ˆ pk − pk |Pn ] − E[ˆ pk − pk ] = Var E[ˆ pk − pk |Pn ] ≤ Var(ˆ pk − pk ) = O . n n From the result of Lemma 4, we have (1) |E[ˆ pk
� � 1 − pk ]| = O . b
Combining the expressions in the previous three panels, we find that q � � � � (1) s X Var(ˆ p − p |P ) k n 1 1 k −1 (j) + OP √ √ +O . pˆk − pk = OP s b s n j=1
Finally, plugging into equation (2.9) with k = 1 and k = 2, we obtain the desired result.
CHAPTER 2. A SCALABLE BOOTSTRAP FOR MASSIVE DATA
32
Proof of Remark 1. Observe that (1)
(1)
(1)
(1)
(1)
Var(ˆ pk − pk |Pn ) ≤ E[(ˆ pk − pk )2 |Pn ] = E[(ˆ pk − pk )2 |Pn ] − E[(ˆ pk − pk )2 ] + E[(ˆ pk − pk )2 ]. (1)
(1)
(1)
(1)
Given that pˆk is a polynomial in the moments of Pn,b , qˆk = (ˆ pk − pk )2 is also a polynomial (1)
(1)
(1)
in the moments of Pn,b . Hence, Lemma 3 applies to qˆk . Additionally, qˆk is a permutation(1)
symmetric function of size b subsets of X1 , . . . , Xn , and so E[ˆ qk |Pn ] is a U-statistic of order b. Therefore, applying Corollary 3.2(i) in [70] in conjunction with Lemma 3, we find that � � � � � � b 1 (1) (1) (1) (1) 2 2 Var E[(ˆ pk − pk ) |Pn ] − E[(ˆ pk − pk ) ] = Var E[ˆ qk |Pn ] ≤ Var(ˆ qk ) = O . n n Now, (1)
(1)
(1)
E[(ˆ pk − pk )2 ] = Var(ˆ pk − pk ) + E[ˆ pk − pk ]2 . (1)
(1)
By Lemmas 3 and 4, Var(ˆ pk − pk ) = O(1/b) and E[ˆ pk − pk ]2 = O(1/b2 ). Combining with the expressions in the previous three panels, we obtain the desired result: � � � � � � � � � � 1 1 1 1 1 (1) +O + O 2 = OP √ +O . Var(ˆ pk − pk |Pn ) = OP √ b b b n n
Proof of Theorem 3. As noted in the proof of Theorem 2, � � s s s X X X 1 −1 −1 −1 (j) (j) (j) −1/2 −1 . ξ(Qn (Pn,b )) − ξ(Qn (P )) ≤ n pˆ1 − p1 +n s pˆ2 − p2 +oP s s n j=1 j=1 j=1 (2.10) Throughout this proof, we assume that k ∈ {1, 2}. Under the assumptions of this theorem, (j) the Pn,b are based on disjoint subsets of the n observations and so are i.i.d.. Hence, for any (j)
k, the pˆk are i.i.d. for all j, and so using Lemma 3, # ! " � � s (1) X Var(ˆ pk − pk ) 1 (j) (1) −1 p k − pk ] = Var s pˆk − pk − E[ˆ =O . s bs j=1 Additionally, from the result of Lemma 4, we have (1) |E[ˆ pk
� � 1 − pk ]| = O . b
Combining the expressions in the previous two panels, we find that � � � � s 1 1 −1 X (j) pˆk − pk = OP √ +O . s b bs j=1
Finally, plugging into equation (2.10) with k = 1 and k = 2, we obtain the desired result.
CHAPTER 2. A SCALABLE BOOTSTRAP FOR MASSIVE DATA
2.B
33
Appendix: Additional Real Data Results 5
5 BLB−0.6 BLB−0.7 BLB−0.8 BLB−0.9 BOOT
4 Absolute CI Width
Absolute CI Width
4
3
2
1
0 0
BOFN−0.6 BOFN−0.7 BOFN−0.8 BOFN−0.9 BOOT
3
2
1
50
100 150 Time (sec)
200
0 0
250
50
100 150 Time (sec)
200
250
0.7
0.7
0.6
0.6
0.5 0.4 0.3
BLB−0.6 BLB−0.7 BLB−0.8 BLB−0.9 BOOT
0.2 0.1 0 0
5
10 Time (sec)
15
20
Absolute CI Width
Absolute CI Width
Figure 2.7: Average (across dimensions) absolute confidence interval width vs. processing time on the UCI ct-slice dataset (linear regression, d = 385, n = 53, 500). The left plot shows results for BLB (using adaptive hyperparameter selection, with the output at convergence marked by large squares) and the bootstrap (BOOT). The right plot shows results for the b out of n bootstrap (BOFN).
0.5 0.4 0.3
BOFN−0.6 BOFN−0.7 BOFN−0.8 BOFN−0.9 BOOT
0.2 0.1 0 0
5
10 Time (sec)
15
20
Figure 2.8: Average (across dimensions) absolute confidence interval width vs. processing time on the UCI magic dataset (logistic regression, d = 10, n = 19, 020). The left plot shows results for BLB (using adaptive hyperparameter selection, with the output at convergence marked by large squares) and the bootstrap (BOOT). The right plot shows results for the b out of n bootstrap (BOFN).
CHAPTER 2. A SCALABLE BOOTSTRAP FOR MASSIVE DATA
0.02
0.02
Absolute CI Width
0.01
0.005
BOFN−0.6 BOFN−0.7 BOFN−0.8 BOFN−0.9 BOOT
0.015 Absolute CI Width
BLB−0.6 BLB−0.7 BLB−0.8 BLB−0.9 BOOT
0.015
0 0
34
0.01
0.005
10
20 30 Time (sec)
40
0 0
50
10
20 30 Time (sec)
40
50
600
600
500
500
400 300 BLB−0.6 BLB−0.7 BLB−0.8 BLB−0.9 BOOT
200 100 0 0
0.5
1 Time (sec)
1.5
Absolute CI Width
Absolute CI Width
Figure 2.9: Average (across dimensions) absolute confidence interval width vs. processing time on the UCI millionsong dataset (linear regression, d = 90, n = 50, 000). The left plot shows results for BLB (using adaptive hyperparameter selection, with the output at convergence marked by large squares) and the bootstrap (BOOT). The right plot shows results for the b out of n bootstrap (BOFN).
400 300 BOFN−0.6 BOFN−0.7 BOFN−0.8 BOFN−0.9 BOOT
200 100 0 0
0.5
1
1.5
Time (sec)
Figure 2.10: Average (across dimensions) absolute confidence interval width vs. processing time on the UCI parkinsons dataset (linear regression, d = 16, n = 5, 875). The left plot shows results for BLB (using adaptive hyperparameter selection, with the output at convergence marked by large squares) and the bootstrap (BOOT). The right plot shows results for the b out of n bootstrap (BOFN).
0.025
0.025
0.02
0.02
0.015
0.01
BLB−0.6 BLB−0.7 BLB−0.8 BLB−0.9 BOOT
0.005
0 0
100
200 300 Time (sec)
400
Absolute CI Width
Absolute CI Width
CHAPTER 2. A SCALABLE BOOTSTRAP FOR MASSIVE DATA
35
0.015
0.01
BOFN−0.6 BOFN−0.7 BOFN−0.8 BOFN−0.9 BOOT
0.005
0 0
500
100
200 300 Time (sec)
400
500
Figure 2.11: Average (across dimensions) absolute confidence interval width vs. processing time on the UCI poker dataset (logistic regression, d = 10, n = 50, 000). The left plot shows results for BLB (using adaptive hyperparameter selection, with the output at convergence marked by large squares) and the bootstrap (BOOT). The right plot shows results for the b out of n bootstrap (BOFN).
0.2
0.2
Absolute CI Width
0.15
0.1
0.05
0 0
BOFN−0.6 BOFN−0.7 BOFN−0.8 BOFN−0.9 BOOT
0.15 Absolute CI Width
BLB−0.6 BLB−0.7 BLB−0.8 BLB−0.9 BOOT
0.1
0.05
50
100 150 Time (sec)
200
250
0 0
50
100 150 Time (sec)
200
250
Figure 2.12: Average (across dimensions) absolute confidence interval width vs. processing time on the UCI shuttle dataset (logistic regression, d = 9, n = 43, 500). The left plot shows results for BLB (using adaptive hyperparameter selection, with the output at convergence marked by large squares) and the bootstrap (BOOT). The right plot shows results for the b out of n bootstrap (BOFN).
36
Chapter 3 A General Bootstrap Performance Diagnostic 3.1
Introduction
Modern datasets are growing rapidly in size and are increasingly subjected to diverse, rapidly evolving sets of complex and exploratory queries, often crafted by non-statisticians. These developments render generic applicability and automation of data analysis methodology particularly desirable, both to allow the statistician to work more efficiently and to allow the non-statistician to correctly and effectively utilize more sophisticated inferential techniques. For example, the development of generic techniques for training classifiers and evaluating their generalization ability has allowed this methodology to spread well beyond the boundaries of the machine learning and statistics research community, to great practical benefit. More generally, estimation techniques for a variety of settings have been rendered generically usable. However, except in some restricted settings, the fundamental inferential problem of assessing the quality of estimates based upon finite data has eluded a highly automated solution. Assessment of an estimate’s quality—for example, its variability (e.g., in the form of a confidence region), its bias, or its risk—is essential to both its interpretation and use. Indeed, such quality assessments underlie a variety of core statistical tasks, such as calibrated inference regarding parameter values, bias correction, and hypothesis testing. Beyond simply enabling other statistical methodology, however, estimator quality assessments can also have more direct utility, whether by improving human interpretation of inferential outputs or by allowing more efficient management of data collection and processing resources. For instance, we might seek to collect or process only as much data as is required to yield estimates of some desired quality, thereby avoiding the cost (e.g., in time or money) of collecting or processing more data than is necessary. Such an approach in fact constitutes an active line of work in research on large database systems, which seeks to answer queries on massive datasets quickly by only applying them to subsamples of the total available data [2, 52]. The result of
CHAPTER 3. A GENERAL BOOTSTRAP PERFORMANCE DIAGNOSTIC
37
applying a query to only a subsample is in fact an estimate of the query’s output if applied to the full dataset, and effective implementation of a system using this technique requires an automatic ability to accurately assess the quality of such estimates for generic queries. In recent decades, the bootstrap [30, 33] has emerged as a powerful and widely used means of assessing estimator quality, with its popularity due in no small part to its relatively generic applicability. Unlike classical methods—which have generally relied upon analytic asymptotic approximations requiring deep analysis of specific classes of estimators in specific settings [67]—the bootstrap can be straightforwardly applied, via a simple computational mechanism, to a broad range of estimators. Since its inception, theoretical work has shown that the bootstrap is broadly consistent [8, 36, 77] and can be higher-order correct [44]. As a result, the bootstrap (and its various relatives and extensions) provides perhaps the most promising avenue for obtaining a generically applicable, automated estimator quality assessment capability. Unfortunately, however, while the bootstrap is relatively automatic in comparison to its classical predecessors, it remains far from being truly automatically usable, as evaluating and ensuring its accuracy is often a challenge even for experts in the methodology. Indeed, like any inferential procedure, despite its excellent theoretical properties and frequently excellent empirical performance, the bootstrap is not infallible. For example, it may fail to be consistent in particular settings (i.e., for particular pairs of estimators and data generating distributions) [69, 9]. While theoretical conditions yielding consistency are well known, they can be non-trivial to verify analytically and provide little useful guidance in the absence of manual analysis. Furthermore, even if consistent, the bootstrap may exhibit poor performance on finite samples. Thus, it would be quite advantageous to have some means of diagnosing poor performance or failure of the bootstrap in an automatic, data-driven fashion, without requiring significant manual analysis. That is, we would like a diagnostic procedure which is analogous to the manner in which we evaluate performance in the setting of supervised learning (e.g., classification), in which we directly and empirically evaluate generalization error (e.g., via a held-out validation set or cross-validation). Unfortunately, prior work on bootstrap diagnostics (see [19] for a comprehensive survey) does not provide a satisfactory solution, as existing diagnostic methods target only specific bootstrap failure modes, are often brittle or difficult to apply, and generally lack substantive empirical evaluations. For example, a theoretical result of Beran [6] regarding bootstrap asymptotics has been proposed as the basis of a diagnostic for bootstrap inconsistency; however, it is unclear how to reliably construct and interpret the diagnostic plots required by this proposal, and the limited existing empirical evaluation reveals it to be of questionable practical utility [19]. Other work has sought to diagnose bootstrap failure specifically due to incorrect standardization of the quantity being bootstrapped (which could occur if an estimator’s convergence rate is unknown or incorrectly determined), use of an incorrect resampling model (if, for example, the data has a correlation structure that is not fully known a priori), or violation of an assumption of pivotality of the quantity being bootstrapped [19]. Additionally, jackknife-after-bootstrap and bootstrap-after-bootstrap calculations have been proposed as a means of evaluating the
CHAPTER 3. A GENERAL BOOTSTRAP PERFORMANCE DIAGNOSTIC
38
stability of the bootstrap’s outputs [32, 19]; while such procedures can be useful data analysis tools, their utility as the basis of a diagnostic remains limited, as, among other things, it is unclear whether they will behave correctly in settings where the bootstrap is inconsistent. In contrast to prior work, we present here a general bootstrap performance diagnostic which does not target any particular bootstrap failure mode but rather directly and automatically determines whether or not the bootstrap is performing satisfactorily (i.e., providing sufficiently accurate outputs) when applied to a given dataset and estimator. The key difficulty in evaluating the accuracy of the bootstrap’s (or any estimator quality assessment procedure’s) outputs is the lack of ready availability of even approximate comparisons to ground truth estimate quality. While comparisons to ground truth labels are readily obtained in the case of supervised learning via use of a held-out validation set or cross-validation, comparing to ground truth in the context of estimator quality assessment requires access to the (unknown) sampling distribution of the estimator in question. We surmount this difficulty by constructing a proxy to ground truth for various small sample sizes (smaller than that of our full observed dataset) and comparing the bootstrap’s outputs to this proxy, requiring that they converge to the ground truth proxy as the sample size is increased. This approach is enabled by the increasing availability of large datasets and more powerful computational resources. We show via an extensive empirical evaluation, on a variety of estimators and simulated and real data, that the resulting diagnostic is effective in determining—fully automatically—whether or not the bootstrap is performing satisfactorily in a given setting. In Section 3.2, we formalize our statistical setting and notation. We introduce our diagnostic in full detail in Section 3.3. Sections 3.4 and 3.5 present the results of our evaluations on simulated and real data, respectively.
3.2
Setting and Notation
We assume that we observe n data points Pn D = (X1 , . . . , Xn ) sampled i.i.d. from some un−1 known distribution P ; let Pn = n i=1 δXi be the empirical distribution of the observed ˆ data. Based upon this dataset, we form an estimate θ(D) of some parameter θ(P ) of P ; ˆ note that, unlike θ(P ), θ(D) is a random quantity due to its dependence on the data D. We ˆ then seek to form an assessment ξ(P, n) of the quality of the estimate θ(D), which consists of a summary of the distribution Qn of some quantity u(D, P ). Our choice of summary and ˆ For form for u depends upon our inferential goals and our knowledge of the properties of θ. ˆ instance, ξ(P, n) might compute an interquantile range for u(D, P ) = θ(D), the expectation ˆ of u(D, P ) = θ(D) − θ(P ) (i.e., the bias), or a confidence interval based on the distribution ˆ of u(D, P ) = n1/2 (θ(D) − θ(P )). Unfortunately, we cannot compute ξ(P, n) directly because P and Qn are unknown, and so we must resort to estimating ξ(P, n) based upon a single observed dataset D. The bootstrap addresses this problem by estimating the unknown ξ(P, n) via the plug-in approximation ξ(Pn , n). Although computing ξ(Pn , n) exactly is typically intractable, we
CHAPTER 3. A GENERAL BOOTSTRAP PERFORMANCE DIAGNOSTIC
39
can obtain an accurate approximation using a simple Monte Carlo procedure: repeatedly form simulated datasets D∗ of size n by sampling n points i.i.d. from Pn , compute u(D∗ , Pn ) for each simulated dataset, form the empirical distribution Qn of the computed values of u, and return the desired summary of this distribution. We overload notation somewhat by referring to this final bootstrap output as ξ(Qn , n), allowing ξ to take as its first argument either a data generating distribution or a distribution of u values. For ease of exposition, we assume below that ξ is real-valued, though the proposed methodology can be straightforwardly generalized (e.g., to contexts in which ξ produces elements of a vector space).
3.3
The Diagnostic
We frame the task of evaluating whether or not the bootstrap is performing satisfactorily in a given setting as a decision problem: for a given estimator, data generating distribution P , and dataset size n, is the bootstrap’s output sufficiently likely to be sufficiently near the ground truth value ξ(P, n)? This formulation avoids the difficulty of producing uniformly precise quantifications of the bootstrap’s accuracy by requiring only that a decision be rendered based upon some definition of “sufficiently likely” and “sufficiently near the ground truth.” Nonetheless, in developing a diagnostic procedure to address this decision problem, we face the key difficulties of determining the distribution of the bootstrap’s outputs on datasets of size n and of obtaining even an approximation to the ground truth value against which to evaluate this distribution. Ideally, we might approximate ξ(P, n) for a given value of n by observing many independent datasets, each of size n. For each dataset, we would compute the corresponding value of u, and the resulting collection of u values would approximate the distribution Qn , which would in turn yield a direct approximation of the ground truth value ξ(P, n). Furthermore, we could approximate the distribution of bootstrap outputs by simply running the bootstrap on each dataset of size n. Unfortunately, however, in practice we only observe a single set of n data points, rendering this approach an unachievable ideal. To surmount this difficulty, our diagnostic (Algorithm 3) executes this ideal procedure for dataset sizes smaller than n. That is, for a given p ∈ N and b ≤ bn/pc, we randomly sample p disjoint subsets of the observed dataset D, each of size b. For each subset, we compute the value of u; the resulting collection of u values approximates the distribution Qb , in turn yielding a direct approximation of ξ(P, b), the ground truth value for the smaller dataset size b. Additionally, we run the bootstrap on each of the p subsets of size b, and comparing the distribution of the resulting p bootstrap outputs to our ground truth approximation, we can determine whether or not the bootstrap performs acceptably well at sample size b. It then remains to use this ability to evaluate the bootstrap’s performance at smaller sample sizes to determine whether or not it is performing satisfactorily at the full sample size n. To that end, we evaluate the bootstrap’s performance at multiple smaller sample sizes to determine whether or not the distribution of its outputs is in fact converging to the
CHAPTER 3. A GENERAL BOOTSTRAP PERFORMANCE DIAGNOSTIC
40
Algorithm 3: Bootstrap Performance Diagnostic Input: D = (X1 , . . . , Xn ): observed data ξ: estimator quality assessment u: quantity whose distribution is summarized by ξ p: number of disjoint subsamples used to compute ground truth approximations (e.g., 100) b1 , . . . , bk : increasing sequence of subsample sizes for which ground truth approximations are computed, with bk ≤ bn/pc (e.g., bi = bn/(p2k−i )c with k = 3) c1 ≥ 0: tolerance for decreases in absolute relative deviation of mean bootstrap output (e.g., 0.2) c2 ≥ 0: tolerance for decreases in relative standard deviation of bootstrap output (e.g., 0.2) c3 ≥ 0, α ∈ [0, 1]: desired probability α that bootstrap output at sample size n has absolute relative deviation from ground truth less than or equal to c3 (e.g., c3 = 0.5, α = 0.95) Output: true if bootstrap is deemed to be performing satisfactorily, false otherwise P Pn ← n−1 ni=1 δXi for i ← 1 to k do Di1 , . . . , Dip ← random disjoint subsets of D, each containing bi data points for j ← 1 to p do uij ← u(Dij , Pn ) ξij∗ ← bootstrap(ξ, u, bi , Dij ) end // Compute Pp ground truth approximation for sample size bi Qbi ← j=1 δuij ξ˜i ← ξ(Qbi , bi ) // Compute absolute relative deviation of mean of bootstrap outputs // and relative standard deviation of bootstrap outputs for sample // size bi ∗ ,...,ξ ∗ )−ξ˜ ∗ ,...,ξ ∗ ) mean(ξi1 stddev(ξi1 i ip ip ∆i ← σ ← i ξ˜i ξ˜i end return true if all of the following hold, and false otherwise: ∆i+1 < ∆i OR ∆i+1 ≤ c1 , ∀i = 1, . . . , k, σi+1 < σi OR σi+1 ≤ c2 , ∀i = 1, . . . , k, � � ∗ −ξ˜ ξkj k # j ∈ 1, . . . , p : ξ˜ ≤ c3 k ≥α p
(3.1) (3.2)
(3.3)
CHAPTER 3. A GENERAL BOOTSTRAP PERFORMANCE DIAGNOSTIC
41
ground truth as the sample size increases, thereby allowing us to generalize our conclusions regarding performance from smaller to larger sample sizes. Indeed, determining whether or not the bootstrap is performing satisfactorily for a single smaller sample size b alone is inadequate for our purposes, as the bootstrap’s performance may degrade as sample size increases, so that it fails at sample size n despite appearing to perform sufficiently well at smaller sample size b. Conversely, the bootstrap may exhibit mediocre performance for small sample sizes but improve as it is applied to more data. Thus, our diagnostic compares the distribution of bootstrap outputs to the ground truth approximation for an increasing sequence of sample sizes b1 , . . . , bk , with bk ≤ bn/pc; subsamples of each of these sizes are constructed and processed in the outer for loop of Algorithm 3. In order to conclude that the bootstrap is performing satisfactorily at sample size n, the diagnostic requires that the distribution of its outputs converges monotonically to the ground truth approximation for all of the smaller sample sizes b1 , . . . , bk . Convergence is assessed based on absolute relative deviation of the mean of the bootstrap outputs from the ground truth approximation (which must decrease with increasing sample size), and size of the standard deviation of the bootstrap outputs relative to the ground truth approximation (which must also decrease with increasing sample size). In Algorithm 3, this convergence assessment is performed by conditions (3.1) and (3.2). As a practical matter, these conditions do not require continuing decreases in the absolute relative mean deviation ∆i or relative standard deviation σi when these quantities are below some threshold (given by c1 and c2 , respectively) due to inevitable stochastic error in their estimation: when these quantities are sufficiently small, stochastic error due to the fact that we have only used p subsamples prevents reliable determination of whether or not decreases are in fact occurring. We have found that c1 = c2 = 0.2 is a reasonable choice of the relevant thresholds. Progressive convergence of the bootstrap’s outputs to the ground truth is not alone sufficient, however; although the bootstrap’s performance may be improving as sample size increases, a particular value of n may not be sufficiently large to yield satisfactory performance. Therefore, beyond the convergence assessment discussed above, we must also determine whether or not the bootstrap is in fact performing sufficiently well for the user’s purposes at sample size n. We define “sufficiently well” as meaning that with probability at least α ∈ [0, 1], the output of the bootstrap when run on a dataset of size n will have absolute relative deviation from ground truth of at most c3 (the absolute relative deviation of a quantity γ from a quantity γo is defined as |γ − γo |/|γo |); the constants α and c3 are specified by the user of the diagnostic procedure based on the user’s inferential goals. Because we can only directly evaluate the bootstrap’s performance at smaller sample sizes (and not at the full sample size n), we take a conservative approach, motivated by the assumption that a false positive (incorrectly concluding that the bootstrap is performing satisfactorily) is substantially less desirable than a false negative. In particular, as embodied in condition (3.3) of Algorithm 3, we require that the bootstrap is performing sufficiently well under the aforementioned definition at the sample size bk . Satisfying this condition, in conjunction with satisfying the preceding conditions indicating continuing convergence to the ground truth, is taken to imply that the bootstrap will continue to perform satisfactorily when applied to the
CHAPTER 3. A GENERAL BOOTSTRAP PERFORMANCE DIAGNOSTIC
42
full sample size n (in fact, the bootstrap’s performance at sample size n will likely exceed that implied by α and c3 due to the diagnostic’s conservatism). It is worth noting that this diagnostic procedure reposes on the availability in modern data analysis of both substantial quantities of data and substantial computational resources. For example, with p = 100 (an empirically effective choice), using bk = 1, 000 or bk = 10, 000 requires n ≥ 105 or n ≥ 106 , respectively. Fortuitously, datasets of such sizes are now commonplace. Regarding its computational requirements, our procedure benefits from the modern shift toward parallel and distributed computing, as the vast majority of the required computation occurs in the inner for loop of Algorithm 3, the iterations of which are independent and individually process only small data subsets. Additionally, we have sought to reduce the procedure’s computational costs by using an identical number of subsamples p for each subsample size b1 , . . . , bk ; one could presumably improve statistical performance by using larger numbers of subsamples for smaller subsample sizes. The guidelines given in Algorithm 3 for setting the diagnostic procedure’s hyperparameters are motivated by the procedure’s structure and have proven to be empirically effective. We recommend exponential spacing of the b1 , . . . , bk to help ensure that reliable comparisons of bootstrap performance can be made across adjacent sample sizes bi and bi+1 . However, by construction, setting the b1 , . . . , bk to be too close together should primarily cause an increase in the false negative rate (the probability that the diagnostic incorrectly concludes that the bootstrap is not performing satisfactorily), rather than a less desirable increase in the false positive rate. Similarly, setting c1 or c2 to be too low should also primarily result in an increase in the false negative rate. Regarding c3 and α, these hyperparameters should be determined by the user’s bootstrap performance desiderata. We nonetheless expect that fairly lenient settings of c3 —such as c3 = 0.5, which corresponds to allowing the bootstrap to deviate from ground truth by up to 50%—to be reasonable in many cases. This expectation stems from the fact that the actual or targeted quality of estimators on fairly large datasets is frequently high, leading to estimator quality assessments, such as interquantile ranges, which are small in absolute value; in these cases, it follows that a seemingly large relative error in bootstrap outputs (e.g., 50%) corresponds to a small absolute error. As we demonstrate via an extensive empirical evaluation on both synthetic and real data in the following two sections, our proposed bootstrap performance diagnostic is quite effective, with false positive rates that are generally extremely low or zero and false negative rates that generally approach zero as the subsample sizes b1 , . . . , bk are increased. Of course, like any inferential procedure, our procedure does have some unavoidable limitations, such as in cases where the data generating distribution has very fine-grained adverse features which cannot be reliably observed in datasets of size bk ; we discuss these issues further below.
3.4
Simulation Study
We first evaluate the diagnostic’s effectiveness on data generated from a variety of different synthetic distributions paired with a variety of different estimators. Using simulated data
CHAPTER 3. A GENERAL BOOTSTRAP PERFORMANCE DIAGNOSTIC
43
here allows direct knowledge of the ground truth value ξ(P, n), and by selecting different synthetic distributions, we can design settings that pose different challenges to the diagnostic procedure. For each distribution-estimator pair and sample size n considered, we perform multiple independent runs of the diagnostic on independently generated datasets of size n to compute the Diagnostic True Rate (DTR), the probability that the diagnostic outputs true in that setting. We then evaluate this DTR against the bootstrap’s actual performance on datasets of size n; because the underlying data generating distributions here are known, we can also compare to known theoretical expectations of bootstrap consistency. More precisely, we consider the following data generating distributions: Normal(0,1), Uniform(0,10), StudentT(1.5), StudentT(3), Cauchy(0,1), 0.95Normal(0,1) + 0.05Cauchy(0,1), and 0.99Normal(0,1) + 0.01Cauchy(104 ,1). In our plots, we denote these distributions using the following abbreviations: Normal, Uniform, StuT(1.5), StuT(3), Cauchy, Mixture1, and Mixture2. We also consider the following estimators θˆ (abbreviations, if any, are given in parentheses): mean, median (med), variance (var), standard deviation (std), sample maximum (max), and 95th percentile (perc). The estimator quality assessment ξ in all experiments computes the interquantile range between the 0.025 and 0.975 quantiles of the ˆ distribution of u(D, P ) = θ(D). For all runs of the bootstrap, we use between 200 and 500 resamples, with the precise number of resamples determined by the adaptive hyperparameter selection procedure given in Section 2.5 above. All runs of the diagnostic use the hyperparameter guidelines given in Algorithm 3: p = 100, k = 3, bi = bn/(p2k−i )c, c1 = 0.2, c2 = 0.2, c3 = 0.5, α = 0.95. We consider sample sizes n = 105 and n = 106 . For each distribution-estimator pair and sample size n, we first compute the ground truth value ξ(P, n) as the interquantile range of the u values for 5,000 independently generated datasets of size n. We also approximate the distribution of bootstrap outputs on datasets of size n by running the bootstrap on 100 independently generated datasets of this size. Whether or not this distribution of bootstrap outputs satisfies the performance criterion defined by c3 , α—that is, whether or not the α quantile of the absolute relative deviation of bootstrap outputs from ξ(P, n) is less than or equal to c3 —determines the ground truth conclusion regarding whether or not the bootstrap is performing satisfactorily in a given setting. To actually evaluate the diagnostic’s effectiveness, we then run it on 100 independently generated datasets of size n and estimate the DTR as the fraction of these datasets for which the diagnostic returns true. If the ground truth computations deemed the bootstrap to be performing satisfactorily in a given setting, then the DTR would ideally be 1, and otherwise it would ideally be 0. Figure 3.1 presents our results for all distribution-estimator pairs and both sample sizes n considered. In these plots, dark blue indicates cases in which the ground truth computations on datasets of size n deemed the bootstrap to be performing satisfactorily and the bootstrap is expected theoretically to be consistent (i.e., the DTR should ideally be 1); red indicates cases in which neither of these statements is true (i.e., the DTR should ideally be 0); and light purple indicates cases in which the ground truth computations on datasets of size n deemed the bootstrap to be performing satisfactorily but the bootstrap is not expected theoretically to be consistent (i.e., the DTR should ideally be 1).
CHAPTER 3. A GENERAL BOOTSTRAP PERFORMANCE DIAGNOSTIC
Normal−mean Normal−med Normal−var Normal−std Normal−max Normal−perc Uniform−mean Uniform−med Uniform−var Uniform−std Uniform−max Uniform−perc StuT(1.5)−mean StuT(1.5)−med StuT(1.5)−var StuT(1.5)−std StuT(1.5)−max StuT(1.5)−perc StuT(3)−mean StuT(3)−med StuT(3)−var StuT(3)−std StuT(3)−max StuT(3)−perc Cauchy−mean Cauchy−med Cauchy−var Cauchy−std Cauchy−max Cauchy−perc Mixture1−mean Mixture1−med Mixture1−var Mixture1−std Mixture1−max Mixture1−perc Mixture2−mean Mixture2−med Mixture2−var Mixture2−std Mixture2−max Mixture2−perc
Normal−mean Normal−med Normal−var Normal−std Normal−max Normal−perc Uniform−mean Uniform−med Uniform−var Uniform−std Uniform−max Uniform−perc StuT(1.5)−mean StuT(1.5)−med StuT(1.5)−var StuT(1.5)−std StuT(1.5)−max StuT(1.5)−perc StuT(3)−mean StuT(3)−med StuT(3)−var StuT(3)−std StuT(3)−max StuT(3)−perc Cauchy−mean Cauchy−med Cauchy−var Cauchy−std Cauchy−max Cauchy−perc Mixture1−mean Mixture1−med Mixture1−var Mixture1−std Mixture1−max Mixture1−perc Mixture2−mean Mixture2−med Mixture2−var Mixture2−std Mixture2−max Mixture2−perc
0
0.5
1
Diagnostic True Rate
44
Normal−mean Normal−med Normal−var Normal−std Normal−max Normal−perc Uniform−mean Uniform−med Uniform−var Uniform−std Uniform−max Uniform−perc StuT(1.5)−mean StuT(1.5)−med StuT(1.5)−var StuT(1.5)−std StuT(1.5)−max StuT(1.5)−perc StuT(3)−mean StuT(3)−med StuT(3)−var StuT(3)−std StuT(3)−max StuT(3)−perc Cauchy−mean Cauchy−med Cauchy−var Cauchy−std Cauchy−max Cauchy−perc Mixture1−mean Mixture1−med Mixture1−var Mixture1−std Mixture1−max Mixture1−perc Mixture2−mean Mixture2−med Mixture2−var Mixture2−std Mixture2−max Mixture2−perc
0
0.5
1
Diagnostic True Rate
0
50
100
150
95th Percentile ARD (%)
Figure 3.1: Diagnostic and bootstrap performance on simulated data. Dark blue indicates cases where bootstrap is performing satisfactorily on datasets of size n (based on ground truth computations) and is expected theoretically to be consistent; red indicates cases where neither of these statements is true; light purple indicates cases where bootstrap is performing satisfactorily on datasets of size n (based on ground truth computations) but is not expected theoretically to be consistent. (left and middle) For each distribution-estimator pair, fraction of 100 independent trials for which the diagnostic outputs true. For the left plot, n = 105 ; for the middle plot, n = 106 . (right) For each distribution-estimator pair, 95th percentile of absolute relative deviation of bootstrap output from ground truth, over 100 independent trials on datasets of size n = 106 .
CHAPTER 3. A GENERAL BOOTSTRAP PERFORMANCE DIAGNOSTIC
45
As seen in the lefthand and middle plots (which show DTRs for n = 105 and n = 106 , respectively), our proposed diagnostic performs quite well across a range of data generating distributions and estimators, and its performance improves as it is provided with more data. For the smaller sample size n = 105 , in the dark blue and light purple cases, the DTR is generally markedly greater than 0.5; furthermore, when the sample size is increased to n = 106 , the DTRs in all of the dark blue and light purple cases increase to become uniformly near 1, indicating low false negative rates (i.e., the diagnostic nearly always deems the bootstrap to be performing satisfactorily when it is indeed performing satisfactorily). In the red cases, for both sample sizes, the DTR is nearly always zero, indicating that false positive rates are nearly always zero (i.e., the diagnostic only rarely deems the bootstrap to be performing satisfactorily when it is in fact not performing satisfactorily). Mixture2-var and Mixture2-std with n = 106 provide the only exceptions to this result, which is unsurprising given that Mixture2 was specifically designed to include a small heavy-tailed component which is problematic for the bootstrap but cannot be reliably detected at the smaller sample sizes b1 , . . . , bk ; nonetheless, even in these cases, the righthand plot indicates that the ground truth computations very nearly deemed the bootstrap to be performing satisfactorily. Interestingly, the bootstrap’s finite sample performance for the settings considered nearly always agrees with theoretical expectations regarding consistency; disagreement occurs only when Mixture2 is paired with the estimators mean, var, or std, which is again unsurprising given the properties of Mixture2.
3.5
Real Data
We also evaluate the diagnostic’s effectiveness on three real datasets obtained from Conviva, Inc. [23], which describe different attributes of large numbers of video streams viewed by Internet users. These datasets are routinely subjected to a variety of different analyses by practitioners and are the subject of ongoing efforts to improve the computational efficiency of database systems by processing only data subsamples and quantifying the resulting estimation error [2]. We designate the three (scalar-valued) datasets as follows, with their sizes (i.e., numbers of constituent data points) given in parentheses: Conviva1 (30,470,092), Conviva2 (1,111,798,565), and Conviva3 (2,952,651,449). Histograms of the three datasets are given in Figure 3.2; note that the datasets are heavily skewed and also contain large numbers of repeated values. Due to privacy considerations, we are unable to provide the precise values and corresponding frequencies represented in the data, but the histograms nonetheless convey the shapes of the datasets’ empirical distributions. To circumvent the fact that ground truth values for individual real datasets cannot be obtained, we do not directly apply our diagnostic to these three datasets. Rather, we treat the empirical distribution of each dataset as an underlying data generating distribution which is used to generate the datasets used in our experiments. With this setup, our experiments on the real datasets proceed identically to the experiments in Section 3.4 above, but now with
Binned Conviva1
46
log(counts)
log(counts)
log(counts)
CHAPTER 3. A GENERAL BOOTSTRAP PERFORMANCE DIAGNOSTIC
Binned Conviva2
Binned Conviva3
Figure 3.2: Histograms for the real datasets Conviva1, Conviva2, and Conviva3. Note that the y axes give frequencies on a log scale.
data sampled from the aforementioned empirical distributions rather than from synthetic distributions. Figure 3.3 presents the results of our experiments on the Conviva data. The color scheme used in these plots is identical to that in Figure 3.1, with the addition of magenta, which indicates cases in which the ground truth computations on datasets of size n deemed the bootstrap to not be performing satisfactorily but the bootstrap is expected theoretically to be consistent (i.e., the DTR should ideally be 0). Given that the data generating distributions used in these experiments all have finite support, the bootstrap is expected theoretically to be consistent for all estimators considered except the sample maximum. However, as seen in the righthand plot of Figure 3.3, the bootstrap’s finite sample performance is often quite poor even in cases where consistency is expected; in this regard (as well as in other ways), the real data setting of this section differs substantially from the synthetic data setting considered in Section 3.4 above. The lefthand and middle plots of Figure 3.3 demonstrate that our diagnostic procedure again performs quite well. Indeed, the DTR is again nearly always zero (or is quite small if positive) in the red and magenta cases, indicating false positive rates that are nearly always zero. The dark blue cases generally have DTRs markedly greater than 0.5 for n = 105 (lefthand plot), with DTRs in these cases generally increasing to become nearly 1 for n = 106 , indicating low false negative rates; no light purple cases occur for the real data. Beyond these broad conclusions, it is worth noting that the Conviva2-max, Conviva2-perc, and Conviva3med settings exhibit rather surprising behavior relative to our other results, in that the diagnostic’s performance seems to degrade when the sample size is increased. We believe that this behavior is related to the particularly high redundancy (i.e., degree of repetition of values) in Conviva2 and Conviva3, and it will be the subject of future work.
CHAPTER 3. A GENERAL BOOTSTRAP PERFORMANCE DIAGNOSTIC
Conviva1−mean Conviva1−med Conviva1−var Conviva1−std Conviva1−max Conviva1−perc Conviva2−mean Conviva2−med Conviva2−var Conviva2−std Conviva2−max Conviva2−perc Conviva3−mean Conviva3−med Conviva3−var Conviva3−std Conviva3−max Conviva3−perc 0
Conviva1−mean Conviva1−med Conviva1−var Conviva1−std Conviva1−max Conviva1−perc Conviva2−mean Conviva2−med Conviva2−var Conviva2−std Conviva2−max Conviva2−perc Conviva3−mean Conviva3−med Conviva3−var Conviva3−std Conviva3−max Conviva3−perc
0.5
1
Diagnostic True Rate
47
Conviva1−mean Conviva1−med Conviva1−var Conviva1−std Conviva1−max Conviva1−perc Conviva2−mean Conviva2−med Conviva2−var Conviva2−std Conviva2−max Conviva2−perc Conviva3−mean Conviva3−med Conviva3−var Conviva3−std Conviva3−max Conviva3−perc
0
0.5
1
Diagnostic True Rate
0
100
200
95th Percentile ARD (%)
Figure 3.3: Diagnostic and bootstrap performance on real data. Color scheme is identical to that in Figure 3.1, with the addition of magenta indicating cases where the bootstrap is not performing satisfactorily on datasets of size n (based on ground truth computations) but is expected theoretically to be consistent. (left and middle) For each distribution-estimator pair, fraction of 100 independent trials for which the diagnostic outputs true. For the left plot, n = 105 ; for the middle plot, n = 106 . (right) For each distribution-estimator pair, 95th percentile of absolute relative deviation of bootstrap output from ground truth, over 100 independent trials on datasets of size n = 106 .
48
Chapter 4 Random Conic Pursuit for Semidefinite Programming 4.1
Introduction
Many difficult problems have been shown to admit elegant and tractably computable representations via optimization over the set of positive semidefinite (PSD) matrices. As a result, semidefinite programs (SDPs) have appeared as the basis for many procedures in machine learning and statistics, such as sparse PCA [25], distance metric learning [80], nonlinear dimensionality reduction [78], multiple kernel learning [51], multitask learning [64], and matrix completion [15]. While SDPs can be solved in polynomial time, they remain computationally challenging. General-purpose solvers, often based on interior point methods, do exist and readily provide high-accuracy solutions. However, their memory requirements do not scale well with problem size, and they typically do not allow a fine-grained tradeoff between optimization accuracy and speed, which is often a desirable tradeoff in machine learning and statistical problems that are based on random data. Furthermore, SDPs in machine learning and statistics frequently arise as convex relaxations of problems that are originally computationally intractable, in which case even an exact solution to the SDP yields only an approximate solution to the original problem, and an approximate SDP solution can once again be quite useful. Although some SDPs do admit tailored solvers which are fast and scalable (e.g., [59, 17, 24]), deriving and implementing these methods is often challenging, and an easily usable solver that alleviates these issues has been elusive. This is partly the case because generic first-order methods do not apply readily to general SDPs. In this work, we present Random Conic Pursuit, a randomized solver for general SDPs that is simple, easily implemented, scalable, and of inherent interest due to its novel construction. We consider general SDPs over Rd×d of the form min X�0
f (X)
s.t.
gj (X) ≤ 0,
j = 1 . . . k,
(4.1)
CHAPTER 4. RANDOM CONIC PURSUIT
49
where f and the gj are convex real-valued functions, and � denotes the ordering induced by the PSD cone. Random Conic Pursuit minimizes the objective function iteratively, repeatedly randomly sampling a PSD matrix and optimizing over the random two-dimensional subcone given by this matrix and the current iterate. This construction maintains feasibility while avoiding the computational expense of deterministically finding feasible directions or of projecting into the feasible set. Furthermore, each iteration is computationally inexpensive, though in exchange we generally require a relatively large number of iterations. In this regard, Random Conic Pursuit is similar in spirit to algorithms such as online gradient descent and sequential minimal optimization [65] which have illustrated that in the machine learning setting, algorithms that take a large number of simple, inexpensive steps can be surprisingly successful. The resulting algorithm, despite its simplicity and randomized nature, converges fairly quickly to useful approximate solutions. Unlike interior point methods, Random Conic Pursuit does not excel in producing highly exact solutions. However, it is more scalable and provides the ability to trade off computation for more approximate solutions. In what follows, we present our algorithm in full detail and demonstrate its empirical behavior and efficacy on various SDPs that arise in machine learning; we also provide analytical results that yield insight into its behavior and convergence properties.
4.2
Random Conic Pursuit
Random Conic Pursuit (Algorithm 4) solves SDPs of the general form (4.1) via a sequence of simple two-variable optimizations (4.2). At each iteration, the algorithm considers the twodimensional cone spanned by the current iterate, Xt , and a random rank one PSD matrix, Yt . It selects as its next iterate, Xt+1 , the point in this cone that minimizes the objective f subject to the constraints gj (Xt+1 ) ≤ 0 in (4.1). The distribution of the random matrices is periodically updated based on the current iterate (e.g., to match the current iterate in expectation); these updates yield random matrices that are better matched to the optimum of the SDP at hand. The two-variable optimization (4.2) can be solved quickly in general via a two-dimensional bisection search. As a further speedup, for many of the problems that we considered, the twovariable optimization can be altogether short-circuited with a simple check that determines whether the solution Xt+1 = Xt , with βˆ = 1 and α ˆ = 0, is optimal. Additionally, SDPs with a trace constraint tr X = 1 force α + β = 1 and therefore require only a one-dimensional optimization. Random Conic Pursuit can also readily benefit from the use of parallel and distributed computational resources (though our experiments below are all performed in the serial singleprocessor setting). In particular, during each iteration, we can use multiple processors to simultaneously draw multiple different instantiations of Yt and select that which yields the greatest decrease in the objective function; this approach can potentially yield substantial benefits, particularly during later iterations in which finding feasible descent directions is
CHAPTER 4. RANDOM CONIC PURSUIT
50
Algorithm 4: Random Conic Pursuit [brackets contain a particular, generally effective, sampling scheme] Input: A problem of the form (4.1) n ∈ N: number of iterations X0 : a feasible initial iterate [κ ∈ (0, 1): numerical stability parameter] Output: An approximate solution Xn to (4.1) p ← a distribution over Rd [p ← N (0, Σ) with Σ = (1 − κ)X0 + κId ] for t ← 1 to n do Sample xt from p and set Yt ← xt x0t Set α ˆ , βˆ to the optimizer of min f (αYt + βXt−1 )
α,β∈R
s.t. gj (αYt + βXt−1 ) ≤ 0, α, β ≥ 0 ˆ t−1 Set Xt ← α ˆ Yt + βX if α ˆ > 0 then Update p based on Xt end return Xn
j = 1...k
(4.2)
[p ← N (0, Σ) with Σ = (1 − κ)Xt + κId ]
more difficult so that often α ˆ = 0. Furthermore, optimization of (4.2), including the underlying basic matrix operations (which are usually simple operations such as matrix additions or inner products rather than more complicated operations such as inversions), can often be straightforwardly parallelized. Two simple guarantees for Random Conic Pursuit are immediate. First, its iterates are feasible for (4.1) because each iterate is a positive sum of two PSD matrices, and because the constraints gj of (4.2) are also those of (4.1). Second, the objective values decrease monotonically because β = 1, α = 0 is a feasible solution to (4.2). We must also note two limitations of Random Conic Pursuit: it does not admit general equality constraints, and it requires a feasible starting point. Nonetheless, for many of the SDPs that appear in machine learning and statistics, feasible points are easy to identify, and equality constraints are either absent or fortuitously pose no difficulty. We can gain further intuition by observing that Random Conic Pursuit’s iterates, Xt , are positive weighted sums of random rank one matrices and so lie in the random polyhedral cones ( t ) X Ftx := γi xt x0t : γi ≥ 0 ⊂ {X : X � 0}. (4.3) i=1
Thus, Random Conic Pursuit optimizes the SDP (4.1) by greedily optimizing f with respect to the gj constraints within an expanding sequence of random cones {Ftx }. These cones yield successively better inner approximations of the PSD cone (a basis for which is the set of all
CHAPTER 4. RANDOM CONIC PURSUIT
51
rank one matrices) while allowing us to easily ensure that the iterates remain PSD. In light of this discussion, one might consider approximating the original SDP by sampling a random cone Fnx in one shot and replacing the constraint X � 0 in (4.1) with the simpler linear constraints X ∈ Fnx . For sufficiently large n, Fnx would approximate the PSD cone well (see Theorem 5 below), yielding an inner approximation that upper bounds the original SDP; the resulting problem would be easier than the original (e.g., it would become a linear program if the gj were linear). However, we have found empirically that a very large n is required to obtain good approximations, thus negating any potential performance improvements (e.g., over interior point methods). Random Conic Pursuit successfully resolves this issue by iteratively expanding the random cone Ftx . As a result, we are able to much more efficiently access large values of n, though we compute a greedy solution within Fnx rather than a global optimum over the entire cone. This tradeoff is ultimately quite advantageous.
4.3
Applications and Experiments
We assess the practical convergence and scaling properties of Random Conic Pursuit by applying it to three different machine learning and statistical tasks that rely on SDPs: distance metric learning, sparse PCA, and maximum variance unfolding. For each, we compare the performance of Random Conic Pursuit (implemented in MATLAB) to that of a standard and widely used interior point solver, SeDuMi [71] (via cvx [40]), and to the best available solver which has been customized for each problem. To evaluate convergence, we first compute a ground-truth solution X ∗ for each problem instance by running the interior point solver with extremely low tolerance. Then, for each algorithm, we plot the normalized objective value errors [f (Xt ) − f (X ∗ )]/|f (X ∗ )| of its iterates Xt as a function of the amount of time required to generate each iterate. Additionally, for each problem, we plot the value of an application-specific metric for each iterate. These metrics provide a measure of the practical implications of obtaining SDP solutions which are suboptimal to varying degrees. We evaluate scaling with problem dimensionality by running the various solvers on problems of different dimensionalities and computing various metrics on the solver runs as described below for each experiment. Unless otherwise noted, we use the bracketed sampling scheme given in Algorithm 4 with κ = 10−4 for all runs of Random Conic Pursuit.
4.3.1
Metric Learning
Given a set of datapoints in Rd and a pairwise psimilarity relation over them, metric learning extracts a Mahalanobis distance dA (x, y) = (x − y)0 A(x − y) under which similar points are nearby and dissimilar points are far apart [80]. Let S be the set of similar pairs of datapoints, and let S¯ be its complement. The metric learning SDP, for A ∈ Rd×d and
CHAPTER 4. RANDOM CONIC PURSUIT C=
P
(i,j)∈S (xi
52
− xj )(xi − xj )0 , is min A�0
tr(CA)
s.t.
X
dA (xi , xj ) ≥ 1.
(4.4)
(i,j)∈S¯
To apply Random Conic Pursuit, X0 is set to a feasible scaled identity matrix. We solve the two-variable optimization (4.2) via a double bisection search: at each iteration, α is optimized out with a one-variable bisection search over α given fixed β, yielding a function of β only. This resulting function is itself then optimized using a bisection search over β. As the application-specific metric for this problem, we measure the extent to which the metric learning goal has been achieved: similar datapoints should be near each other, and dissimilar datapoints should bePfarther away. We adopt the following metric of quality of a ¯ and 1[·] is the indicator |{j : (i, j) ∈ S}| · |{l : (i, l) ∈ S}| solution matrix X, where ζ = iP P P function: Q(X) = ζ1 i j:(i,j)∈S l:(i,l)∈S¯ 1[dij (X) < dil (X)]. To examine convergence behavior, we first apply the metric learning SDP to the UCI ionosphere dataset, which has d = 34 and 351 datapoints with two distinct labels (S contains pairs with identical labels). We selected this dataset from among those used in [80] because it is among the datasets which have the largest dimensionality and experience the greatest impact from metric learning in that work’s clustering application. Because the interior point solver scales prohibitively badly in the number of datapoints, we subsampled the dataset to yield 4 × 34 = 136 datapoints. To evaluate scaling, we use synthetic data in order to allow variation of d. To generate a d-dimensional data set, we first generate mixture centers by applying a random rotation to the elements of C1 = {(−1, 1), (−1, −1)} and C2 = {(1, 1), (1, −1)}. We then sample each datapoint xi ∈ Rd from N (0, Id ) and assign it uniformly at random to one of two clusters. Finally, we set the first two components of xi to a random element of Ck if xi was assigned to cluster k ∈ {1, 2}; these two components are perturbed by adding a sample from N (0, 0.25I2 ). The best known customized solver for the metric learning SDP is a projected gradient algorithm [80], for which we used code available from the author’s website. Figure 4.1 shows the results of our experiments on an ionosphere data problem instance. The two trajectory plots show that Random Conic Pursuit converges to a very high-quality solution (with high Q and negligible objective value error) significantly faster than interior point. Additionally, our performance is comparable to that of the projected gradient method which has been customized for this task. Table 4.1 illustrates scaling for increasing d. Interior point scales badly in part because parsing the SDP becomes impracticably slow for d significantly larger than 100. Nonetheless, Random Conic Pursuit scales well beyond that point, continuing to return solutions with high Q in reasonable time. On this synthetic data, projected gradient appears to reach high Q somewhat more quickly, though Random Conic Pursuit consistently yields significantly better objective values, indicating better-quality solutions.
CHAPTER 4. RANDOM CONIC PURSUIT
53 1
Interior Point Random Pursuit Projected Gradient
0.08 0.06 0.04 0.02 0 0
734
1468 2202 time (sec)
2936
pairwise distance quality (Q)
normalized objective value error
0.1
0.8
0.6 Interior Point Random Pursuit Projected Gradient 734 1468 2202 2936 time (sec)
0.4 0
Figure 4.1: Results for metric learning on UCI ionosphere data: trajectories of objective value error (left) and Q (right). d 100 100 100 200 200 300 300 400 400
alg IP RCP PG RCP PG RCP PG RCP PG
f after 2 hrs∗ 3.7e-9 2.8e-7, 3.0e-7 1.1e-5 5.1e-8, 6.1e-8 1.6e-5 5.4e-8, 6.5e-8 2.0e-5 7.2e-8, 1.0e-8 2.4e-5
time to Q > 0.99 636.3 142.7, 148.4 42.3 529.1, 714.8 207.7 729.1, 1774.7 1095.8 2128.4, 2227.2 1143.3
Table 4.1: Results for metric learning scaling experiments on synthetic data (IP = interior point, RCP = Random Conic Pursuit, PG = projected gradient), with two trials per d for Random Conic Pursuit and times in seconds. ∗ For d = 100, third column shows f after 20 minutes.
4.3.2
Sparse PCA
Sparse PCA seeks to find a sparse unit length vector that maximizes x0 Ax for a given data covariance matrix A. This problem can be relaxed to the following SDP [25], for X, A ∈ Rd×d : min X�0
ρ10 |X|1 − tr(AX) s.t.
tr(X) = 1,
(4.5)
where the scalar ρ > 0 controls the solution’s sparsity. A subsequent rounding step returns the dominant eigenvector of the SDP’s solution, yielding a sparse principal component. We use the colon cancer dataset [3] that has been used frequently in past studies of sparse PCA and contains 2,000 microarray readings for 62 subjects. The goal is to identify a small number of microarray cells that capture the greatest variance in the dataset. We vary d by
CHAPTER 4. RANDOM CONIC PURSUIT
54
subsampling the readings and use ρ = 0.2 (large enough to yield sparse solutions) for all experiments. To apply Random Conic Pursuit, we set X0 = A/ tr(A). The trace constraint (4.5) implies that tr(Xt−1 ) = 1 and so tr(αYt + βXt−1 ) = α tr(Yt ) + β = 1 in (4.2). Thus, we can simplify the two-variable optimization (4.2) to a one-variable optimization, which we solve by bisection search. The fastest available customized solver for the sparse PCA SDP is an adaptation of Nesterov’s smooth optimization procedure [25] (denoted by DSPCA), for which we used a MATLAB implementation with heavy MEX optimizations that is downloadable from the author’s web site. We compute two application-specific metrics which capture the two goals of sparse PCA: high captured variance and high sparsity. Given the top eigenvector u of a solution matrix X, P 1 0 its captured variance is u Au, and its sparsity is given by d j 1[|uj | < τ ]; we take τ = 10−3 based on qualitative inspection of the raw microarray data covariance matrix A. The results of our experiments are shown in Figure 4.2 and Table 4.2. As seen in the plots, on a problem instance with d = 100, Random Conic Pursuit quickly achieves an objective value within 4% of optimal and thereafter continues to converge, albeit more slowly; we also quickly achieve fairly high sparsity (compared to that of the exact SDP optimum). In contrast, interior point is able to achieve lower objective value and even higher sparsity within the timeframe shown, but, unlike Random Conic Pursuit, it does not provide the option of spending less time to achieve a solution which is still relatively sparse. All of the solvers quickly achieve very similar captured variances, which are not shown. DSPCA is extremely efficient, requiring much less time than its counterparts to find nearly exact solutions. However, that procedure is highly customized (via several pages of derivation and an optimized implementation), whereas Random Conic Pursuit and interior point are general-purpose. Table 4.2 illustrates scaling by reporting achieved objecive values and sparsities after the solvers have each run for 4 hours. Interior point fails due to memory requirements for d > 130, whereas Random Conic Pursuit continues to function and provide useful solutions, as seen from the achieved sparsity values, which are much larger than those of the raw data covariance matrix. Again, DSPCA continues to be extremely efficient.
4.3.3
Maximum Variance Unfolding (MVU)
MVU searches for a kernel matrix that embeds high-dimensional input data into a lowerdimensional manifold [78]. Given m data points and a neighborhood relation i ∼ j between them, it forms their centered and normalized Gram matrix G ∈ Rm×m and the squared Euclidean distances d2ij = Gii + Gjj − 2Gij . The desired kernel matrix is the solution of the following SDP, where X ∈ Rm×m and the scalar ν > 0 controls the dimensionality of the
0.1
Interior Point Random Pursuit DSPCA
0.08 0.06 0.04 0.02 0 0
1076
2152 3228 time (sec)
55
0.52 top eigenvector sparsity
normalized objective value error
CHAPTER 4. RANDOM CONIC PURSUIT
0.39
0.26 Interior Point Random Pursuit DSPCA
0.13
4304
0
1076
2152 3228 time (sec)
4304
Figure 4.2: Results for sparse PCA: trajectories of objective value error (left) and sparsity (right), for a problem with d = 100. All solvers quickly yield similar captured variance (not shown here).
d 120 120 120 200 200 200 300 300 300 500 500 500
alg IP RCP DSPCA IP RCP DSPCA IP RCP DSPCA IP RCP DSPCA
f after 4 hrs -10.25 -9.98, -10.02 -10.24 failed -10.30, -10.27 -11.07 failed -9.39, -9.29 -11.52 failed -6.95, -6.54 -11.61
sparsity after 4 hrs 0.55 0.47, 0.45 0.55 failed 0.51, 0.50 0.64 failed 0.51, 0.51 0.69 failed 0.53, 0.50 0.78
Table 4.2: Results for sparse PCA scaling experiments (IP = interior point, RCP = Random Conic Pursuit), with two trials per d for Random Conic Pursuit.
CHAPTER 4. RANDOM CONIC PURSUIT
56
resulting embedding: max X�0
tr(X) − ν
X (Xii + Xjj − 2Xij − d2ij )2
s.t.
10 X1 = 0.
(4.6)
i∼j
To apply Random Conic Pursuit, we set X0 = G and use the general sampling formulation in Algorithm 4 by setting p = N (0, Π(∇f (Xt ))) in the initialization (i.e., t = 0) and update steps, where Π truncates negative eigenvalues of its argument to zero. This scheme empirically yields improved performance for the MVU problem as compared to the bracketed sampling scheme in Algorithm 4. To handle the equality constraint, each Yt is first transformed to Y˘t = (I − 110 /m)Yt (I − 110 /m), which preserves PSDness and ensures feasibility. The two-variable optimization (4.2) proceeds as before on Y˘t and becomes a two-variable quadratic program, which can be solved analytically. MVU also admits a gradient descent algorithm, which serves as a straw-man large-scale solver for the MVU SDP. At each iteration, the step size is picked by a line search, and the spectrum of the iterate is truncated to maintain PSDness. We use G as the initial iterate. To generate data, we randomly sample m points from the surface of a synthetic swiss roll [78]; we set ν = 1. To quantify the amount of time required for a solver to converge, we run it until its objective curve appears qualitatively flat and declare the convergence point to be the earliest iterate whose objective value is within 1% of the best objective value seen so far (which we denote by fˆ). Figure 4.3 and Table 4.3 illustrate that Random Conic Pursuit’s objective values converge quickly, and on problems where the interior point solver achieves the optimum, Random Conic Pursuit nearly achieves that optimum. The interior point solver runs out of memory when m > 400 and also fails on smaller problems if its tolerance parameter is not tuned. Random Conic Pursuit easily runs on larger problems for which interior point fails, and for smaller problems its running time is within a small factor of that of the interior point solver. The gradient descent solver is orders of magnitude slower than the other solvers and failed to converge to a meaningful solution for m ≥ 400 even after 2000 iterations (which took 8 hours).
4.4
Analysis
Analysis of Random Conic Pursuit is complicated by the procedure’s use of randomness and its handling of the constraints gj ≤ 0 explicitly in the sub-problem (4.2), rather than via penalty functions or projections. Nonetheless, we are able to obtain useful insights by first analyzing a simpler setting having only a PSD constraint. We thus obtain a bound on the rate at which the objective values of Random Conic Pursuit’s iterates converge to the SDP’s optimal value when the problem has no constraints of the form gj ≤ 0: Theorem 4 (Convergence rate of Random Conic Pursuit when f is weakly convex and k = 0). Let f : Rd×d → R be a convex differentiable function with L-Lipschitz gradients such
CHAPTER 4. RANDOM CONIC PURSUIT
57 4
8
3000
x 10
2800 Objective value
Objective value
6 2600 2400 2200
4
2 2000
Interior Point Random Pursuit 10 20 30 Time (sec)
1800 0
0 0
100
Random Pursuit 200 300 400 Time (sec)
Figure 4.3: Results for MVU: trajectories of objective value for problems with m = 200 (left) and m = 800 (right). m 40 40 40 200 200 200 400 400 800 800
alg IP RCP GD IP RCP GD IP RCP IP RCP
f after convergence 23.4 22.83 (0.03) 23.2 2972.6 2921.3 (1.4) 2943.3 12255.6 12207.96 (36.58) failed 71231.1 (2185.7)
seconds to f > 0.99fˆ 0.4 0.5 (0.03) 5.4 12.4 6.6 (0.8) 965.4 97.1 26.3 (9.8) failed 115.4 (29.2)
Table 4.3: Results for MVU scaling experiments showing convergence as a function of m (IP = interior point, RCP = Random Conic Pursuit, GD = gradient descent). Standard deviations over 10 runs of Random Conic Pursuit are shown in parentheses. that the minimum of the following optimization problem is attained at some X ∗ : min f (X). X�0
(4.7)
Let X1 . . . Xt be the iterates of Algorithm 4 when applied to this problem starting at iterate X0 (using the bracketed sampling scheme given in the algorithm specification), and suppose that kXt − X ∗ k is bounded. Then, Ef (Xt ) − f (X ∗ ) ≤
1 · max(ΓL, f (X0 ) − f (X ∗ )), t
for some constant Γ that does not depend on t.
(4.8)
CHAPTER 4. RANDOM CONIC PURSUIT
58
See the appendix for proof. Despite the extremely simple and randomized nature of Random Conic Pursuit, the theorem guarantees that its objective values converge at the rate O(1/t) on an important subclass of SDPs. We omit here some readily available extensions: for example, the probability that a trajectory of iterates violates the above rate can be bounded by noting that the iterates’ objective values behave as a finite difference submartingale. Additionally, the theorem and proof could be generalized to hold for a broader class of sampling schemes. Directly characterizing the convergence of Random Conic Pursuit on problems with constraints appears to be significantly more difficult and seems to require introduction of new quantities depending on the constraint set (e.g., condition number of the constraint set and its overlap with the PSD cone) whose implications for the algorithm are difficult to explicitly characterize with respect to d and the properties of the gj , X ∗ , and the Yt sampling distribution. Indeed, it would be useful to better understand the limitations of Random Conic Pursuit. As noted above, the procedure cannot readily accommodate general equality constraints; furthermore, for some constraint sets, sampling only a rank one Yt at each iteration could conceivably cause the iterates to become trapped at a sub-optimal boundary point (this could be alleviated by sampling higher rank Yt ). A more general analysis is the subject of continuing work, though our experiments confirm empirically that we realize usefully fast convergence of Random Conic Pursuit even when it is applied to a variety of constrained SDPs. We obtain a different analytical perspective by recalling that Random Conic Pursuit computes a solution within the random polyhedral cone Fnx , defined in (4.3) above. The distance between this cone and the optimal matrix X ∗ is closely related to the quality of solutions produced by Random Conic Pursuit. The following theorem characterizes the distance between a sampled cone Fnx and any fixed X ∗ in the PSD cone: Theorem 5. Let X ∗ � 0 be a fixed positive definite matrix, and let x1 , . . . , xn ∈ Rd be drawn i.i.d. from N (0, Σ) with Σ � X ∗ . Then, for any δ > 0, with probability at least 1 − δ, √ ∗ −1 � 2 log 1δ 2 q 1 + −1 −1 −1 ∗ ∗ √ −Σ · ΣX min kX − X k ≤
X
X∈Fnx e n 2 See the appendix for proof. As expected, Fnx provides a progressively better approximation to the PSD cone (with high probability) as n grows. Furthermore, the rate at which this occurs depends on X ∗ and its relationship to Σ; as the latter becomes better matched to the former, smaller values of n are required to achieve an approximation of given quality. The constant Γ in Theorem 4 can hide a dependence on the dimensionality d of the problem, though the proof of Theorem 5 helps to elucidate the dependence of Γ on d and X ∗ for the particular case when Σ does not vary over time (the constants in Theorem 5 arise from bounding kγt (xt )xt x0t k). A potential concern regarding both of the above theorems is the possibility of extremely adverse dependence of their constants on the dimensionality d and the properties (e.g., condition number) of X ∗ . However, our empirical results in Section 4.3 show that Random Conic Pursuit does indeed decrease the objective function
CHAPTER 4. RANDOM CONIC PURSUIT
59
usefully quickly on real problems with relatively large d and solution matrices X ∗ which are rank one, a case predicted by the analysis to be among the most difficult.
4.5
Related Work
Random Conic Pursuit and the analyses above are related to a number of existing optimization and sampling algorithms. Our procedure is closely related to feasible direction methods [72], which move along descent directions in the feasible set defined by the constraints at the current iterate. Cutting plane methods [47], when applied to some SDPs, solve a linear program obtained by replacing the PSD constraint with a polyhedral constraint. Random Conic Pursuit overcomes the difficulty of finding feasible descent directions or cutting planes, respectively, by sampling directions randomly and also allowing the current iterate to be rescaled. Pursuit-based optimization methods [22, 49] return a solution within the convex hull of an a priori-specified convenient set of points M. At each iteration, they refine their solution to a point between the current iterate and a point in M. The main burden in these methods is to select a near-optimal point in M at each iteration. For SDPs having only a trace equality constraint and with M the set of rank one PSD matrices, Hazan [46] shows that such points in M can be found via an eigenvalue computation, thereby obtaining a convergence rate of O(1/t). In contrast, our method selects steps randomly and still obtains a rate of O(1/t) in the unconstrained case. The Hit-and-Run algorithm for sampling from convex bodies can be combined with simulated annealing to solve SDPs [55]. In this configuration, similarly to Random Conic Pursuit, it conducts a search along random directions whose distribution is adapted over time. Finally, whereas Random Conic Pursuit utilizes a randomized polyhedral inner approximation of the PSD cone, the work of Calafiore and Campi [18] yields a randomized outer approximation to the PSD cone obtained by replacing the PSD constraint X � 0 with a set of sampled linear inequality constraints. It can be shown that for linear SDPs, the dual of the interior LP relaxation is identical to the exterior LP relaxation of the dual of the SDP. Empirically, however, this outer relaxation requires impractically many sampled constraints to ensure that the problem remains bounded and yields a good-quality solution.
4.A
Appendix: Proofs
Proof of Theorem 4. We prove that equation (4.8) holds in general for any X ∗ , and thus for the optimizer of f in particular. The convexity of f implies the following linear lower bound on f (X) for any X and Y : f (X) ≥ f (Y ) + h∂f (Y ), X − Y i.
(4.9)
CHAPTER 4. RANDOM CONIC PURSUIT
60
The Lipschitz assumption on the gradient of f implies the following quadratic upper bound on f (X) for any X and Y [60]: f (X) ≤ f (Y ) + h∂f (Y ), X − Y i + L2 kX − Y k2 .
(4.10)
Define the random variable Y˜t := γt (Yt )Yt with γt a positive function that ensures E Y˜t = X ∗ . It suffices to set γt = q(Y )/˘ p(Y ), where p˘ is the distribution of Yt and q is any distribution ∗ with mean X . In particular, the choice Y˜t := γt (xt )xt x0t with γt (x) = N (x|0, X ∗ )/N (x|0, Σt ) satisfies this. At iteration t, Algorithm 4 produces αt and βt so that Xt+1 := αt Yt + βt Xt minimizes f (Xt+1 ). We will bound the difference f (Xt+1 ) − f (X ∗ ) at each iteration by sub-optimally ˆ t+1 = βˆt Xt + α picking α ˆ t = 1/t, βˆt = 1 − 1/t, and X ˆ t γt (Yt )Yt = βˆt Xt + α ˆ t Y˜t . Conditioned on Xt , we have Ef (Xt+1 ) − f (X ∗ ) ≤ Ef (βˆt Xt + α ˆ t Y˜t ) − f (X ∗ ) � � 1 ˜ = Ef Xt − t (Xt − Yt ) − f (X ∗ ) D E ≤ f (Xt ) − f (X ∗ ) + E ∂f (Xt ), 1t (Y˜t − Xt ) +
(4.11) (4.12) L EkXt 2t2
− Y˜t k2 (4.13)
− Y˜t k2 ≤ f (Xt ) − f (X ∗ ) + 1t (f (X ∗ ) − f (Xt )) + 2tL2 EkXt − Y˜t k2 � � = 1 − 1 f (Xt ) − f (X ∗ ) + L2 EkXt − Y˜t k2 . = f (Xt ) − f (X ∗ ) + 1t h∂f (Xt ), X ∗ − Xt i +
t
L EkXt 2t2
2t
(4.14) (4.15) (4.16)
The first inequality follows by the suboptimality of α ˆ t and βˆt , the second by Equation (4.10), and the third by (4.9). Define et := Ef (Xt ) − f (X ∗ ). The term EkY˜t − Xt k2 is bounded above by some absolute constant Γ because EkY˜t − Xt k2 = EkY˜t − X ∗ k2 + kXt − X ∗ k2 . The first term is bounded because it is the variance of Y˜t , and the second term by assumption. Taking � is bounded LΓ 1 expectation over Xt gives the bound et+1 ≤ 1 − t et + 2t2 , which is solved by et = 1t · max(ΓL, f (X0 ) − f (X ∗ )) [58]. Proof of Theorem 5. We wish to bound the tails of the random variable
n
X
min γi xi x0i − X ∗ . γ1 ...γn ≥0
(4.17)
i=1
We first simplify the problem by eliminating the minimization over γ. Define a function γ(x; X ∗ ) : Rd → R+ that satisfies Ex∼N (0,Σ) γ(x)xx0 = X ∗ . The choice γ(x) =
� 0 ∗−1 −1 � −1/2 N (x|0, X ∗ ) = |Σ|1/2 X ∗ exp − x (X 2−Σ )x N (x|0, Σ)
(4.18)
(4.19)
CHAPTER 4. RANDOM CONIC PURSUIT
61
works, since Ex∼N (0,Σ) γ(x)xx0 = Ex∼N (0,X ∗ ) xx0 = X ∗ . Setting sub-optimally the coefficients γi to γ(xi ) gives
n
n
X
X
γi xi x0i − X ∗ ≤ n1 min γ(xi )xi x0i − Eγ(x)xx0 (4.20) γ≥0
i=1
i=1 n
X
1 zi − Ez . (4.21) = n
i=1
Thus, it suffices to bound the tails of the deviation of an empirical average of i.i.d. random variables zi := γ(xi )xi x0i from its expectation, Ez = X ∗ . We proceed using McDiarmid’s inequality. The scalar random variables kzi k are bounded because for all x, we have: � 0 ∗−1 −1 � − 1 1 kzk = kγ(x)xx0 k = kxx0 k|Σ| 2 X ∗ 2 exp − x (X 2−Σ )x � � − 1 1 λ (X ∗−1 −Σ−1 )kxk22 ≤ |Σ| 2 X ∗ 2 kxk22 exp − min 2 − 1 1 2|Σ| 2 X ∗ 2 ≤ eλmin (X ∗ −1 − Σ−1 ) �−1 2 1 ∗ − 21
−1 ∗ −1 = |Σ| 2 X −Σ
X
e 2 =: ∆.
(4.22) (4.23) (4.24) (4.25) (4.26)
1 . Equation (4.24) follows because the function f (y) = ye−αy is bounded above by eα
P n 1
The expectation of n i=1 zi − Ez , whose tails we wish to bound, is the standard P deviation of n1 ni=1 zi , and can be bounded in the standard way in a Hilbert space:
!2
2 n n
1 X
1 X
� 1
E zi − Ez ≤ E zi − Ez = Ekzk2 − kEzk2 ,
n
n
n i=1 i=1
(4.27)
which yields
n
X
∆
E n1 zi − Ez ≤ √ .
n i=1
(4.28)
CHAPTER 4. RANDOM CONIC PURSUIT
62
Using Equations (4.21) and (4.28), and the fact that kzi k ≤ ∆, McDiarmid’s inequality gives
" # n
X ∆
γi xi x0i − X ∗ > √ + � Pr min (4.29) γ≥0
n i=1
" n #
X
∆
≤ Pr n1 zi − Ez > √ + � (4.30)
n i=1
" n # n
X
X
≤ Pr n1 zi − Ez > E n1 zi − Ez + �
i=1 � i=12 � n� (4.31) ≤ exp − 2 . 2∆ In other words, for any δ > 0, with probability at least 1 − δ,
n
X
� √ ∆ �
0 ∗ min γi xi xi − X < √ 1 + 2 log 1δ . γ≥0
n i=1
(4.32)
63
Chapter 5 Conclusion In the preceding chapters, we have proposed novel algorithms—the Bag of Little Bootstraps (BLB), a general bootstrap performance diagnostic, and Random Conic Pursuit—which advance the state of the art for two important classes of problems in machine learning and statistics: estimator quality assessment and semidefinite programming. BLB provides a powerful new alternative for automatic, accurate assessment of estimator quality that is well suited to large-scale data and modern parallel and distributed computing architectures. Our procedure shares the favorable statistical properties (i.e., consistency and higher-order correctness) and generic applicability of the bootstrap, while typically having a markedly better computational profile, as we have demonstrated via large-scale experiments on a distributed computing platform. Additionally, BLB is consistently more robust than the m out of n bootstrap and subsampling to the choice of subset size and does not require the use of analytical corrections. To enhance our procedure’s computational efficiency and render it more automatically usable, we have introduced a means of adaptively selecting its hyperparameters. We have also applied BLB to several real datasets and presented an extension to non-i.i.d. time series data. A number of open questions and possible extensions remain for BLB. Though we have constructed an adaptive hyperparameter selection method based on the properties of the subsampling and resampling processes used in BLB, as well as empirically validated the method, it would be useful to develop a more precise theoretical characterization of its behavior. Additionally, as discussed in Section 2.5, it would be beneficial to develop a computationally efficient means of adaptively selecting b. It may also be possible to further reduce r by using methods that have been proposed for reducing the number of resamples required by the bootstrap [31, 33]. (j) Furthermore, it is worth noting that averaging the plugin approximations ξ(Qn (Pn,b )) computed by BLB implicitly corresponds to minimizing the squared error of BLB’s output. It would be possible to specifically optimize for other losses on estimator quality assessments— thereby improving statistical performance with respect to such losses—by combining the (j) ξ(Qn (Pn,b )) in other ways (e.g., by using medians rather than averages). While BLB shares the statistical strengths of the bootstrap, we conversely do not expect
CHAPTER 5. CONCLUSION
64
our procedure to be applicable in cases in which the bootstrap fails [9]. Indeed, it was such edge cases that originally motivated development of the m out of n bootstrap and subsampling, which are consistent in various settings that are problematic for the bootstrap. It would be interesting to investigate the performance of BLB in such settings and perhaps use ideas from the m out of n bootstrap and subsampling to improve the applicability of BLB in these edge cases while maintaining computational efficiency and robustness. Although our development of BLB has focused on scalability as the number of available data points increases, various modern data analysis problems exhibit simultaneous growth in number of data points, data dimensionality, and number of parameters to be estimated. As a result, various work in recent years has sought to characterize the statistical performance of inferential procedures in this high-dimensional scaling regime. That research has particularly focused on procedures for point estimation, such as the Lasso [74], and generally makes assumptions (e.g., regarding sparsity of parameters) which allow effective estimation even as the number of parameters to be estimated increases with the number of available data points. Theoretical and empirical investigation of the performance of resampling-based methods for estimator quality assessment (e.g., the bootstrap, BLB, and the m out of n bootstrap) in the high-dimensional scaling regime, and determination of appropriate assumptions under which these techniques are effective (perhaps with some modification) in this setting, would be both interesting and useful. In addition to addressing the issue of scalability in estimator quality assessment via BLB, we have presented a general diagnostic procedure which permits automatic determination of whether or not the bootstrap is performing satisfactorily when applied to a given dataset and estimator; we have demonstrated the effectiveness of our procedure via an empirical evaluation on a variety of estimators and simulated and real data. A number of avenues of potential future work remain in this vein. Additional study of the influence of the diagnostic’s various hyperparameters would be useful. It would also be interesting to evaluate the diagnostic’s effectiveness on yet more data generating distributions, estimators, and estimator quality assessments. Furthermore, it would be interesting to apply our diagnostic procedure to other estimator quality assessment methods such as BLB, the m out of n bootstrap [9], and subsampling [67]. It would also be fairly straightforward to devise extensions of the diagnostic which are suitable for variants of the bootstrap designed to handle non-i.i.d. data [33, 45, 50, 54, 66]. For such bootstrap variants, the diagnostic might aid in selecting a resampling mechanism which respects the dependency structure of the underlying data generating distribution (e.g., by helping to select an appropriate block size when resampling stationary time series). It should also be possible to characterize theoretically the consistency of our diagnostic procedure, showing that its false positive and false negative rates approach zero as b1 , . . . , bk , p → ∞ and c1 , c2 → 0, under some assumptions (e.g., monotonicity of the bootstrap’s convergence to ground truth in cases where it is performing satisfactorily). It would be interesting to make such a result precise. Finally, we have presented Random Conic Pursuit, a simple, easily implemented randomized solver for general semidefinite programs (SDPs). Unlike interior point methods,
CHAPTER 5. CONCLUSION
65
our procedure does not excel at producing highly exact solutions. However, it is more scalable and provides useful approximate solutions fairly quickly, characteristics that are often desirable in machine learning and statistical applications. This fact is illustrated by our experiments on three different machine learning and statistical tasks based on SDPs; we have also provided an analysis yielding further insight into Random Conic Pursuit. In potential future work, it would be interesting to study the use of other matrix sampling distributions (beyond those considered in our work) in Random Conic Pursuit. Additionally, Random Conic Pursuit can readily benefit from the use of parallel and distributed computational resources, and it would be interesting to empirically evaluate the resulting performance gains. Finally, further analysis of Random Conic Pursuit, particularly in the setting of SDPs with general constraints, would be of interest.
66
Bibliography [1] D. Agarwal, R. Agrawal, R. Khanna, and N. Kota. Estimating rates of rare events with multiple hierarchies through scalable log-linear models. In ACM SIGKDD Conference on Knowledge Discovery and Data Mining (KDD), 2010. [2] S. Agarwal, A. Panda, B. Mozafari, S. Madden, and I. Stoica. BlinkDB: Queries with bounded errors and bounded response times on very large data. Technical Report 1203.5485, ArXiv, June 2012. [3] U. Alon, N. Barkai, D. A. Notterman, K. Gish, S. Ybarra, D. Mack, and A. J. Levine. Broad patterns of gene expression revealed by clustering analysis of tumor and normal colon tissues probed by oligonucleotide arrays. Proceedings of the National Academy of Sciences of the USA, 96:6745–6750, June 1999. [4] A. Asuncion, P. Smyth, and M. Welling. Asynchronous distributed learning of topic models. In Advances in Neural Information Processing Systems (NIPS), 2008. [5] S. Baker, J. Berger, P. Brady, K. Borne, S. Glotzer, R. Hanisch, D. Johnson, A. Karr, D. Keyes, B. Pate, and H. Prosper. Data-enabled science in the mathematical and physical sciences, 2010. Workshop funded by the National Science Foundation. [6] R. Beran. Diagnosing bootstrap success. Annals of the Institute of Statistical Mathematics, 49(1):1–24, 1997. [7] D. P. Bertsekas and J. N. Tsitsiklis. Parallel and Distributed Computation: Numerical Methods. Prentice-Hall, Inc., 1989. [8] P. J. Bickel and D. A. Freedman. Some asymptotic theory for the bootstrap. Annals of Statistics, 9(6):1196–1217, 1981. [9] P. J. Bickel, F. G¨otze, and W. R. van Zwet. Resampling fewer than n observations: Gains, losses, and remedies for losses. Statistica Sinica, 7:1–31, 1997. [10] P. J. Bickel and A. Sakov. Extrapolation and the bootstrap. Sankhya: The Indian Journal of Statistics, 64:640–652, 2002.
BIBLIOGRAPHY
67
[11] P. J. Bickel and A. Sakov. On the choice of m in the m out of n bootstrap and confidence bounds for extrema. Statistica Sinica, 18:967–985, 2008. [12] P. J. Bickel and J. A. Yahav. Richardson extrapolation and the bootstrap. Journal of the American Statistical Association, 83(402):387–393, 1988. [13] D. M. Blei, A. Y. Ng, and M. I. Jordan. Latent Dirichlet allocation. Journal of Machine Learning Research, 3:993–1022, 2003. [14] L. Bottou and O. Bousquet. The tradeoffs of large scale learning. In Advances in Neural Information Processing Systems (NIPS), 2007. [15] S. Boyd and L. Vandenberghe. Convex Optimization. Cambridge University Press, 2004. [16] T. Brants, A. C. Popat, P. Xu, F. J. Och, and J. Dean. Large language models in machine translation. In Joint Conference on Empirical Methods in Natural Language Processing and Computational Natural Language Learning, 2007. [17] S. Burer and R. D. C. Monteiro. Local minima and convergence in low-rank semidefinite programming. Mathematical Programming, 103(3):427–444, 2005. [18] G. Calafiore and M. C. Campi. Uncertain convex programs: Randomized solutions and confidence levels. Mathematical Programming, 102(1):25–46, 2005. [19] A. J. Canty, A. C. Davison, D. V. Hinkley, and V. Ventura. Bootstrap diagnostics and remedies. The Canadian Journal of Statistics, 34(1):5–27, 2006. [20] L. Chin, W. C. Hahn, G. Getz, and M. Meyerson. Making sense of cancer genomic data. Genes and Development, 25:534–555, 2011. [21] C. Chu, S. K. Kim, Y. Lin, Y. Yu, G. Bradski, A. Y. Ng, and K. Olukotun. Map-reduce for machine learning on multicore. In International Conference on Machine Learning (ICML), 2006. [22] K. Clarkson. Coresets, sparse greedy approximation, and the Frank-Wolfe algorithm. In Symposium on Discrete Algorithms (SODA), 2008. [23] Conviva, Inc. http://www.conviva.com, November 2012. [24] A. d’Aspremont. Subsampling algorithms for semidefinite programming. Technical Report 0803.1990, ArXiv, 2009. [25] A. d’Aspremont, L. El Ghaoui, M. I. Jordan, and G. R. G. Lanckriet. A direct formulation for sparse PCA using semidefinite programming. SIAM Review, 49(3):434–448, 2007.
BIBLIOGRAPHY
68
[26] J. Dean and S. Ghemawat. MapReduce: Simplified data processing on large clusters. In Symposium on Operating System Design and Implementation (OSDI), 2004. [27] P. Diaconis and B. Efron. Computer-intensive methods in statistics. Scientific American, 248:96–108, 1983. [28] F. Doshi-Velez, D. Knowles, S. Mohamed, and Z. Ghahramani. Large scale nonparametric bayesian inference: Data parallelisation in the Indian buffet process. In Advances in Neural Information Processing Systems (NIPS), 2009. [29] J. Duchi, A. Agarwal, and M. Wainwright. Dual averaging for distributed optimization: Convergence analysis and network scaling. IEEE Transactions on Automatic Control, 57(3):592–606, March 2012. [30] B. Efron. Bootstrap methods: Another look at the jackknife. Annals of Statistics, 7(1):1–26, 1979. [31] B. Efron. More efficient bootstrap computations. Journal of the American Statistical Association, 85(409):79–89, 1988. [32] B. Efron. Jackknife-after-bootstrap standard errors and influence functions. Journal of the Royal Statistical Society, Series B, 54(1):83–127, 1992. [33] B. Efron and R. Tibshirani. An Introduction to the Bootstrap. Chapman and Hall, 1993. [34] A. Frank and A. Asuncion. http://archive.ics.uci.edu/ml, 2010.
UCI
machine
learning
repository.
[35] M. H. Fritz, R. Leinonen, G. Cochrane, and E. Birney. Efficient storage of high throughput DNA sequencing data using reference-based compression. Genome Research, 21:734–740, 2011. [36] E. Gin´e and J. Zinn. Bootstrapping general empirical measures. Annals of Probability, 18(2):851–869, 1990. [37] J. Gonzalez, Y. Low, A. Gretton, and C. Guestrin. Parallel Gibbs sampling: From colored fields to thin junction trees. In Artificial Intelligence and Statistics (AISTATS), 2011. [38] J. Gonzalez, Y. Low, and C. Guestrin. Residual splash for optimally parallelizing belief propagation. In Artificial Intelligence and Statistics (AISTATS), 2009. [39] J. Gonzalez, Y. Low, C. Guestrin, and D. O’Hallaron. Distributed parallel inference on large factor graphs. In Uncertainty in Artificial Intelligence (UAI), 2009. [40] M. Grant and S. Boyd. CVX: Matlab software for disciplined convex programming, version 1.21. http://cvxr.com/cvx, May 2010.
BIBLIOGRAPHY
69
[41] Apache Hadoop. http://hadoop.apache.org, April 2012. [42] J. Hahn. Bootstrapping quantile regression estimators. Econometric Theory, 11(1):105– 121, 1995. [43] K. B. Hall, S. Gilpin, and G. Mann. MapReduce/Bigtable for distributed optimization. In NIPS 2010 Workshop on Learning on Cores, Clusters and Clouds, 2010. [44] P. Hall. The Bootstrap and Edgeworth Expansion. Springer-Verlag New York, Inc., 1992. [45] P. Hall and E. Mammen. On general resampling algorithms and their performance in distribution estimation. Annals of Statistics, 22(4):2011–2030, 1994. [46] E. Hazan. Sparse approximate solutions to semidefinite programs. In Latin American Conference on Theoretical Informatics, pages 306–316, 2008. [47] C. Helmberg. A cutting plane algorithm for large scale semidefinite relaxations. In Martin Gr¨otschel, editor, The Sharpest Cut, chapter 15. MPS/SIAM Series on Optimization, 2001. [48] M. Hoffman, D. Blei, and F. Bach. Online learning for latent Dirichlet allocation. In Advances in Neural Information Processing Systems (NIPS), 2010. [49] L. K. Jones. A simple lemma on greedy approximation in Hilbert space and convergence rates for projection pursuit regression and neural network training. Annals of Statistics, 20(1):608–613, March 1992. [50] H. R. Kunsch. The jackknife and the bootstrap for general stationary observations. Annals of Statistics, 17(3):1217–1241, 1989. [51] G. R. G. Lanckriet, N. Cristianini, P. Bartlett, L. El Ghaoui, and M. I. Jordan. Learning the kernel matrix with semidefinite programming. Journal of Machine Learning Research, 5:27–72, December 2004. [52] N. Laptev, K. Zeng, and C. Zaniolo. Early accurate results for advanced analytics on MapReduce. In Proceedings of the VLDB Endowment, volume 5, pages 1028–1039, 2012. [53] P. Liang and D. Klein. Online EM for unsupervised models. In North American Association for Computational Linguistics (NAACL), 2009. [54] R. Y. Liu and K. Singh. Moving blocks jackknife and bootstrap capture weak dependence. In R. LePage and L. Billard, editors, Exploring the Limits of the Bootstrap, pages 225–248. Wiley, 1992. [55] L. Lov´asz and S. Vempala. Fast algorithms for logconcave functions: Sampling, rounding, integration and optimization. In Foundations of Computer Science (FOCS), 2006.
BIBLIOGRAPHY
70
[56] Y. Low, J. Gonzalez, A. Kyrola, D. Bickson, C. Guestrin, and J. M. Hellerstein. GraphLab: A new framework for parallel machine learning. In Uncertainty in Artificial Intelligence (UAI), 2010. [57] Y. Low, J. Gonzalez, A. Kyrola, D. Bickson, C. Guestrin, and J. M. Hellerstein. Distributed GraphLab: A framework for machine learning and data mining in the cloud. In Proceedings of Very Large Data Bases (PVLDB), 2012. [58] A. Nemirovski, A. Juditsky, G. Lan, and A. Shapiro. Robust stochastic approximation approach to stochastic programming. SIAM Journal on Optimization, 19(4):1574–1609, 2009. [59] Y. Nesterov. Smooth minimization of non-smooth functions. Mathematical Programming, 103(1):127–152, May 2005. [60] Y. Nesterov. Smoothing technique and its applications in semidefinite optimization. Mathematical Programming, 110(2):245–259, July 2007. [61] D. Newman, A. Asuncion, P. Smyth, and M. Welling. Distributed inference for latent Dirichlet allocation. In Advances in Neural Information Processing Systems (NIPS), 2007. [62] F. Niu, B. Recht, C. Re, and S. J. Wright. Hogwild!: A lock-free approach to parallelizing stochastic gradient descent. In Advances in Neural Information Processing Systems (NIPS), 2011. [63] J. Nocedal and S. J. Wright. Numerical Optimization. Springer, 2006. [64] G. Obozinski, B. Taskar, and M. I. Jordan. Joint covariate selection and joint subspace selection for multiple classification problems. Statistics and Computing, pages 1573– 1375, 2009. [65] J. Platt. Using sparseness and analytic QP to speed training of Support Vector Machines. In Advances in Neural Information Processing Systems (NIPS), 1999. [66] D. N. Politis and J. P. Romano. The stationary bootstrap. Journal of the American Statistical Association, 89(428):1303–1313, 1994. [67] D. N. Politis, J. P. Romano, and M. Wolf. Subsampling. Springer, 1999. [68] A. Pollack. DNA sequencing caught in deluge of data. The New York Times, November 2011. [69] H. Putter and W. R. van Zwet. Resampling: Consistency of substitution estimators. Annals of Statistics, 24(6):2297–2318, 1996. [70] J. Shao. Mathematical Statistics. Springer, second edition, 2003.
BIBLIOGRAPHY
71
[71] J. F. Sturm. Using SeDuMi 1.02, a MATLAB toolbox for optimization over symmetric cones. Optimization Methods and Software, 11-12:625–653, 1999. [72] W. Sun and Y. Yuan. Optimization Theory and Methods: Nonlinear Programming. Springer, 2006. [73] R. Tibshirani. How many bootstraps? Technical report, Department of Statistics, Stanford University, Stanford, CA, 1985. [74] R. Tibshirani. Regression shrinkage and selection via the lasso. Journal of the Royal Statistical Society, Series B, 58(1):267–288, 1996. [75] J. Uszkoreit, J. M. Ponte, A. C. Popat, and M. Dubiner. Large scale parallel document mining for machine translation. In International Conference on Computational Linguistics, 2010. [76] A. W. van der Vaart. Asymptotic Statistics. Cambridge University Press, 1998. [77] A. W. van der Vaart and J. A. Wellner. Weak Convergence and Empirical Processes. Springer-Verlag New York, Inc., 1996. [78] K. Q. Weinberger, F. Sha, Q. Zhu, and L. K. Saul. Graph Laplacian regularization for large-scale semidefinite programming. In Advances in Neural Information Processing Systems (NIPS), 2006. [79] J. Wolfe, A. Haghighi, and D. Klein. Fully distributed EM for very large datasets. In International Conference on Machine Learning (ICML), 2008. [80] E. P. Xing, A. Y. Ng, M. I. Jordan, and S. Russell. Distance metric learning, with application to clustering with side-information. In Advances in Neural Information Processing Systems (NIPS), 2002. [81] F. Yan, N. Xu, and Y. Qi. Parallel inference for latent Dirichlet allocation on graphics processing units. In Advances in Neural Information Processing Systems (NIPS), 2009. [82] M. Zaharia, M. Chowdhury, T. Das, A. Dave, J. Ma, M. McCauley, M. J. Franklin, S. Shenker, and I. Stoica. Resilient distributed datasets: A fault-tolerant abstraction for in-memory cluster computing. In USENIX NSDI, 2012. [83] M. Zinkevich, M. Weimer, A. Smola, and L. Li. Parallelized stochastic gradient descent. In Advances in Neural Information Processing Systems (NIPS), 2010.