QUARTERLY REPORT QUARTERLY REPORT FIRST QUARTER 2015
1
Table of Contents
Topic
Section
Pages
Plan Overview Plan Overview
1
3‐16 3 16
Administrative Overview
2
17‐27
Local Office Activity
3
28‐35
Appendix
4
36‐41
2
Plan Overview 3
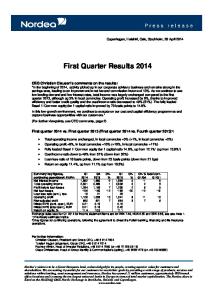
Assets $4,725,877,857
$4 622 493 622 $4,622,493,622
$4,492,076,192
2Q14
Net Asset Change Beginning Balance Deposits Net Transfers Fees Distributions Change in Value Interest/Dividends Ending Balance Outstanding Loans g Loans Outstanding g Total Assets Including Total Assets in Ending Balance As Roth Balances Net Asset Change
$4,477,873,196
3Q14
2Q 2014 $4,339,966,073 $86,095,654 ($46,283) ($701,032) ($ , ) ($69,071,979) $135,832,759 $1,000 $4,492,076,192 $177,125,939 $4,669,202,131 $ , , , $18,732,891
4Q14
3Q 2014 $4,492,076,192 $82,369,965 $12,283 ($811,258) ($ , ) ($65,752,330) ($30,021,655) $0 $4,477,873,196 $181,255,986 $4,659,129,182 $ , , , $20,721,955
1Q15
4Q 2014 $4,477,873,196 $77,665,191 ($212,800) ($600,681) ($ , ) ($60,400,297) $120,929,360 $7,239,653 $4,622,493,622 $182,022,498 $4,804,516,120 $ , , , $24,013,572
1Q 2015 $4,622,493,622 $98,224,092 $205,800 ($714,047) ($ , ) ($72,485,646) $77,983,837 $170,199 $4,725,877,857 $183,237,169 $4,909,115,026 $ , , , $27,434,994
4
Quarter End Assets $1,800,000,000.00
$1,600,000,000.00
$1,400,000,000.00
$1,200,000,000.00
$1,000,000,000.00
$800,000,000.00
$400,000,000.00
$600,000,000.00
$200,000,000.00
$0.00
Schwab Selff -Directed
FDIC - Insurred Savings Account
Def erred Co ompensation Stable Value
DCP Bond Fund F
DCP Large Cap C Fund
DCP Mid Ca ap Fund
DCP Small Cap C Fund
SSGA Russ sell Small Cap Index NL L Series S
DWS EAFE Equity Index Instittutional
Fidelity Dive ersif ied International
Ultra Conserrvative Prof ile Portf olio o
Conservative Prof ile Portf olio
Moderate Prrof ile Portf olio
Aggressive Prof P ile Portf olio
Ultra Aggres ssive Prof ile Portf olio
Total Assets =$ 4,725,877,857 D t il Details on page 37 37
5
Historical Assets $5,000,000,000.00
$4,725,877,857 $4,500,000,000.00
$4,000,000,000.00
$3,500,000,000.00
$3,000,000,000.00
$2,500,000,000.00
$1,453,122,265 $2,000,000,000.00
$1,500,000,000.00
$1,000,000,000.00
$500,000,000.00
$0.00
6
Quarter End Participants 11,932
12,147
12,344
12,050
28,677
28,610
28,562
29,003
2Q14
3Q14
4Q14
1Q15
Contributing Participants
Contributing Participants Non-Contributing Participants Total Participants New Participants Added Average Roth Deferral Average Pre-Tax Deferral Average Bi-Weekly Deferral for the quarter Median Account Balance Participants with a Roth account
Non-Contributing Participants 2Q14 28,677 11,932 40,609
3Q14 28,610 12,147 40,757
4Q14 28,562 12,344 40,906
1Q15 29,003 12,050 41,053
321
361
352
390
$167 $269 $273 $49,858 2,885
$164 $267 $271 $49,134 3,139
$154 $255 $259 $50,424 3,400
$173 $287 $292 $50,964 3,695
7
Historical Participants 44,000
41,053
42,000 40,000 38,000 36,000 34,000
28,692
32,000 30,000 , 28,000 26,000 24,000 22,000 20,000 18 000 18,000 16,000 14,000 12,000 10,000 8,000 6,000 4,000 2,000 0
8
($232,214,824)
Schwab Self-Directed
Deferred C Compensation Stable Value
FDIC C - Insured Savings Account
DCP Bond Fund
DCP Large Cap Fund
DCP Mid Cap Fund
DCP Small Cap Fund
$556,353
($3,297,652)
($252,700 0)
($1,526,131)
($347,602)
DWS EAFE Equity Index
SSGA Russell Small Cap Index NL Series S
($931,226 6)
$226,708,555
$8,334,499
$14,565,571
$687,879
Ultra Co onservative Profile Portfolio
Fide elity Diversified International
$445,596
$6,208,297
$3,590,233
$3,417,397
Co onservative Profile Portfolio
Moderate Profile Portfolio
Aggressive Profile Portfolio
Ultra Aggressive Profile Portfolio
Net Cash Flow
Net Cash Flow Detail can be found on page 39 9
Net Transfer Activity Net Transf er Out
Net Transf er In $6,201,371
Schwab Self -Directed Def erred Compensation Stable Value
($2,271,020)
FDIC - Insured Savings Account
($2,205,174)
DCP Bond
($308,685)
DCP Large Cap Fund
($4,678,594)
DCP Mid Cap Fund $12,191,370 DCP Small Cap Fund SSGA Russell Small Cap Index NL Series S
$226,887,385 ($234,351,463)
DWS EAFE Equity Index
($921,953)
Fidelity Diversif ied International
($2,157,213)
Ultra Conservative Prof ile Portf olio Conservative Prof ile Portf olio
$101,426 ($33,190)
Moderate Prof ile Portf olio Aggressive Prof ile Portf olio Ultra Aggressive Prof ile Portf olio
$2,950,761 ($1,533,913) $334,693
Transfer Activity Detail can be found on page 38 10
Participant Transfer Activity Transfers Out
Schwab Self -Directed
($6,210,613)
Def erred Compensation Stable Value
($47,746,403)
FDIC - Insured Savings Account
($28,071,210)
DCP Bond
($6,701,765)
DCP Large Cap Fund
($29,248,758)
DCP Mid Cap Fund
($8,519,446)
DCP Small Cap Fund SSGA Russell Small Cap Index NL Series S
Transfers In
$12,411,984 $45,475,383 $25,866,035 $6,393,080 $24,570,164 $20,710,816
($2,035,429) ($250,122,677)
$228,922,814 $15,771,214
DWS EAFE Equity Index
($2,843,961)
$1,922,008
Fidelity Diversif ied International
($6,558,230)
$4,401,016
Ultra Conservative Prof ile Portf olio
($8,126,446)
$8,227,872
Conservative Prof ile Portf olio
($10,865,105)
$10,831,915
Moderate Prof ile Portf olio
($10,012,402)
$12,963,163
Aggressive Prof ile Portf olio Ultra Aggressive Prof ile Portf olio
($14,556,189) ($20,691,775)
$13,022,275 $21,026,468
Transfer Activity Detail can be found on page 38 11
Asset Allocation by Asset Class $1,800,000,000
$1,600,000,000
$1,400,000,000
$1 200 000 000 $1,200,000,000
$1,000,000,000
$800,000,000
$600,000,000
$400,000,000
$200 000 000 $200,000,000
$0
Profile Portf olios
International
Small Cap Blend
Mid Cap Blend
Large-Cap
Bond
Stable Value Fund
Fixed Bank Fund
Self-Directed
Total Assets
$794,121,296
$217,493,752
$225,038,039
$230,689,252
$1,578,600,218
$165,385,247
$903,858,339
$290,958,424
$319,733,292
Participants
28,196
11,992
9,616
7,084
21,055
8,071
12,979
9,088
5,025
12
Asset Allocation by Asset Class as Percentage of Total
Self-Directed, 7% Fixed Bank, 6%
Profile Portfolios, 17%
International, 5% Stable Value, 19%
Small Cap Blend, 5% Bond, 4%
Mid Cap Blend, 5%
Large-Cap, 33%
at 06/30/14 at 09/30/14 at 12/31/14 at 03/31/15
Profile Portfolios 16.1% 16.2% 16.4% 16.8%
International 5.1% 4.8% 4.5% 4.6%
Small Cap Blend 5.1% 4.6% 4.8% 4.8%
Mid Cap Blend 4.1% 4.2% 4.5% 4.9%
Large-Cap g p 33.1% 33.3% 33.8% 33.3%
Bond 3.5% 3.6% 3.5% 3.5%
Stable Value 19.9% 20.1% 19.5% 19.1%
Fixed Bank Self-Directed 6.5% 6.6% 6.5% 6.7% 6.4% 6.6% 6.2% 6.8%
13
Contribution Allocation by Asset Class $20,000,000
$18,000,000
$16,000,000
$14,000,000
$12,000,000
$10,000,000
$8,000,000
$6,000,000
$4,000,000
$2,000,000
$0
Total Contribution Dollars Total Participant Count Roth Contribution Dollars* Roth Participant Count
Prof ile Portf olios
International
Small Cap Blend
Mid Cap Blend
Large Cap
Bond
Stable Value
Fixed Bank Fund
Self -Directed
$18,923,180
$3,712,203
$3,737,095
$4,175,858
$18,321,187
$2,417,654
$7,660,774
$3,972,278
$2,093,551
28,196 $1,190,483 3,758
11,992 $186,055 1,108
9,616 $201,463 900
7,084 $269,991 992
21,055 $679,580 1,557
8,071 $109,937 565
12,979 $218,068 765
9,088 $125,322 423
5,025 $128,263 281
*Roth Contribution Dollars are represented in dark green in the bar chart above. 14
Contribution Allocation by Asset Class by Pct of Total
Self -Directed, 3% Fi d B Fixed Bank, k 6% Prof ile Portf olios, 30% Stable Value, 12% Bond, 4%
International, 6%
Small Cap p Blend, 6%
g p 28% Large-Cap,
Mid Cap Blend, 7%
at 06/30/14 at 09/30/14 at 12/31/14 at 03/31/15
Profile P f li Portfolios 27.7% 28.7% 29.8% 29.5%
IInternational i l 6.3% 6.2% 6.0% 5.7%
Small Cap Bl d Blend 6.5% 6.2% 5.9% 5.8%
Mid Cap Bl d Blend 5.6% 5.8% 5.8% 6.5%
Large-Cap L C 27.3% 27.7% 27.9% 27.9%
Bondd B 3.8% 3.7% 3.7% 3.7%
SStable bl Value Vl 12.9% 12.0% 11.5% 11.6%
Fixedd Bank Fi B k Self-Directed S lf Di d 6.6% 3.3% 6.5% 3.2% 6.2% 3.2% 6.0% 3.3%
15
Average Account Balance $115,116
$113 002 $113,002
$110,617 $109,867
2Q14
3Q14
4Q14
1Q15
CA TEGORY
# Of Ppts
Percent
BALANCE
Percent
Less Than $25,000 $25 000 $25,001-$50,000 $50,001-$75,000 $75,001-$100,000 $100,001-$125,000 $125,001-$150,000 $150,001-175,000 $175,001-$200,000 $ , $ , $200,001-$300,000 $300,001-$400,000 $400,001-$500,000 $500,001-$600,000 $600,001-$700,000 $700,001-$800,000 $800,001-$900,000 $900,001-$1,000,000 over $1,000,001
14,017 14 017 6,345 3,721 2,738 2,078 1,631 1,357 1,166 , 3,442 2,101 1,153 546 303 165 113 69 108
34.1% 34 1% 15.5% 9.1% 6.7% 5.1% 4.0% 3.3% 2.8% 8.4% 5.1% 2.8% 1.3% 0.7% 0.4% 0.3% 0.2% 0.3%
139,491,694 139 491 694 230,863,899 230,127,947 237,540,929 232,583,929 224,146,082 220,157,099 218,418,014 , , 846,312,488 725,009,111 513,312,600 296,998,348 196,170,823 123,169,608 95,677,513 65,323,838 130,573,934
3.0% 3 0% 4.9% 4.9% 5.0% 4.9% 4.7% 4.7% 4.6% 17.9% 15.3% 10.9% 6.3% 4.2% 2.6% 2.0% 1.4% 2.8%
Total
41,053
100%
$4,725,877,857
100%
16
Administrative Overview 17
Distributions by Dollar and Participant $50,000,000
Dollar Amounts
$45,000,000
Periodic Installments
$40,000,000 $35,000,000
Partial Withdrawals
$30,000,000 $30,000,000
Full Withdrawals
$25,000,000 $20,000,000 $15,000,000 $10,000,000 $5,000,000 $0 SEP SERVICE/ RETIREMENT
HARDSHIP
PLAN TO PLAN TRANSFER
SERVICE CREDITS
MINIMUM DISTRIBUTIONS
DEATH
OTHER
2,500
Participant Counts Periodic Installments Partial Withdrawals
2,000 1,500
F ull Withdrawals
1,000 500 0 SEP SERVICE/ RETIREMENT
HARDSHIP
PLAN TO PLAN TRANSFER
SERVICE CREDITS
MINIMUM DISTRIBUTIONS
DEATH
OTHER
Full details regarding distributions (including loan information) are found on the next page. LACERS Transfers
Total number of transfers: Total amount of transfers: Participants over Age 60
Distributions for this age bracket: Distributions for this age bracket: Number that are loans Number that are Service Credits
18 $607,241.41 8,816 1 857 1,857 103 8
18
Distribution Detail FULL DISTRIBUTIONS TOTALS CEDO/QDRO / DEATH DEMINIMUS HARDSHIP PLAN TO PLAN TRANSFER RETIREMENT SEP SERVICE SEP SERVICE
PARTIAL DISTRIBUTIONS TOTALS CEDO/QDRO DEMINIMUS DEATH HARDSHIP LOAN MINIMUM DISTRIBUTIONS PLAN TO PLAN TRANSFER RETIREMENT SEP SERVICE EXTERNAL TRANSFERS EXTERNAL TRANSFERS SERVICE CREDITS
PERIODIC INSTALLMENTS TOTALS CEDO/QDRO DEATH MINIMUM DISTRIBUTIONS RETIREMENT 70 1/2 INSER
Distribution Amounts
$16,094,015.85 334,762.75 , 1,096,358.71 0.00 0.00 0.00 214,055.68 14,448,838.71
$49,407,086.92 339,598.73 0.00 477,215.07 369 368 56 369,368.56 18,849,108.65 305,555.20 0.00 1,609,654.14 25,806,004.81 190 758 73 190,758.73 1,459,823.03
$6,984,542.83 16,287.75 308,660.68 1,397,649.66 5,246,944.74 15,000.00
Percent
100.0% 2.1% 6.8% 0.0% 0.0% 0.0% 1.3% 89.8%
100.0% 0.7% 0.0% 1.0% 0 7% 0.7% 38.2% 0.6% 0.0% 3.3% 52.2% 0 4% 0.4% 3.0%
100.0% 0.2% 4.4% 20.0% 75.1% 0.2%
Participant Count
239 10 19 0 0 0 26 184
2,337 15 0 20 59 1,360 41 0 50 614 2 176
1,608 6 67 393 1,141 1
Percent
100.0% 4.2% 7.9% 0.0% 0.0% 0.0% 10.9% 77.0%
100.0% 0.6% 0.0% 0.9% 2 5% 2.5% 58.2% 1.8% 0.0% 2.1% 26.3% 0 1% 0.1% 7.5%
100.0% 0.4% 4.2% 24.4% 71.0% 0.1%
Average Withdrawal
$67,338.98 33,476.28 , 57,703.09 n/a n/a n/a 8,232.91 78,526.30
$21,141.24 22,639.92 n/a 23,860.75 6,260.48 6 260 48 13,859.64 7,452.57 n/a 32,193.08 42,029.32 95,379.37 95 379 37 8,294.45
$4,343.62 2,714.63 4,606.88 3,556.36 4,598.55 15,000.00
19
Rollovers Out & Into the Plan Rollovers Out
(18 837 446) (18,837,446)
Rollovers In
30 072 879 30,072,879
Calendar Year 2015
(72,190,821)
51,856,500
Calendar Year 2014
(75,910,421)
72,630,088
Calendar Year 2013
(100,000,000)
(60,000,000)
(20,000,000)
20,000,000
60,000,000
100,000,000
20
Rollovers to IRA Summary by Top Ten Providers by Dollars
$3,000,000.00
$20,000,000.00
$2,500,000.00
$18,000,000.00
$2,000,000.00
$16,000,000.00
$1,500,000.00
$1,000,000.00
$500,000.00
$14,000,000.00 $12,000,000.00 $10,000,000.00
$‐
$8,000,000.00 $6,000,000.00 $4,000,000.00 $2,000,000.00 $0.00 TOP TEN
ALL PROVIDERS
The top 10 providers represent 68% of total assets withdrawn and rolled to an IRA in 1Q 2015.
21
Loan Overview 16,000 14,000
12,953
12,964
13,429
12,000 10,000 8,000
6,454
6,408
6,954
6,000 4,000 , 2,000
958
940
1,011
0 JAN
FEB
MAR
APR
MAY
One Outstanding Loan
JUN
JUL
AUG
Two Outstanding Loans
SEP
OCT
NOV
DEC
Defaulted Loans
Loan Balance Details for Active Loans
Total Balance of Outstanding Loans as of March 31, 2015: $183,237,169.12 Average Balance of Outstanding Loans as of March 31, 2015: $8,747.66 Total Balance of Defaulted Loans as of March 31, 2015: $6,415,053.77 Loan Balance Details for Retiree Loans
Total number of retiree loans: New number of retiree loans added during the quarter: Total number of converted loans: New number of converted loans added during the quarter:
530 54 315 39
Loan Default Details for Quarter
Total number of loans defaulted during the quarter: Total dollar amount of defaulted loans during the quarter:
87 $674,219.34
Historical data found on page 40.
22
Loan Highlight by Year 2013
Loan Initiations
2014
2015
700 600
100
555 497
541
504 463
620
546 544
579 581
652 514
560 595
593 561
FEB
547
JAN
476 4 506
200
443 444 420
300
524 427 393
400
612 550
500
DEC
18,85 0 19,310
19,016 19,384
18,679 19,464
19,185 5 20,374
19,160 20,410
19,328 8 20,479 9
0
NOV
0
OCT
0
SEP
0
AUG
0
JUL
0
JUN
0
MAY
0
APR
0
MAR
18,648 8 19,325
0
Average New Loan Initiations 2013: 555 2014: 519 2015 453 Outstanding Loans 25,000 20,000
MAR
18,085 5 19,152 2
FEB
18,063 3 19,051
0
18,008 8 19,547 7 20,383 3
5,000
18,72 23 19,448 8 19,372
10,000
18,18 88 18,971 1 19,407 7
15,000
0 JAN
APR
MAY
JUN
JUL
AUG
SEP
OCT
NOV
DEC
Average Outstanding Loans 2013: 18,661 2014: 19,576 19 576 2015: 19,721 Historical data found on page 40.
23
Hardships Denial Reasons
Hardships Processed During Quarter Pending Documentation, 7
No Qualif ying Event, 3
Denied , 3
Approved, 72
Distribution Reasons
Uninsured Medical Expenses, 5 Funeral Expenses, 0 Loss of Income/ Injury, 1 Loss of Income/ Illness, 9 Prevention of Eviction, 28
Prevention of Foreclosure Foreclosure, 29
24
Keytalk® Statistics 2 000 2,000
1,708
1,600 1,400
1,737
1,800
1 200 1,200
800 600
533
1,000
122 2
95
200
17
400
0
Total Logins Keytalk: 11,266 25
Internet Statistics 40,000 35,000
35,355
30,000 25,000
4,894
1,,983
5 000 5,000
155 5
10,000
12,765
15,000
1,835
10,114
20 000 20,000
0
Total Logins Internet: 242,450 Average Logins Internet Monthly: 80 817 Average Logins Internet Monthly: 80,817 Average Distinct Users Monthly: 11,785 26
Online Statement Delivery
Quarter Ending Online Statements Total Statements 12/31/2011 2,369 3/31/2012 2,348 6/30/2012 2,918 9/30/2012 2 956 2,956 12/31/2012 3,003 3/31/2013 4,014 6/30/2013 4,088 9/30/2013 4,218 12/31/2013 5,434 3/31/2014 6 318 6,318 6/30/2014 7,508 9/30/2014 8,254 12/31/2014 9,580 3/31/2015 10,508
Percentage Utilization 40,348 40,566 40,582 40 494 40,494 40,392 40,550 40,604 40,582 40,635 40 734 40,734 40,609 40,757 40,906 41,061
5.87% 5.79% 7.19% 7 30% 7.30% 7.43% 9.90% 10.07% 10.39% 13.37% 15 51% 15.51% 18.49% 20.25% 23.42% 25.59%
27
Local Office Activity 28
Total Participant Contact 1st Quarter 2015 3,511
3,056
• 1st Quarter • Met with approximately 9,625 participants.
3,069
• Popular topics: Deferral Changes Purchase of Service Changes, Purchase of Service Credits, Accrued Leaves, Catch‐ Up Requests, Loan Requests, Distribution Requests, Retirement Calculator DROP Retirement Calculator, DROP Rollovers, Asset Allocation, Website Assistance and Enrollments
March 2012 ‐ March 2015 March 2012 ‐ March 2015 5,000 4,500 4,000 3,500 3 000 3,000 2,500
Participant contact is the total number of employees and participants that we have spoke with in person or over via phone at group meetings and individual counseling sessions. meetings and individual counseling sessions.
2,000 1,500 1,000 500 ‐ Mar‐12 Jun‐12
Sep‐12 Dec‐12 Mar‐13 Jun‐13
Sep‐13 Dec‐13 Mar‐14 Jun‐14
Sep‐14 Dec‐14 Mar‐15
29
Group Meetings / Facility Visits 1st Quarter 2015 31
• Topics
24 21
• Increased visits LACERS Retirement Presentations, Parking Enforcement, Rec. & Parks Los Angeles World Parks, Los Angeles World Airports (LAX) • Continued Table Service at DWP, Harbor Department, FPPEN Retirement Presentations, and NEO’s at DWP and Police.
March 2012 ‐ March 2015 40 35 30 25 20 15
The data presented includes table service, group meetings and retirement presentations.
10 5 ‐ Mar‐12 Jun‐12
Sep‐12
Dec‐12 Mar‐13 Jun‐13
Sep‐13
Dec‐13 Mar‐14 Jun‐14
Sep‐14 Dec‐14 Mar‐15
30
Type of Meetings Year‐To‐Date
31
16 13
6 4 3
2 1 Benefits Fair
DROP
Enrollment
Mid Career
New Employee Orientation
Plan Update
Retirement
Table Service
31
Group Meetings by Department ‐ YTD Row Labels Meetings Attendees Individual Sessions Enrollments DWP 22 739 341 89 Fire 3 25 21 1 Fire/Police Pension 3 145 24 LA Zoo 1 100 6 2 LACERS 7 265 111 9 LAPPL 2 76 76 8 LAWA 11 109 94 25 Lib Library 1 6 3 3 Personnel 4 53 12 Police 4 116 96 65 Port of LA-Harbor 3 50 50 7 Public Works 2 87 9 11 Rec and Parks 1 11 5 1 p 12 233 133 52 Transportation Grand Total 76 2,015 981 273 32
Attendees at Group Meetings 1st Quarter 2015
830
•DWP • New New Employee Orientations Employee Orientations at JFB and Sun Valley; and Retirement Presentations
603
582
•Fire/Police Pensions (FPPEN) • Retirement Meetings and DROP Meetings •Los Angeles World Airports (LAX)
March 2012 ‐ 2015
1,400
• New Employee Orientations
1,200 1,000
•Transportation
800
• All Parking Enforcement locations
600 400 200 200 ‐ Mar‐12
Jun‐12
Sep‐12
Dec‐12
Mar‐13
Jun‐13
Sep‐13
Dec‐13
Mar‐14
Jun‐14
Sep‐14
Dec‐14
Mar‐15
33
Individual Counseling Sessions Counseling Session Topics
1st Quarter 2015 739
894
• Accrued Leave Request
714
• Asset Allocation • Beneficiary updates p • Catch‐up Contributions • Contribution Changes • Distribution Requests • DROP Rollover Assistance DROP R ll A it
March 2012 ‐ 2015
1,000
• Loans
900
• Purchase of Service Credits
800 700
• Retirement Calculator assistance
600 500 400
• Website login/PIN assistance
300 200 00 100 ‐ Mar‐12
Jun‐12
Sep‐12
Dec‐12
Mar‐13
Jun‐13
Sep‐13
Dec‐13
Mar‐14
Jun‐14
Sep‐14
Dec‐14
Mar‐15
Individual counseling sessions were conducted at City Hall, and other locations, including Table Service. 34
Local Office Phone Calls City Hall Service Center
1st Quarter 2015 1,787
1,752 1,735
• Averages 1,300 calls per month • Asset Allocation • Catch‐Up Enrollments • Distribution Requests • Loan Requests
March 2012 ‐ March 2015 3,500 3,000
• Website Website Assistance with Assistance with Login/PIN, Contribution changes Glendale Office
2,500
• Local office in Glendale averages 400 calls per month
2,000 1,500 1,000 500 ‐ Mar‐12 Jun‐12
Sep‐12 Dec‐12 Mar‐13 Jun‐13
Sep‐13 Dec‐13 Mar‐14 Jun‐14
Sep‐14 Dec‐14 Mar‐15
35
Appendix 36
Asset Distribution Asset Class/Fund Name Profile Portfolios Ultra Aggressive Profile Portfolio Aggresive Profile Portfolio Moderate Profile Portfolio Conservative Profile Portfolio Ultra Conservative Profile Portfolio Profile Portfolios International DWS EAFE Equity Index Fund Fidelity Diversified International Fund International Small Cap Blend SSGA Russell Small Cap Index NL Series S DCP Small Cap Fund Small Cap Blend Mid Cap Blend DCP Mid Cap Fund Mid Cap Blend Large-Cap DCP Large Cap Fund Large-Cap Bond DCP Bond Fund Bond Stable Value Fund Deferred Compensation Stable Value Fund Stable Value Fund Fixed Bank Fund FDIC Insured Savings Option Fixed Bank Fund Self Directed Self-Directed Schwab Self-Directed Self-Directed Grand Total
at 06/30/14 Amount
PCT
Accounts
at 09/30/14 Amount
PCT
Accounts
Amount
at 12/31/14 PCT
Accounts
Amount
at 03/31/15 PCT
Accounts
$82,140,389 $240,610,628 $240 610 628 $256,741,482 $99,050,250 $39,512,805 $718,055,554
1.83% 5 36% 5.36% 5.72% 2.20% 0.88% 16.0%
4,328 9 624 9,624 8,297 3,168 1,238 26,655
$81,271,757 $240,213,144 $240 213 144 $258,950,787 $102,562,520 $40,455,644 $723,453,851
1.81% 5 36% 5.36% 5.78% 2.29% 0.90% 16.2%
4,521 9 806 9,806 8,427 3,231 1,261 27,246
$86,415,376 $251,404,698 $251 404 698 $276,182,234 $107,215,588 $39,066,063 $760,283,958
1.87% 5 44% 5.44% 5.97% 2.32% 0.85% 16.4%
4,636 9 971 9,971 8,550 3,264 1,285 27,706
$92,863,126 $262,320,161 $262 320 161 $288,931,840 $109,739,634 $40,266,535 $794,121,296
1.96% 5 55% 5.55% 6.11% 2.32% 0.85% 16.8%
4,822 10,110 10 110 8,663 3,291 1,310 28,196
$47,948,490 $180,685,414 $228,633,905
1.1% 4.0% 5.1%
3,309 8,956 12,265
$44,445,375 $170,260,927 $214,706,302
1.0% 3.8% 4.8%
3,323 8,911 12,234
$40,873,412 $165,284,391 $206,157,803
0.9% 3.6% 4.5%
3,260 8,811 12,071
$42,663,152 $174,830,600 $217,493,752
0.9% 3.7% 4.6%
3,260 8,732 11,992
$230,234,973 $0
5.1% 0.0%
9,836 0
$206,656,843 $0
4.6% 0.0%
9,793 0
$220,615,358 $0
4.8% 0.0%
9,693 0
$2,821 $225,035,218
0.0% 4.8%
0 9,616
$230,234,973
5.1%
9,836
$206,656,843
4.6%
9,793
$220,615,358
4.8%
9,693
$225,038,039
4.8%
9,616
$185,345,171 $185 345 171 $185,345,171
44.1% 1% 4.1%
66,309 309 6,309
$187,833,654 $187 833 654 $187,833,654
44.2% 2% 4.2%
66,514 514 6,514
$207,307,213 $207 307 213 $207,307,213
44.5% 5% 4.5%
66,729 729 6,729
$230,689,252 $230 689 252 $230,689,252
44.9% 9% 4.9%
77,084 084 7,084
$1,482,953,986 $1,482,953,986
33.0% 33.0%
20,791 $1,494,419,815 20,791 $1,494,419,815
33.4% 33.4%
20,861 $1,565,484,655 20,861 $1,565,484,655
33.9% 33.9%
20,947 $1,578,600,218 20,947 $1,578,600,218
33.4% 33.4%
21,055 21,055
$158,753,008 $158 753 008 $158,753,008
3.5% 3 5% 3.5%
8,176 8 176 8,176
$159,932,558 $159 932 558 $159,932,558
3.6% 3 6% 3.6%
8,122 8 122 8,122
$163,633,515 $163 633 515 $163,633,515
3.5% 3 5% 3.5%
8,100 8 100 8,100
$165,385,247 $165 385 247 $165,385,247
3.5% 3 5% 3.5%
8,071 8 071 8,071
$895,570,759 $895,570,759
19.9% 19.9%
13,096 13,096
$898,372,574 $898,372,574
20.1% 20.1%
13,032 13,032
$899,216,902 $899,216,902
19.5% 19.5%
13,024 13,024
$903,858,339 $903,858,339
19.1% 19.1%
12,979 12,979
$293,991,376 $293,991,376
6.5% 6.5%
9,151 9,151
$293,026,703 $293,026,703
6.5% 6.5%
9,073 9,073
$294,343,201 $294,343,201
6.4% 6.4%
8,998 8,998
$290,958,424 $290,958,424
6.2% 6.2%
9,088 9,088
$298,537,459 $298,537,459 $4,492,076,191
6.6% 6.6% 100.0%
4,674 $299,470,897 4,674 $299,470,897 104,644 $4,477,873,196
6.7% 6.7% 100.0%
4,777 $305,451,017 4,777 $305,451,017 105,138 $4,622,493,622
6.6% 6.6% 100.0%
4,857 $0 4,857 $319,733,292 105,396 $4,725,877,857
0.0% 6.8% 100.0%
5,025 5,025 106,022
37
Net Transfer Detail
Fund Name Contributions , , $3,941,929 gg Profile Portfolio Ultra Aggressive $8,335,932 Aggressive Profile Portfolio $5,545,589 Moderate Profile Portfolio $1,712,964 Conservative Profile Portfolio $577,249 Ultra Conservative Profile Portfolio $3,026,418 Fidelity Diversified International $871,841 DWS EAFE Equity Index $3,938,554 SSGA Russell Small Cap Index NL Series S $28,274 DCP Small Cap Fund $4,445,850 DCP Mid Cap Fund $19,000,767 DCP Large Cap Fund $2,527,591 DCP Bond $4,097,599 FDIC - Insured Savings Account $7,878,842 Deferred Compensation Stable Value $2,221,814 Schwab Self-Directed
Additional Deposit $273,470 , $511,157 $1,905,922 $950,616 $456,864 $25,505 $65,228 $82,182 $606 $298,507 $2,443,660 $276,536 $1,708,925 $21,073,701 $0
Transfers In $21,026,468 , , $13,022,275 $12,963,163 $10,831,915 $8,227,872 $4,401,016 $1,922,008 $15,771,214 $228,922,814 $20,710,816 $24,570,164 $6,393,080 $25,866,035 $45,475,383 $12,411,984
Distributions (($1,132,696) , , ) ($3,722,942) ($4,193,974) ($2,184,795) ($447,660) ($1,825,935) ($362,719) ($1,884,097) ($207,710) ($2,370,156) ($18,291,964) ($2,748,141) ($6,899,001) ($26,125,170) ($88,686)
Transfers Out (($20,691,775) , , ) ($14,556,189) ($10,012,402) ($10,865,105) ($8,126,446) ($6,558,230) ($2,843,961) ($250,122,677) ($2,035,429) ($8,519,446) ($29,248,758) ($6,701,765) ($28,071,210) ($47,746,403) ($6,210,613)
Ending Balance $3,417,397 , , $3,590,233 $6,208,297 $445,596 $687,879 ($931,226) ($347,602) ($232,214,824) $226,708,555 $14,565,571 ($1,526,131) ($252,700) ($3,297,652) $556,353 $8,334,499
Net Transfers $334,693 , ($1,533,913) $2,950,761 ($33,190) $101,426 ($2,157,213) ($921,953) ($234,351,463) $226,887,385 $12,191,370 ($4,678,594) ($308,685) ($2,205,174) ($2,271,020) $6,201,371
38
Net Cash Flow Detail
Contributions
Additional Deposit
Transfers In
Distributions
Transfers Out
Net Cash Flow
Ult A Ultra Aggressive i P Profile fil Portfolio P tf li
$3 941 929 $3,941,929
$273 470 $273,470
$21 026 468 $21,026,468
($1 132 696) ($1,132,696)
($20 691 775) ($20,691,775)
$3 417 397 $3,417,397
$334 693 $334,693
Aggressive Profile Portfolio
$8,335,932
$511,157
$13,022,275
($3,722,942)
($14,556,189)
$3,590,233
($1,533,913)
Moderate Profile Portfolio
$5,545,589
$1,905,922
$12,963,163
($4,193,974)
($10,012,402)
$6,208,297
$2,950,761
Conservative Profile Portfolio
$1,712,964
$950,616
$10,831,915
($2,184,795)
($10,865,105)
$445,596
($33,190)
$577,249
$456,864
$8,227,872
($447,660)
($8,126,446)
$687,879
$101,426
$3,026,418
$25,505
$4,401,016
($1,825,935)
($6,558,230)
($931,226)
($2,157,213)
$871,841
$65,228
$1,922,008
($362,719)
($2,843,961)
($347,602)
($921,953)
$3,938,554
$82,182
$15,771,214
($1,884,097)
($250,122,677)
($232,214,824)
($234,351,463) $226,887,385
Fund
Ultra Conservative Profile Portfolio Fidelity Diversified International DWS EAFE Equity Index SSGA Russell Small Cap Index NL Series S DCP Small Cap Fund DCP Mid Cap Fund DCP Large Cap Fund
Net Transfers
$28,274
$606
$228,922,814
($207,710)
($2,035,429)
$226,708,555
$4,445,850
$298,507
$20,710,816
($2,370,156)
($8,519,446)
$14,565,571
$12,191,370
$19,000,767
$2,443,660
$24,570,164
($18,291,964)
($29,248,758)
($1,526,131)
($4,678,594)
DCP Bond Fund
$2,527,591
$276,536
$6,393,080
($2,748,141)
($6,701,765)
($252,700)
($308,685)
FDIC - Insured Savings Account
$4,097,599
$1,708,925
$25,866,035
($6,899,001)
($28,071,210)
($3,297,652)
($2,205,174)
Deferred Compensation Stable Value
$7,878,842
$21,073,701
$45,475,383
($26,125,170)
($47,746,403)
$556,353
($2,271,020)
Schwab Self-Directed
$2,221,814
$0
$12,411,984
($88,686)
($6,210,613)
$8,334,499
$6,201,371
39
Loan Details LOANS INITIATED Year 2011 2012 2013 2014 2015
JAN 387 395 524 427 393
FEB 415 386 443 444 420
MAR 501 495 476 506 547
APR 438 501 612 550
MAY 510 496 593 561
JUN 508 488 560 595
JUL 484 549 652 514
AUG 557 575 620 541
SEP 459 520 546 544
OCT 465 516 579 581
NOV 484 572 504 463
DEC TOTAL YTD 487 5,695 501 5,994 555 6,664 497 6,223 1,360
PARTICIPANTS WITH ONE OUTSTANDING LOAN Year JAN 2011 9,783 2012 10,832 2013 11 952 11,952 2014 12,631 2015 12,953
FEB 9,885 11,839 11 732 11,732 12,696 12,964
MAR 9,957 11,709 11 757 11,757 12,826 13,429
APR 9,871 11,169 12 020 12,020 12,820
MAY 9,697 11,171 11 727 11,727 12,798
JUN 10,027 11,283 12 241 12,241 12,651
JUL 10,197 11,246 12 730 12,730 12,619
AUG 10,298 11,351 12 589 12,589 12,646
SEP 10,372 11,454 12 231 12,231 12,730
OCT 10,291 11,558 12 453 12,453 12,939
NOV 10,236 11,732 12 272 12,272 12,739
DEC 10,407 11,825 12 440 12,440 12,762
PARTICIPANTS WITH MORE THAN ONE OUTSTANDING LOAN Year JAN FEB 2011 4,020 4,116 2012 5,116 4,980 2013 6,236 6,991 2014 6,340 6,752 2015 6,454 6,408
MAR 4,193 5,264 6,251 6,721 6,954
APR 4,326 5,276 6,043 6,231
MAY 4,378 5,394 6,358 6,354
JUN 4,506 5,372 6,407 6,674
JUL 4,706 5,477 6,120 6,691
AUG 4,914 5,587 6,427 6,738
SEP 4,973 5,668 6,448 6,734
OCT 5,249 5,701 6,732 7,435
NOV 5,360 6,092 6,888 7,671
DEC 5,438 6,127 6,888 7,717
TOTAL OUTSTANDING LOANS Year 2011 2012 2013 2014 2015
JAN 13,803 15 948 15,948 18,188 18,971 19,407
FEB 14,001 16 819 16,819 18,723 19,448 19,372
MAR 14,150 16 973 16,973 18,008 19,547 20,383
APR 14,197 16 445 16,445 18,063 19,051
MAY 14,075 16 565 16,565 18,085 19,152
JUN 14,533 16 655 16,655 18,648 19,325
JUL 14,903 16 723 16,723 18,850 19,310
AUG 15,212 16 938 16,938 19,016 19,384
SEP 15,345 17 122 17,122 18,679 19,464
OCT 15,540 17 259 17,259 19,185 20,374
NOV 15,596 17 824 17,824 19,160 20,410
DEC 15,845 17 952 17,952 19,328 20,479
LOANS IN DEFAULTED STATUS Year 2011 2012 2013 2014 2015
JAN 596 690 842 866 958
FEB 586 751 773 847 940
MAR 639 732 765 951 1,011
APR 620 719 798 934
MAY 615 709 771 888
JUN 639 752 842 930
JUL 630 736 807 895
AUG 618 718 797 875
SEP 664 806 850 953
OCT 664 806 824 922
NOV 744 783 805 907
DEC 731 813 886 983
40
The End Director Lisa Tilley Cast J Joan W Watkins ki La Tanya Harris Producer Monise Lane 41