140
Pseudo - Graphic Typeface: Design and Evaluation Oleg Spakov
Tatiana Evreinova
Grigori Evreinov
TAUCHI Computer-Human Interaction Unit Department of Computer and Information Sciences FIN-33014 Tampere, Finland {oleg, e_tg, grse}@cs.uta.fi Abstract The lack of access to verbal communication with non-deaf individuals is a major problem for the profoundly deaf people. The goal of our work was to develop communication techniques through graphical imaging of textual information for the profoundly deaf and hard-of-hearing people. Our empirical research was focused on an exploration the visibility of proposed pseudo-graphic typeface in comparison with five conventional phonetic typefaces. The results show that Impact and Styled typefaces were perceived easier and seemed to be rather legible than Courier, Arial, Comic and Times New Roman. The tachistocopic analysis of the amount of recognized token (target stimulus) among distractors showed that subjects had fewer recognition difficulties for Arial and Times New Roman typefaces. For font attractiveness, Comic was perceived as being more attractive than Arial and Courier, while Styled and Impact were perceived as more attractive than Times New Roman. Of the fonts studied, Impact and Styled, being the most preferred, could be perceived fairly preattentively. We suppose that the proposed Styled typeface may have wider applications such as public display systems for dynamic imaging of current financial events in stock exchanges or present environments with different constraints.
1 Introduction The lack of access to verbal communication with non-deaf individuals is a major problem for the profoundly deaf people. The hearing impaired has no way to access phonetic languages and vice versa the non-deaf individuals have difficulties to understand the specific languages of disabled people. As a rule, they are deprived of possibilities to listen speech including radio and television programs, to communicate on the phone without special adaptation of the unit (Evreinova & Raisamo, 2002). There is a range of communication methods open to these people. Some can manage lip-reading, some sign language, Blissymbolics or other reading codes and some can manage to use the telephone if it is amplified or accompanied with an inductive coupler to a hearing aid. However, not all existing systems for such a people are so fortunate. Lip-reading requires a great concentration of visual attention and can be very stressful. Some of phonemes are indistinguishable and unpredictable words are not properly understood. This makes the task of decoding mouth movements extremely difficult (Kilborn, 1993). Thus, for the majority of profoundly deaf people lip-reading is quite impossible. The small number of people, who uses such a method, mainly succeeds by relying on guesswork. Hands visibility still remains one of the most problematic aspects at using of the sign language, especially for those people who have grammatical disorders and aphasia. The issue of qualified sign language interpreters has been always
141
crucial for the deaf community. Some of deaf individuals are not aware of the amount of information, which many interpreters filter out, because they cannot interpret everything in group situations, for instance: cross-talk, in which people interrupt each other and/or talk over each other and specialized terms, for which no signs exist yet in Sign Language [Kilborn, 1993; Luyken, 1991]. Thus, the interpreter has to spend time finger spelling them and/or explain using longer sequence of signs. Some of interpreters totally ignore this kind of information. Furthermore, an amount of students with hearing impairments in the majority of universities essentially exceeds a number of interpreters and causes additional difficulties for teaching (Zak, 1998). Still the usage of subtitling signing for profoundly deaf people remains as an inefficient and extremely expensive method of information imaging (it costs on average 400 dollars per hour to subtitle a TV programs). Feedback from these people indicates that there is a high level of transmission difficulties, including missing words, spelling errors, breakdowns and reliability problems across all types of programs. Moreover, they read and assimilate information at different speeds and there are particular problems in relation to children because of both their age and connected reading proficiency and degree of deafness (Mercinelli). Thus, hard-of-hearing people require unifying the knowledge between the phonetic and sign language through combining visual and strengthen linguistic feedback that accompanies spoken language comprehension. The goal of our work is to develop communication techniques through graphical imaging of textual information for the profoundly deaf and hard-ofhearing people. The display should require minimum resources of the visual perception and the use of specific pseudo-graphic symbols may reduce a cognitive load if they can be perceived preattentively. With the introduction of legal obligation to provide subtitling signing for deaf viewers within digital television environment, there have been made many suggestions concerning of the improvement of signing-specific aspects such as hands visibility and the visibility of the oral components of signs. However, the preferred method of achieving high visibility of subtitling signing is expensive in terms of the cost of skilled signers and the duplication of television channels (Luyken, 1991). Therefore an essential amount of research is being done on less expensive methods which could be acceptable to the deaf viewers. Another well-known method to provide a language transfer created by television program to the deaf viewers is so-called close captioning (textual subtitling without signing) or the written translation of the spoken language (source language) of a television program or film into the language of the viewing audience (the target language) (U.S. House of Representatives, 1990). Nevertheless, there are many contradictions such as technical and usability problems regarding of implementing typeface design for close captioning. On the one side, the space available for subtitles is up to 30% of the screen height to present the best balance. The text is displayed at less than 140 words per minute, which can mean that the dialogue is essentially shortened (Zak, 1998). That is,
142
reducing dialogue significantly aggravates both phonological awareness and logical clarity of a language transfer. On the other side, the problem of displaying typefaces in specific format, which should be available to deaf viewers, has to be considered too. For instance, one of the common approaches is to add black borders. This does not affect the subtitling typeface but increases information readability. Another approach is to stretch the picture; this might involve stretching the subtitling typeface, which would enlarge legibility (Zak, 1998). The important factor such a typeface visibility has to be taken into account. Good visibility of typeface is especially important both for people with reduced vision and for ordinary users in unfavorable light conditions (Luyken, 1991). This feature was rarely considered as typefaces are developed. Every token must be acceptable, recognizable and distinguishable. Such tokens need to have as smooth shape as it is possible. On the other hand, displayed data must be coded as economically as possible that is not to use more information elements than it is strictly necessary. However, if digital interface includes graphical objects then readability problems begin to arise. Reading dynamically displayed text is a rather different task from recognizing symbols only. The latter task neither does have the benefit of contextual information nor it does require intellectual processing (Kilborn, 1993). To facilitate an apparent difficulty in recognition and perception of the tokens we see a need in adaptation of existing typeface to something rather more appropriate. The characters other than English nevertheless supporting by phonetic awareness and similar to conventional syllabic tokens should be included.
2 Design and Implementation While many authors recognize that legibility of typeface plays an important role during of the language transfer process, the important factor as visual processing of textual information imaging still remains beyond designing. Some time ago Grigori Evreinov had created a pseudo-graphic typeface called as Styled. The goal was to essentially simplify visual perception of the typeface and to strengthen legibility. The Styled typeface includes 26 pseudo-graphic tokens that are very similar to standard typeface and could be perceived relying on previous user experience. Visual perception critically depends on orientation and directions that arise early in visual processing. Behavioral measurements reveal that the human visual system is more sensitive to horizontal and vertical orientations inside of visual stimuli (Furmanski & Engel Stephen, 2000). Some research found the striking correlation between neural activity and behavior, which demonstrates that during of visual processing of the exposed stimuli humans also can easily perceive another oblique directions (Watanabe & Sazaki, 2001). That is why to facilitate associative interpretation new tokens were mapped to eight directions: -135°, -
143
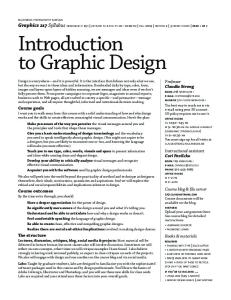
90°, -45°, 0°, 45°, 90°, 135°and 180°, from the exposed coherent direction, where positive and negative values represent clockwise and anticlockwise rotations. A variant of the Styled typeface is shown in Figure 1. While there are many studies comparing readability of on-line and printed typefaces, there is no objective research on typefaces visibility, which are currently used for close captioning and are available in an array of various styles. In the present study specific methods for visibility evaluation of dynamically displayed graphic tokens are introduced. An attempt is also made to evaluate which of tested typefaces is the easiest to perceive during imaging textual information. Before the test it was supposed that pseudo-graphic typeface would be easier to perceive preattentively than other ones, as there is a similarity to habitual syllabic tokens and simplified form of visual stimuli. In addition, it was supposed that at a shorter exposition time the recognition of proposed typeface would be better than of traditionally used typefaces.
Figure 1: Styled typeface for the deaf and hard-of-hearing people.
144
3 Experimental evaluation 3.1 Participants 20 volunteers (13 males and 7 females) from staff and students at the University of Tampere participated in the study. The ages of the subjects ranged from 22 to 50 years with a mean age of 32. All had a normal color sight but different visual and hearing acuity. Seventy-three percent wore prescription glasses. None used hearing aid. The average computer experience of all participants was 8.2 years. All used computers on a daily basis, reporting 7 to 12 hours of usage per day. Ninety-five percent of the participants reported to have regularly read documents on computer screens, at least, a few times per week. 3.2 Apparatus The experiments have taken place in the usability laboratory of Tampere Unit for Computer-Human Interaction (TAUCHI). Our testing was mostly based on the using of eye-tracking technology. Since eye tracking is tedious, we precisely planned experimental procedure before to start it. That is, we aimed to reduce testing time as much as possible to avoid subject over fatigue. We used the SMI EyeLink tracking system to measure subjects’ eye movements, fixations and scanpaths. SMI EyeLink system consists of headbandmounted camera assembly. Two custom-built ultra-miniature high-speed cameras provide binocular eye tracking. A third camera tracks 4 IR markers mounted on the visual stimulus display (Subject PC) for head motion compensation and true gaze position tracking. A processing system (EyeLink Operator PC) analyzes synchronously the images from all 3 cameras in real time at 250 Hz sampling rate to determine pupil position of both eyes and marker position. An Ethernet link connects the eye-tracking computer to an experimental-display computer, with support for real-time data transfer and control (EyeLink Gaze Tracking Project). The tracking system operates with a very small delay of typically less than 12 ms between the eye motion and the time when data is available on the Subject PC. Some time before this exploration Oleg Spakov wrote iComponent software, which provides a possibility to use SMI EyeLink data for other applications through a simple interface. The experimental software Font Reader was also written by Spakov in C++. Adjustments were made to maintain the subjects’ eyes at approximately 45 cm from the 17-inch monitor. Each eye-tracking experiment was started with the calibration procedure according to the requirements of SMI EyeLink system. A spot was presented sequentially and randomly at nine different positions on the monitor screen of the Subject PC. The subject was asked to fix the gaze on the spots which appear on the screen. During an experiment, the subject was wearing the headset of the eye tracker as shown in Figure 2. The stimuli were shown through the Subject monitor and the subject’s current gaze position was indicated by two moving cursors (left and
145
right eye cursors) on the Operator PC monitor as the experiment is running. The recording of eye movements was carried out when external lightening was switched off to minimize influence of visual distracters. The standard iView 3.01 package provides interactive analysis functions for image-based stimuli. Recorded data and results are available for further post processing.
Figure 2: Experimental setup (Subject PC) during the testing. 3.3 Motivation and materials 3.3.1 Motivation Our empirical research was focused on an exploration the visibility of proposed pseudo-graphic typeface in comparison with conventional phonetic typefaces. The goal of this study was not to determine whether the designed typeface is better than those used habitually, but rather to define perceptive differences between the explored typeface and others, currently used. 3.3.2 Materials The following typefaces have been compared throughout three experiments: Selected typefaces
Motivation to select the typeface
Comic
The most commonly used sans serif font (Bernard, 2001; Boyardski, 1998; Brookes) The mimic print facilitates syllabic tokens perception (Bernard, 2001)
Courier
The most commonly used mono-spaced font (Brookes)
Arial
Impact Times New
Easy to perceive on screen, a large x-height factor (Boyardski, 1998) High legibility with economy of screen space (Boyardski, 1998) 8-directional simplified layout
146
3.4 Experiment 1: Tracking of eye movements 3.4.1 Procedure The subjects were shown samples of six typefaces in order of their appearance in the experiment. They were told that six consecutive passages taken of five phonetic typefaces and one of explored pseudo-graphic typeface would appear. One passage consisted of 10 visual stimuli, the stimulus exposed during the seven seconds. The order, in which visual stimuli were presented inside six passages, was randomized for each subject. The subjects were asked to gaze at visual stimuli and try to notice specific features they include. Presentation of a passage was started with pressing the button in experimental software. The whole experiment took 10 minutes in average. Both background and visual stimuli had a gray color. A stimulus-background brightness relation was 0.02. This condition was used to remove edge effects of involuntary gaze captioning. 3.4.2 Results In this study about 1200 records (10 tokens per one passage, 1passages per tested typeface, 6 typefaces, 20 subjects) were gathered with SMI EyeLink system. An example of fixations and scan paths recorded by SMI iView 3.01 program for token “A” is shown in Figure 3. The number of visual fixations was analyzed for each of typefaces. Our experiments demonstrated that Styled typeface has a lower number of visual fixations (14) than other typefaces (17-21). An amount of areas of visual interest (AVI) was the next parameter used for a comparison of explored typefaces. AVI are defined as the areas where the most densely packed points of visual fixation are grouped. Before testing it was supposed that the novel typeface would evoke arousal reaction and strengthen visual interest than other ones. The results demonstrated that a higher number of AVI was observed for phonetic typefaces (5-7) than on Styled – only 4 (Figure 5). When asking subjects which of exposed typefaces could be preferred as easiest to perceive, they mostly selected Times New Roman, Arial and Comic. Subjects reported that the Times New Roman and Arial typefaces are “easiest to perceive” and “the most habitual”, while those who selected Comic typeface commented that this typeface is “amusing” and “very interesting to gaze” (quoted from the subjects’ comments). 73% of subjects identified Impact as “worst”. 85% of subjects hesitated over the choice of the “best” typeface. The subject who disliked Impact typeface gave “thickest” as the reason. Although, subjects somehow characterized each of the phonetic typefaces, they were quite suspiciously related to the pseudo-graphic typeface. The overall impression regarding to this typeface was similarity of pseudo-graphic tokens (e.g., A, C, I, X, Y and Z) to syllabic tokens.
147
Figure 3: Areas of visual interest (AVI) recorded by SMI iView 3.01 program for the token “A”. AVI have been grouped automatically, thick black circles show groups. A coefficient of difference (Kd) between an amount of AVI distributed across the alphabet in Styled typeface (St), in relation to an amount of AVI distributed across the alphabet in phonetic typefaces (Ph), was estimated as follows:
Kd =
St − Ph × 100% Ph
148
That is, an amount of AVI for pseudo-graphic tokens, which were orthographically similar to the habitual syllabic ones, was essentially lower than an amount of AVI for conventional syllabic tokens (see Figure 4).
Figure 4: AVI distributed across the Styled typeface in relation to AVI of phonetic typefaces The coefficient of difference (Kd) is shown along Y-axis.
6 5 4 3 2 1 0 Arial
Comic
Courier
Impact
Styled
Times New
Figure 5: The average value of AVI (Y-axis) during an exposition of visual stimuli (X-axis). With these results in mind, it was hypothesized that Styled typeface has to be significantly easily perceived than phonetic typefaces, since both the less amount of visual fixations and a lower number of AVI were recorded. However, we would not just make any final decision concerning exceptional advantages of the Styled typeface.
149
3.5 Experiment 2: Visual scan time measurement 3.5.1 Subjective evaluation 3.5.1.1 Procedure The procedure was the same as in the first experiment but a passage consisted of 26 visual stimuli (alphabet). When the subject has completed a viewing on his own judgment (subjective decision making) he pressed down a space key. The session took 10 minutes in average. 3.5.1.2 Results We have no found any statistically significant differences between the number of fixations for phonetic typefaces and pseudo-graphic typeface regarding to our previous experiment. Such a result was fully expected since a viewing of exposed visual stimuli was controlled more by the subject than by the interface. However, when we examined the visual scan time of selected typefaces, we found the differences. While our subjects described the Times New Roman as “easiest to perceive” and “the most habitual” typeface during the first experiment, the viewing time for Times New Roman typeface required more time to be perceived and was about 1755 ms. The pattern of results (Figure 6) suggests that there is a small advantage in the visual scan time of Impact (1434 ms) and Styled (1523 ms) typefaces over viewing of Arial, Comic and Courier typefaces (1529, 1635 and 1698 ms correspondingly). Probably that the serifs typefaces require greater visual scan time due to their smoothing effects which tend to strengthen depending on lowering stimulus-background contrast. It aggravates visual perception of these typefaces. We did learn that at the beginning of our testing the participants stated they had Times New Roman as their default typeface but chose Impact as the most legible and visible typeface after this study. 2500
2000
1500
1000
500 Arial
Comic
Courier
Impact
Styled
Times New
Figure 6: Visual scan time and standard deviation (vertical lines) of visual stimuli exposition in self-control mode.
150
Thus, such a factor as a stimulus-background brightness relation can crucially affect both visual perception of typeface and the subjects preferences. Moreover, we noticed that the serif typefaces as well as pseudo-graphic typeface seemed to be rather legible in this case than sans-serifs ones. 3.5.2 Objective evaluation 3.5.2.1 Procedure The subjects also were wearing the headset of the eye tracker. Six consecutive passages composed of five phonetics typefaces and pseudo-graphic typeface. One passage consisted of 5 visual stimuli. Visual stimuli were exposed in the same order (non-randomized) for each subject. The subjects were asked to gaze at exposed stimuli and try to notice their specific features. The session took 10 minutes in average. In this case, background had a gray color and visual stimuli had a black color. A stimulus-background brightness relation was -0.8. 3.5.2.2 Results Overall examining the subjects’ AVI for five tokens (A, D, F, J, U) showed that the tokens taken from Styled typeface were considered to be the most legible (the average value of AVI was 2.8). The average values of AVI for phonetic typefaces were: 3.7 - Times New Roman, 3.8 - Arial, 3.84 - Courier. However, a significant difference was observed in perception of tokens taken from Comic (the average value of AVI = 3.98) and Impact typefaces (the average value of AVI = 4.66), see Figure 7. The tokens U and J were defined as the most easily perceived throughout all the testing typefaces. The average value of AVI was about 2.45 for U and 3.2 for J. The tokens F, A and D were defined as the most hardly perceived tokens in Styled typeface. The average value of AVI was about 4.27 (F), 4.6 (A) and 4.2 (D). The majority of subjects indicated that perception difficulties of such symbols were due to its disparateness to habitual syllabic tokens selected from phonetic typefaces. 6 5
Styled Arial Comic
Times New Courier Impact
4 3 2 1 0 U
J
F
A
D
151
Figure 7: The average value of AVI (Y-axis) recorded by SMI iView 3.01 program for five tokens. 3.6 Experiment 3: Tachistoscopic evaluation of the tokens 3.6.1 Procedure Tachistocopic presentation of visual stimuli means that the stimuli should be exposed in the same place for extremely short periods of time using limits of unconscious visual perception to define how easily or hard the presented stimuli might be preattentively perceived by subject. At the beginning of the experiment, subjects were told to fix the gaze on a spot located in the center of the screen to avoid additional errors due to an incorrect gaze position. During the session, the task of subject consisted in remembering of the first token (target stimulus) and accounting of an amount of this token appearing within presented sequence. Characters that are orthographically similar to the target token were served as distracters, for instance, if the token “A” was served as target stimulus then the token “M” was used as distracter for the token “A”. All sequences were composed equally of ten target stimuli and ten distractors. An exposition time for each token was 20 ms throughout the testing. Previous studies have shown that this duration is above the visual perception threshold [15]. However, interstimulus interval had been changed and was the following: 150, 300 and 600 ms. The test block included 3 trials for each exposition time, for a total 54 trials per subject, 9 trials per typeface. The session took 10 minutes in average. 3.6.2 Results The tachistoscopic analysis of the amount of recognized target stimulus among distractors obtained under the investigation of pairs was carried out at three interstimulus intervals. The results of the recognition of target stimulus “A” are presented in Figure 8. As it was expected, a probability of error depends on orthographic similarity of target stimulus to distracter and of the interstimulus interval. The recognition of token is decreased in proportion to growing orthographic similarity of target stimulus to distracter and an error rate increased also.
152
Interstimulus interval 600 ms
30%
Interstimulus interval 300 ms Interstimulus interval 150 ms 20%
10%
0% Arial
Comic
Courier
Impact
Styled
Times
Figure 8: Recognition sample of target stimulus "A" at three interstimulus intervals. The error rate of tokens recognition is shown along Y-axis. The results of the recognition of target stimulus “A” are presented in Figure 11. As it was expected, a probability of error depends on orthographic similarity of target stimulus to distracter and of the interstimulus interval. The recognition of token is decreased in proportion to growing orthographic similarity of target stimulus to distracter and an error rate increased also. At the interstimulus interval of 600 ms an error rate was about 3% for all typefaces. When lowering the interstimulus interval to 300 ms an error rate has grown up to 8%. At the interstimulus interval of 150 ms the amount of counted target stimuli became even more than they were presented within tested passage (an error rate was about 17%). The higher error rate for small interval was likely due to insufficient adaptation of subject to the first exposed token. Subjects indicated that they had fewer recognition difficulties with Arial, Impact and Times New Roman typefaces. The full analysis of recognition of all the test sequences showed that an average value of recognized target stimulus among distractors was 62.27%. The better interstimulus time was 600 ms; overall error rate was 2.97%. In general, the recognition of target stimuli (typefaces) depends on individual features of the person, such as the latent period of visual perception, concentration of attention on the task (tokens counting) rather than on the exposed target stimulus, or simply fatigue.
4 Overall Discussion This study was focused on an exploration the visibility of proposed pseudographic typeface in comparison with conventional phonetic typefaces. Several observations can be made regarding the examined typefaces. First of all, no significant differences were found in the number of fixations and visual scan time when subjects gazed at exposed stimuli. However, distinct differences were detected in the amount of AVI and subjective preferences of typefaces. Impact and Styled typefaces were perceived easier and seemed to be rather legible than Courier, Arial, Comic and Times New Roman. The tachistoscopic analysis of the amount of recognized token (target stimulus) among
153
distractors showed that subjects had fewer recognition difficulties with target stimulus among distractors for Arial and Times New Roman typefaces. For font attractiveness, Comic was perceived as being more attractive than Arial and Courier, while Styled and Impact were perceived as more attractive than Times New Roman. Of the fonts studied, Impact and Styled appear to be the more visible. Besides, being the most preferred they could be perceived fairly preattentively. There have been several criticisms. One of the subjects reported that it is very hard to perceive preattentively the changing pseudo-graphic tokens when they were dynamically displayed in the same place. Another subject felt that it would be “irritating to perceive such simplified graphic tokens instead of habitual conventional letters”. Therefore the typeface might be essentially improved in the light of experience and further constructive criticism. Probably, it would be a great step in further development of Styled typeface if the most linguistically oriented framework could be build up to identify specific orthographic features that contribute to visual perception differences we observed. We suppose that the proposed Styled typeface may have wider applications than use for subtitling only; for example, public display systems for dynamic imaging of current financial events in stock exchanges or present environments with different constraints.
5 Acknowledgements We wish to thank every volunteer test subject at TAUCHI group for making our testing possible. A thanks is also extended to the students in the Grigori Evreinov’s course “New Interaction Techniques” for participating in the experiment.
6 References Bernard, M., Mills, M., Frank, T., McKown J. (2001). Which font do children prefer to read online? Usability News 3.1. http://psychology.wichita.edu/surl/usabilitynews/3W/fontJR.htm Boyardski, D., Neuwirth, C., Forlizzi, J., Regli, (1998). A study of fonts designed for screen display. In proceedings of CHI’ 98, (April 18-23, Los Angeles), 87-94. Brookes A. A guide to teaching and supporting students with disabilities. http://www.aston.ac.uk/staffdev/public/tssd.doc. Evreinova, T., Raisamo, R. Multimodal communication system for the people who are deaf or have low vision. Proceedings of the HANDICAP2002 2ème Conférence pour l'essor des technologies d'assistance. Paris - Porte de Versailles, June 2002, 137-143 EyeLink Gaze Tracking. Project information available at http://www.smi.de Furmanski C. S., Engel Stephen A. An oblique effect in human primary visual cortex. Nature Neuroscience 3 (2000), 535 – 536. http://www.nature.com/ Kilborn, R. Speak my Language: Current Attitudes to Television Subtitling and Dubbing. Media, Culture and Society (London), 1993. Luyken, G. M. Overcoming Language Barriers in Television: Dubbing and Subtitling for the European Audience. Manchester: The European Institute for the Media, 1991.
154
Mercinelli M. Guidelines-Accessibility requirements for new telecommunication equipment. http://www.stakes.fi/cost219/smartphones.htm Mills, C. B. & Weldon, L. J. (1987). Reading text from computer screens. ACM Computing Surveys, 19(4), 329-358. Quality of Sign Language Interpreters by Omer Zak in 1998. http://www.zak.co.il/deafinfo/old/interp_quality.html Television Closed Captioning. On H.R. 4267. U.S. House of Representatives, One Hundred First Congress, Second Session, May 1990. Watanabe T., Nanez J. E., Sasaki Y. Perceptual learning without perception. Nature Neuroscience 413 (2001), 844 - 848. http://www.nature.com/ Watt, R.J. and D.P. Andrews "APE: Adaptive Probit Estimates of Psychometric Functions," Curr. Psychol. Rev. 1 (1981): 205-214.