The Visual Computer manuscript No. (will be inserted by the editor)
Luiz Velho · Jonas Sossai Jr.
Projective Texture Atlas Construction for 3D Photography
Abstract The use of attribute maps for 3D surfaces is an important issue in Geometric Modeling, Visualization and Simulation. Attribute maps describe various properties of a surface that are necessary in applications. In the case of visual properties, such as color, they are also called texture maps.
1 Introduction
In the quest of reconstruction of high-quality 3D models, we have to give attention to both surface shape and reflectance attributes. Most high-end 3D scanners sample the surface shape at a high resolution. For this reason the difference beUsually, the attribute representation exploits a parametriza- tween a good and a bad reconstruction is how the surface retion g : U ⊂ R2 → R3 of a surface in order to establish a flectance attributes, such as color, normal, illumination, etc, two-dimensional domain where attributes are defined. How- are captured and applied to the model. Assuming that we have a 3D model of an object and a ever, it is not possible, in general, to find a global parametrization without introducing distortions into the mapping. For number of photographs of it (with known camera paramethis reason, an atlas structure is often employed. The atlas is ters), there are some aspects that have to (or could) be cona set of charts defined by a piecewise parametrization of a sidered when constructing a textured model from the acsurface, which allows local mappings with small distortion. quired images: Texture atlas generation can be naturally posed as an op- 1. How to create a correspondence between regions of the 3D mesh and sections of the input images in order to timization problem where the goal is to minimize both the reduce the texture distortion inherent in the image-tonumber of charts and the distortion of each mapping. Addisurface mapping? tionally, specific applications can impose other restrictions, such as the type of mapping. An example is 3D photography, 2. With these correspondences defined, how to use the frequency content of each image in order to create a spacewhere the texture comes from images of the object captured optimized texture? by a camera [4]. Consequently, the underlying parametriza3. how to reduce the color discontinuity between image tion is a projective mapping. sections that maps on adjacent regions of the surface, In this work, we investigate the problem of building and caused by different illumination conditions when capturmanipulating texture atlases for 3D photography applicaing the images? tions. We adopt a variational approach to construct an atThe third question could be solved using the information las structure with the desired properties. For this purpose, we have extended the method of Cohen-Steiner et al. [6] to of the texel color-difference between neighboring charts to handle the texture mapping set-up by minimizing distortion smooth the color variation in the texture. The first two queserror when creating local charts. We also introduce a new tions demand a structure that would make possible to cremetric tailored to projective maps that is suited to 3D pho- ate a correspondence (or mapping) between the 2D image sections and 3D surface regions, and the answer is texture tography. mapping. This technique is based on mapping an image (either synthesized or digitized) onto a given surface, which requires a parametrization g : U ⊂ R2 → R3 of it. A Luiz Velho parametrization is obtained easily when the surface is deIMPA - Instituto de Matematica Pura e Aplicada fined parametrically, which is not the case of the most 3D Rio de Janeiro, Brazil E-mail:
[email protected] meshes. And even if we got this global parametrization, it will probably introduces distortions into the mapping. Jonas Sossai Jr. IMPA - Instituto de Matematica Pura e Aplicada A solution to this problem is to use an atlas structure, E-mail:
[email protected] a set of charts defined by a piecewise parametrization, such
2
that each chart is associated to a region of an input image through a parametrization that is a projective mapping. The use of a atlases was explored in several areas: 3D photography [4], surface representation [16], painting [5], etc. Due to the flexibility of using the atlas framework, we could give attention to several aspects when constructing texture atlases from a set of images. In our case, we are interested in minimizing the number of charts, the mapping distortion and the texture map space (based on frequency analysis). Since these three problems are examples of optimization, we adopt a variational approach [6] when creating the charts, in order to obtain a partition that minimizes the aspects cited above, differently from other approaches [4, 5, 11, 16], which constructs texture atlases in a greedy fashion. This variational scheme also help us to created texture atlases to be used by a intelligent and powerful painting system, which allows the user to manipulate such as atlases. Contributions. We propose a new method for generating texture atlases from a set of photographs, based on a variational surface partition scheme. The variational approach allow us to pose texture atlas construction as an optimization problem, such that several aspects can be taken in consideration when defining the charts of the atlas. In particular, we explore two aspects in the process: construct local charts with small distortion and similar texture detail content. From these aspects we define a distortion-based and a frequencybased metric, and develop a surface partitioning algorithm that seeks a partition that minimizes them. In addition, we develop a new diffusion method to eliminate the color discontinuity between adjacent charts due to non-uniform illumination conditions of the photographs.
Luiz Velho, Jonas Sossai Jr.
Our method follows the main steps of the process of generating texture atlases, with some modifications: Surface Partitioning. In this step we partition our input surface into a set of charts. As we said before, we pose the surface partitioning process as an optimization problem, in the way that our partitioning algorithm looks for a partition that minimizes the number of charts, the atlas mapping distortion (through a distortion-based metric that takes into consideration the projective mapping of each camera) and the texture map space (based on a frequency-based metric which uses the frequency content of the image regions associated to each chart). This step will be detailed in Section 3 and Section 4. Parameterization, Discretization and Packing. Since we are constructing a texture atlas from a set of images, the underlying parametrization of each chart is the projective mapping of the camera associated to that chart. Once the model is decomposed into a set of parameterized charts, we can go further to the step of packing them. We simplify this problem by approximating each chart with the least-area rectangle that encloses it. We describe the parametrization and discretization process in Section 3.3, and in Section 4.3 we present our method to pack the charts in texture space. Texture Color Smoothing. Due to different illumination conditions when capturing the images of the object, adjacent charts that are mapped to regions from different input images could present intense color discontinuity. In Section 5 we propose a new blending method based on the diffusion equation and multigrid computing, which diffuses the color difference between the frontier zone between adjacent charts.
2 Overview In this section we present our variational texture atlas approach for texture reconstruction. Assuming that we have a 3D model (more specifically, a triangle mesh) of an object and a number of photographs of it (with known camera parameters), we want to reconstruct a texture for this model with the following requirements:
3 Distortion-Based Atlas Generation
In seeking for a good texture atlas, the primary objective is to minimize distortion, such that large texture distances are not mapped onto small surface distances. A strategy is to define an energy functional for the mapping, and to try to minimize it. In our case, we adopt the atlas mapping distortion as this – reduced distortion in the image-to-surface mapping, energy functional, and a heuristic in order to not produce too – space-optimized texture map based on the frequency anal- many charts. This functional is calculated from a distortionysis of the photographs, based metric, a variation of the L2,1 [6], which allow us to – reduced color discontinuity between image sections that ”score” a partition in terms of mapping distortion. Given a maps on adjacent regions of the surface. chart Ci and its associated camera ci , with normal ni , the To achieve this requirements we develop a variational distortion metric D is then: method to construct a texture atlas, such that each chart of ZZ the atlas is associated to a region of an input image through a 2 (1) parametrization that is a projective mapping, and a diffusion D(Ci , ci ) = x∈C kn(x) + ni k dx i algorithm that uses the color and illumination difference between images assigned to adjacent charts to create smooth Section 3.1 explains how the visibility of the model is transitions between them. The variational method aims to determined. In Section 3.2 we describe our variational apoptimize the surface partitioning problem with respect to a proach to construct an atlas structure for this problem. Fidistortion-based and a frequency-based metric. nally, in Section 3.3 we detail how the atlas is parametrized.
Projective Texture Atlas Construction for 3D Photography
3.1 Visibility Calculation The first problem that we have to take into consideration when constructing a texture map from a set of images is the visibility problem, since we only want to map a particular photograph onto the portions of the scene that are visible from its camera viewpoint. Unfortunately the OpenGL implementation of projective texture mapping doesn’t not perform such visibility tests. There are several algorithms that solve the problem of visibility calculation (z-buffer, ray tracing, list priority algorithms, area subdivision algorithms, etc). For simplicity and efficiency purposes, we decide to implement an extension of the z-buffer algorithm, based on the hardware-accelerated OpenGL rendering. For each face in the model we determine from which cameras it is visible as follows: 1. Assign each face an index. 2. For each camera position, render the faces of the scene with z-buffering using the face index as their colors and save image. 3. We project each face using the model-view and projection matrix of each camera. Then we iterate over the pixels of the z-buffer image in the bounding box of the project face until its end or find a pixel with the same color of the face. If the color of the face is the present in the bounding box, we know that it is visible from that camera. Although this implementation is very efficient, its accuracy depends on the viewport resolution of the face size. Due to this fact, multiple faces could be projected onto the same pixel (very small faces or faces that are on a surface nearly parallel to the view direction). To solve this problem we adopted a solution given by [4]: in each pass render only the faces not yet detected as visible, until all faces are detected as visible. As consequence of this process, we know the set of cameras from which each face can be seen.
3.2 Distortion-Based Mesh Partitioning Algorithm In this phase we give attention to two aspects of our atlas construction process: minimize the mapping distortion, in order to reduce texture stretch, and minimize the number of charts, in order to have as large as possible continuous surface areas which are assigned to the same image. This first problem is fundamental because the most orthogonal camera to each face is the one which image has the most accurate color information for that face. The second problem has to be attacked because an excessive number of charts will cause problems related to color discontinuity between different parts of texture, besides increasing the texture map space. Considering this tradeoff between the number of charts and mapping distortion, we develop a method for mesh partitioning, described in Algorithm 1.
3
Algorithm 1 distortionBasedPartitioning() np ← 0 /*number of charts*/ while np is increasing do np ← chartAdding() chartGrowing() end while chartM erging()
Each step is described as follows: Chart Adding. In order to bootstrap the process we select the low-distorted face to each camera to be a seed for the chart growing process, based on the distortion-based metric: 2
D(f, c) = knf + nc k · af
(2)
where c represents the camera (with directon nc ) and f the face (with direction nf and area af ). For each seed we create a chart. After performing the chart growing step, every face of the mesh belongs to a chart. We will add a new chart to the atlas using the face with the biggest distortion error D(fi , ci ) as seed, what is in spirit a farthest-point heuristic. We add charts until we cannot select a face whose neighbor’s best cameras (those with low-distortion in respect to the neighbors) are the same of the face, in order to minimize the number of charts. Chart Growing. The problem of chart growing can be stated as follows: given n seeds representing the n charts, assign each face to a chart. We create this partition by growing all the charts simultaneously using the flooding algorithm proposed by [6] and the D metric. Just like the Lloyd’s algorithm [12], we want to cluster faces with low distortion D(f, c), in order to obtain a better partition (i.e. a partition with distortion smaller than the previous partition, what shows the variational nature of the method). The algorithm proposed by [6], with some modifications, is described as follows: 1. For each seed face f of the chart C , we insert its three adjacent faces in a priority queue (f1 , f2 and f3 ), with priority equal to the distortion error between these faces and C (D(f1 , c), D(f2 , c) and D(f3 , c)) and a tag representing C . 2. With these 3 · number of charts in the queue, we perform the growing process as follows: (a) Pop out a face f from the priority queue (the face with smallest distortion will be popped out). (b) Check f chart assignment. If it has been assigned to a chart, do nothing and repeat (a). (c) Otherwise, assign f to the chart indicated by the tag C , insert its unassigned adjacent faces in the queue with the same tag. (d) Repeat (a), (b) and (c) until the queue is empty, what means that each face of the model has been assigned to a chart. We repeat alternately the phases chart adding and chart growing until we cannot add a new chart to the partition
4
Luiz Velho, Jonas Sossai Jr.
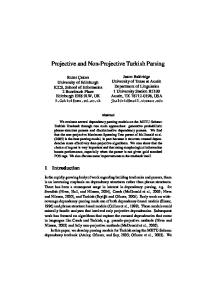
06 charts
30 charts
69 charts
on its image is used as the parametrization domain for the surface chart. The mapping between a parametrization domain and surface domain is defined using discrete sets of values: the projected chart and the model coordinates. This is done by projecting each chart boundary onto its associated image, using the correct camera parameters. Figure 2 shows an example of mapping a texture atlas on a 3D model.
4 Chart Frequency Analysis
Fig. 1 D as a function of the number of charts.
(from the restrictions that we have imposed). In Figure 1 we show an example of this algorithm. Chart Merging. Although we worried about the tradeoff between the number of charts and mapping distortion in the chart adding/growing process, still it is possible to reduce the number of charts, without increasing the mapping distortion. This reduction is possible because the resulting partition may contains adjacent charts assigned to the same camera. Since such as charts have the same projective mapping, the distortion in the texture-to-surface-mapping after merging them will be the same. After this merging operation the number of charts of Figure 1 is reduced to 39.
Fig. 2 Mapping the texture charts on the Branca model.
Image resolution can be understood as its capacity to discriminate information of a given object. Although an image has a fixed resolution, the object texture has different levels of detail. For this reason, an image has the potential disadvantage of using space inefficiently. Portions comprising low spatial frequency content require as much space as those with much higher spatial frequencies. As an example, faces of humans need high resolution details in areas such as eyes and mouth, while the appearance of other regions can be captured with fewer pixels per unit area. This wasted space may not matter to applications which rely primarily on small, repeated textures to enhance the appearance of a simple environment. However, the production of realistic environments often requires the use of large textures which are uniquely applied to individual surfaces. Texture frequency analysis for space optimization was explored in several works. In [9] a frequency map for the image is computed, using Fourier analysis. They partition the image based on this analysis to equalize the frequency content of each partition. Although this method is effective and simple, the resulting optimized image contains discontinuities. This idea is better explored in [1], in which the Fourier analysis is substituted by a wavelet analysis. From this analysis, a warping function is generated to uniformly distribute frequency content of the image. Motived by these works and by [5], in which a multiresolution texture atlas is constructed from a texture frequency analysis, we develop a method to construct multiresolution texture atlases which uses the same variational algorithm of Section 3.2, but with a frequency-based metric. In Section 4.1 we explains how to assign a ”detail content” to each face of the model. Section 4.2 describes the variational method to split the charts using a frequency-based metric. We show in Section 4.3 how to pack the charts in a texture map.
3.3 Parametrization and Discretization We have concluded the first step of the texture atlas construction process: partition the mesh in a small number of charts, based on the distortion in the texture-to-surface-mapping, such that each chart is associated to the image that contains the most accurate color information for that. The second step of the process (chart parametrization) is not a problem for us, since the parametrization of each chart is the projective mapping of its associated camera. Hence, each projected chart
4.1 Computing Frequency Content In order to create space-optimized texture maps we have to eliminate the wasted space caused by low spatial frequency regions in our texture map. This is achieved by analysing the frequency content of each chart of our atlas and partitioning them in regions of similar detail information. In this way we have to add a new attribute to
Projective Texture Atlas Construction for 3D Photography
the faces, its frequency content, which is calculated from the Laplacian pyramid [3] of the input images, a decomposition of the images into a hierarchy of images such that each level corresponds to a different band of images frequencies. The first level of the Laplacian pyramid contains the highiest frequency regions of the input image, so if the texture region of a face has a very sharp edge, we will assign this level to the face. Naturally we will assign lower levels to faces whose texture region have little detail information. But how to decide which level? Following [13], in which Mallat has proven that the local image regularity is characterized by the decay of the wavelet transform amplitude across scales, we have a way to decide which level of the Laplacian pyramid assign to each face. For each face of the mesh, we project its coordinates onto the images of different levels of the Laplacian pyramid (constructed from the input image linked to the face associated chart). The ”detail content” of the face in a given level is the maximum pixel value of the face projected region on that level. A decay of the detail content between the level k − 1 and k means that from the level k we are losing frequency content of the projected region. Therefore the Gaussian image correspondent to level k − 1 of our Gaussian pyramid is the last image that preserves the detail content of the face. In this way, the level that we have to assign to that face is level k − 1.
5
– Instead of a distortion-based metric, we now use a frequencybased metric. – We apply the process in each chart separately, since we the results obtained when using a mapping distortion based metric are more relevant to our problem. From Figure 3b we can see that the noise of the input images is captured. In order that our algorithm obtains better results, it is preferred to have as large as possible continuous surface areas with the same detail content. To achieve this, we adopt an iterative greedy approach: for each face, we assign to that face a higher detail pyramid level if that minimizes the number of different levels adjacent to that face. We then apply the algorithms chart adding, chart growing and chart merging from Section 3.2 on each chart separately with a frequency-based metric: F(f, l) = kl − lf k · af
(3)
where l represents the level of the chart and f the face (with level lf and area af ), creating in this way a set of sub-charts, clusters of faces with similar frequency content. Figure 4 shows an example of mapping this multiresolution texture atlas of 9 charts, where the charts are linked to a section of a input image (letters) and a level of the Laplacian pyramid (numbers).
4.2 Frequency-Based Chart Splitting Until now we have a atlas structure such that each chart of the atlas is associated to a section of one input image, in a way that the texture map distortion is minimized. Given the fundamentals of the previous section, we develop an algorithm to split the charts based on the frequency content of the their faces. Our atlas structure is then modified: each chart of the atlas is associated to a section and a pyramid level of one input image. However, the atlas distortion does not increase or decrease, since in this process we do not change the face-to-camera mapping. Figure 3 shows the results of this method on the Branca model. Fig. 4 Mapping the multiresolution texture atlas.
4.3 Packing
Textured model Frequency content New partition Fig. 3 Detail content and frequency-based chart splitting.
We apply the same algorithm developed in Section 3.2 with two modifications:
At this point of the process we have a number of charts, each one linked to a section of one input image and a level of the image Gaussian pyramid, through a parametrization that is the projective mapping of its associated camera. These texture charts need to be packed efficiently into a single texture map. But how? We adopt a heuristic similar to [15], but simpler. Basically, for each chart, we clip the bounding box of its texture region (by projecting the 3D points onto the image using the
6
associated camera parameters). In fact we clip a 1-texel bigger bounding box to avoid rendering artifacts at chart boundaries, such as discontinuities. We then sort these clipped regions by height and, in order of decreasing height, place them sequentially into rows until a inserted region exceeds the texture map width (given by the user). If this happens, we place this region just above the first region of the previous row, until all charts have been inserted in the texture map. We could use a better packing algorithm, but the texture compression given by our frequency analysis makes the size of the texture atlas small enough for our purposes.
5 Improving Color Continuity One of the major problems when constructing a texture map from different images is the color discontinuity between the parts of the mapped texture. This discontinuity is originated by different illumination conditions while capturing the images, since the photographs are taken by modifying the relative position between the camera/light source and the object. A solution to this problem, as proposed by [4], could be reached using the redundant information of the texture map. In [4] the frontier faces (those that are the frontier between charts) are represented in a redundant manner in the texture map, what means that if a face f is on the frontier between two charts c1 and c2 , the texture map stores the color information of the face when using the mapping to image i1 assigned to chart c1 and when using the mapping to image i2 assigned to chart c2 . Although we do not represent any faces of our model in a redundant manner (since our texture atlas is obtained from a partition of the model, and consequently, no face belongs to more than one chart), we know that two faces share a common edge. So, if a edge is shared by two frontier faces, this edge is mapped twice in the texture map, with the color and illumination information from two different images. Figure 5 illustrates, for the 1D case (axis x represents the pixels and axis y the colors), how this redundant information could be used to smooth the transition between two adjacent regions. In this example the discontinuity of two functions happens at the pixel xf . At this pixel function f1 has color c1 and function f2 has color c2 . Let c1,2 be the mean color of c1 and c2 . So the difference c1,2 − c1 is how do we have to change the color of xf when it is assigned to the function f1 to became compatible with color c2 (the difference c1,2 − c2 is used in the same way). Once these ”correction factors” have been calculated, we can propagate this difference in order to create a smooth transition between the functions. In our case, as mentioned before, each frontier edge is projected twice in the texture map. For each one of these edges we compute the color difference between corresponding texels in the two projected lines (correction factors), in order to create a signed RGB image (called ”texture correction image”). With these factors calculated we are able to
Luiz Velho, Jonas Sossai Jr.
Fig. 5 Smoothing the transition between two 1D functions.
perform a diffusion of them over the whole texture space. But how to do that in a efficiency and accurate way? In [4] they develop a method to diffuse the sparselydefined texels (correction factors) of the texture correction image based on the pull-push interpolation method described by [7], which uses a pyramid algorithm to fill in gaps. Basically this method computes a gaussian pyramid of the texture correction image and fills the void texels in the successive higher resolution images by a bilinear interpolation of the correction factors in the lower resolution image, until all the texels of the higher resolution texture correction image are filled. We develop a new method which produces smoother results, since it is not based on interpolation. For the problem of sparse interpolation we consider the sparse points (correction factors) as heat sources and solve the problem applying the heat (diffusion) equation on each heat source, which represents the flow of heat from that source. This solution was also explored in the method for approximating lighting on 2D drawings by [10]. In the implementation the correction factors between frontier edges remain fixed; unknown values texels are relaxed across the image. Given a field of values P to be interpolated, and a velocity field V , initially zero, each iteration is computed by: 0 Vi,j = d · Vi,j + k · (Pi−1,j + Pi+1,j + Pi,j−1 + Pi,j+1 − 4 · Pi,j ) 0 Pi,j = Pi,j + Vi,j (4)
As experienced by [10], values d = 0.97 and k = 0.4375 minimize the time of convergence. Iterations are run until the mean-squared velocity per pixel reaches a error tolerance (equilibrium temperature). Figure 6 shows an example of applying the diffusion on a texture map constructed from an atlas of 5 charts. The problem of this method is that the diffusion equation takes a long time to converge. A solution to this efficiency problem is to explore the multiscale idea of the pull-push interpolation method. We use a multigrid solver (detailed in the tutorial [2]), since it is very used to solve partial differential equations on a 2D grid. A multigrid solver has two basic operators: restriction and prolongation: – Restricting : A sequence of lower resolution images is constructed from the texture correction image, such that no texel values are void in the lowest resolution. – Prolongating : The information from each lower resolution image, after applying the diffusion equation (Equation 4) until convergence, is combined with the next higher
Projective Texture Atlas Construction for 3D Photography
Texture
Factors
Smoothing
Fig. 6 Smoothing the frontier edges correction factors.
resolution image to fill in the void texels. Then we apply the diffusion equation until convergence on this new image.
7
efficiency (the sum of rectangles areas divided by the rectangular texture domain area). Therefore packing efficiency = intra-rectangle efficiency x inter-rectangle efficiency. For these results, we have ignored the overhead that would be caused by the 1-texel gutter required between charts (see Section 4.3). The method efficiency, called texture efficiency is the stretch efficiency times the packing efficiency. Since the atlas produced for the Human Face model has almost 8 times the number of charts of the one produced for the Branca model, the texture efficiency of the last one is smaller. Models Vertices Faces Charts Distortion Texture map dimensions Stretch efficiency intra-rectangle efficiency inter-rectangle efficiency Packing efficiency Texture efficiency
Branca 5177 9852 5 5875.18 220x396 80% 64% 78% 50% 40%
Human Face 4971 9406 39 4680.54 750x755 86% 49% 80% 39% 34%
Table 1 Quantitative results
Fig. 7 Before and after improving color continuity
We apply this method on each chart separately, since we are only considering the influence of adjacent charts to smooth the interior area of a chart. Since the convergence time of the diffusion equation depends on the size of the missing region, which is reduced when applying the prolongation operator, our multigrid method is very efficient. After constructing this smooth correction texture image, we add it to the previously calculated texture map, obtaining a uniform and continuous texture map (Figure 7).
Figure 8 shows an accuracy comparison between the texture models obtained by our algorithm and by [4] with the original object images. Despite of the good accuracy of the two methods, we pose texture atlas generation as an optimization one, in way that our method tries to generate a partition that minimizes the stretch distortion and the number of charts. For this reason our method gives better results and produces less charts than [4]. 7 Conclusions and Future Works
In this work we have proposed the use of a optimization method in the construction of multiresolution texture atlases from a set of images. The variational scheme allow us to construct well partitioned, low distorted and space-optimized texture atlases. In addition, we have applied packing techniques in order to reduce the space of charts, and blending methods, to increase the color coherence between adjacent patches. Our method, while simple, is effective, as results 6 Results have shown. We have implemented a simplified packing algorithm. We have applied the method on two target objects, the Branca model, that was acquired from a set of 3 images, and the Hu- We would have better results, in respect to packing efficiency, man Face model (gently yielded by the ISTI-CNR), acquired if we pack the charts boundary directly rather than their bounding rectangles (like [11] and [16]). Another area of research from 6 images. Table 1 presents general quantitative results of the atlas is to examine how best to address the trade-off between atlas construction process on the two models. Stretch efficiency distortion and the number of charts. We could also exploit the construction of atlases with is the total surface area in 3D (sum of the patches area) divided by the total chart area in 2D. Packing efficiency is the other surface attributes, like normal and displacement fields, sum of chart areas in 2D divided by the rectangular texture in order to allow the user to create/modify any kind of atdomain area. We can separate the packing efficiency into tribute maps through an attribute editing application which intra-rectangle efficiency (the sum of chart areas in 2D di- could be used for modeling operations, for example, based vided by the sum of rectangles areas) and inter-rectangle on normal maps created / modified by a user.
8
Luiz Velho, Jonas Sossai Jr.
Real photograph
[4] synthetic model (512x1024 texture map, 73 charts)
Fig. 8 Comparing the real photograph of the Human Face model with [4] results and our results.
References 1. L. Balmelli, G. Taubin, and F. Bernardini. Space-optimized texture maps. Comput. Graph. Forum, 21(3), 2002. 2. W. L. Briggs. A multigrid tutorial. http://www.llnl.gov/ CASC/people/henson/mgtut/welcome.html. 3. P. J. Burt and E. H. Adelson. The laplacian pyramid as a compact image code. pages 671–679, 1987. 4. M. Callieri, P. Cignoni, and R. Scopigno. Reconstructing textured meshes from multiple range rgb maps. In VMV, pages 419–426, 2002. 5. N. A. Carr and J. C. Hart. Painting detail. ACM Trans. Graph., 23(3):845–852, 2004. 6. D. Cohen-Steiner, P. Alliez, and M. Desbrun. Variational shape approximation. ACM Trans. Graph., 23(3):905–914, 2004. 7. S. J. Gortler, R. Grzeszczuk, R. Szeliski, and M. F. Cohen. The lumigraph. In Proceedings SIGGRAPH ’96, pages 43–54. ACM Press, 1996. 8. P. Hanrahan and P. Haeberli. Direct wysiwyg painting and texturing on 3d shapes. In Proceedings SIGGRAPH ’90, pages 215–223. ACM Press, 1990. 9. A. Hunter and J. D. Cohen. Uniform frequency images: adding geometry to images to produce space-efficient textures. In Proceedings VIS ’00, pages 243–250. IEEE Computer Society Press, 2000. 10. S. F. Johnston. Lumo: illumination for cel animation. In Proceedings NPAR ’02, pages 45–ff. ACM Press, 2002. 11. B. L´evy, S. Petitjean, N. Ray, and J. Maillot. Least squares conformal maps for automatic texture atlas generation. In Proceedings SIGGRAPH ’02, pages 362–371. ACM Press, 2002. 12. S. P. Lloyd. Least squares quantization in pcm. IEEE Transactions on Information Theory, 28(2):129–136, 1982. 13. S. Mallat and S. Zhong. Characterization of signals from multiscale edges. IEEE Trans. Pattern Anal. Mach. Intell., 14(7):710– 732, 1992. 14. M. Marinov and L. Kobbelt. Automatic generation of structure preserving multiresolution models. Comput. Graph. Forum, 24(3):277–284, 2005. 15. P. V. Sander, J. Snyder, S. J. Gortler, and H. Hoppe. Texture mapping progressive meshes. In Proceedings SIGGRAPH ’01, pages 409–416. ACM Press, 2001. 16. P. V. Sander, Z. J. Wood, S. J. Gortler, J. Snyder, and H. Hoppe. Multi-chart geometry images. In Proceedings SGP ’03, pages 146–155. Eurographics Association, 2003.
Our synthetic model (750x755 texture map, 39 charts)