PROJECT FINAL REPORT
“Final publishable summary report”
Grant Agreement number: TREN/FP7TR/218694/”BE LOGIC” Project acronym: BE LOGIC Project title: Benchmark Logistics for Co-modality Funding Scheme: Collaborative project Period covered: from September 2008 to February 2011 Name of the scientific representative of the project's co-ordinator, Title and Organisation: ing. Jeroen Bozuwa, ECORYS Nederland BV Tel: + 31 (0)10 4538751 Fax: + 31 (0)10 4523680 E-mail:
[email protected] Project website address: www.be-logic.info
TR16361r04 BE LOGIC_final_report_en_v04_publishable.doc
1
TR16361r04 BE LOGIC_final_report_en_v04_publishable.doc
2
Table of contents 1
EXECUTIVE SUMMARY ......................................................................................................................... 5
2
PROJECT CONTEXT AND OBJECTIVES ............................................................................................ 7
3
BENCHMARK TRANSPORT LOGISTICS: THE POLICY PERSPECTIVE .................................. 11 3.1 3.2
4
BENCHMARK TRANSPORT LOGISTICS: THE TRANSPORT CHAIN PERSPECTIVE........... 15 4.1 4.2 4.3
5
INTRODUCTION ON THE BE LOGIC TOOLS ......................................................................................... 15 THE LOGISTICS BENCHMARKING TOOL .............................................................................................. 15 THE EUROPEAN INTERMODAL ROUTE FINDER (EIRF)........................................................................ 19
ANALYSIS OF LOGISTICS QUALITY STANDARDS....................................................................... 25 5.1 5.2 5.3
6
PROCESS ............................................................................................................................................. 11 RESULTS ............................................................................................................................................. 11
PROCESS ............................................................................................................................................. 25 RESULTS ............................................................................................................................................. 25 RECOMMENDATIONS........................................................................................................................... 26
IMPACTS AND DISSEMINATION ....................................................................................................... 29 6.1 6.2
POTENTIAL IMPACTS ........................................................................................................................... 29 MAIN DISSEMINATION ACTIVITIES ...................................................................................................... 29
TR16361r04 BE LOGIC_final_report_en_v04_publishable.doc
3
1
Executive Summary Background
Efficient use of transport modes and resources requires understanding the options and alternatives and being able to make the right logistics choices. Benchmarking is an instrument which can help to answer this question. Differences in the performance of various modes within the transport sector of a given country, and between the transport systems of different countries, imply that there is a significant potential for improvement. BE LOGIC project objectives
Key objectives of BE LOGIC are: To improve the efficiency within and across different modes of transport; To support the development of a quality logistics system. Derived objectives and research questions: Develop a methodology to assess transport logistics performance in quantitative terms at different levels in Europe and globally; Apply the benchmark methodology to assess logistics and intermodal policies of Member States and other countries; Assess transport logistics choices and performance from shippers and logistics service providers; Assess transport logistics performance from transhipment points; Examine existing quality standards (e.g. ISO, CEN) for transport logistics; Consider the need for new quality standards for transport logistics.
Main results achieved
The following main results of the project have been achieved: The Logistics Benchmarking Tool that aims to support a company’s search for potential strategic improvements due to a modal change. The tool compares the current practice with an alternative based on a different transport mode, six main criteria are used: time, cost, flexibility, reliability, quality and sustainability. The combination of these criteria provides the user with a broad overview of the potential effects of a modal change. The European Intermodal Route Finder (EIRF) which enables users to find information on intermodal connections between European (27 EU countries, plus Norway and Switzerland) intermodal freight terminals. Other important results achieved are: Benchmark of transport logistics policies on different geographic levels with the aim to identifying policy caused barriers for the development of intermodal transport. Recommendations on quality standards for transport logistics.
Potential impacts
Improved visibility of co-modal solutions through the EIRF, leading potentially to better use of intermodal transport opportunities. Structured comparison between road-only and co-modal alternatives, thus leading to better decision making on modal choice. Reduced environmental impact of freight transport and thus a more sustainable transport system.
TR16361r04 BE LOGIC_final_report_en_v04_publishable.doc
5
TR16361r04 BE LOGIC_final_report_en_v04_publishable.doc
6
2
Project context and objectives Background
Efficient use of transport modes and resources requires understanding the options and alternatives and being able to make the right logistics choices. Benchmarking is an instrument which can help to answer this question. Differences in the performance of various modes within the transport sector of a given country, and between the transport systems of different countries, imply that there is a significant potential for improvement. Ongoing technological advances and changes in economic and institutional approaches ensure that this potential is constantly evolving. The transportation sector is influenced and moulded by ongoing economic, environmental and political (usually in the form of public finances) pressures to realise its potential for improvement. BE LOGIC project vision
It is the core business of the largest logistics service providers, freight forwarders and freight integrators to optimise logistics performance for themselves and for their customers. Every day, highly trained and educated professionals within these companies try to achieve the best possible services, often already by benchmarking their performance with others. The level of know-how, experience and expertise in the field of transport logistics within these companies is impressive. We do not have the illusion that the results of this project would result in an enormous efficiency gain of the performance of these key players. We should take advantage of their know-how and identify their best practices that could help other companies to improve their performance. The aim of FP7 is to strengthen the 'innovation capacity' of SMEs in Europe, extend their networks, better exploit research results and acquire technological know how, bridging the gap between research and innovation. The BE LOGIC project vision fully supports this aim. Our approach concentrates on developing and applying a benchmark methodology that aims to support a company’s search for potential strategic improvements due to a modal change. Key objectives of BE LOGIC:
Improve the efficiency within and across different modes of transport Support the development of a quality logistics system
Derived objectives and research questions: Develop a methodology to assess transport logistics performance in quantitative terms at different levels in Europe and globally; Applying the benchmark methodology to assess logistics and intermodal policies of Member States and other countries; To assess transport logistics choices and performance from shippers and logistics service providers; To assess transport logistics performance from transhipment points; Examine existing quality standards (e.g. ISO, CEN) for transport logistics; Consider the need for new quality standards for transport logistics.
TR16361r04 BE LOGIC_final_report_en_v04_publishable.doc
7
The BE LOGIC project has been executed from 1 September 2008 until 28 February 2011. During the first project year (1 September 2008 – 1 September 2009) the following project objectives have been achieved:
Development of a methodology for the concrete benchmarking processes for the policy level, for the transport chain level and for the inland terminal level in order to achieve results that can be implemented in an online benchmarking tool. This ensures that the methodologies used for benchmarking generate indicators and processes that are practicaloriented and also feasible to be applied in practice. First conceptual design of the Logistics Benchmarking Tool. Impact assessment of freight transport trends on a set of Aggregate Performance Indicators (APIs ) for freight transport (logistics market analysis). Identification and (uniform) description of logistical good practices. Analysis of existing standards for logistics quality, identification of their strengths and weaknesses, review of market take up and their acceptance by customers and operators. Dissemination of the mid-term results achieved through the project website, project brochure, first newsletter and conferences.
During the next 1,5 year of project (1 September 2009 – 28 February 2011) the following objectives have been achieved:
Identification of the relevant policy framework conditions for transport logistics and intermodality. Identification of policy based barriers for efficient transport logistics and intermodality by comparing and analysing these policy framework conditions. Testing a first prototype of the Logistics Benchmarking Tool (still in MS Excel format) in a first range of transport chain case studies in order to find room for improvements of the tool. Testing of an online prototype of the Logistics Benchmarking Tool in a second range of transport chain case studies. Assessment of transport logistics performance from the European inland terminals’ perspective. Development of a second tool, the European Intermodal Route Finder (EIRF), which enables users to find intermodal connections and related services on certain transport routes across the EU27 plus Norway and Switzerland. Evaluation of the official transport logistics standards as well as an assessment of the logistics sector initiatives. Dissemination of the results achieved through updates on the project website, second newsletter and conferences. BE LOGIC Final Conference at STC Events in Rotterdam held on 16 and 17 February 2011 with participation of more than 80 stakeholders.
Development of benchmark methodology
In order to improve the efficiency within and across different modes of transport (1st key objective of BE LOGIC), transport decision makers have to understand the options and alternatives first. Benchmarking is an instrument which can help here. At the start of the project an overall benchmarking framework was developed aiming at a common understanding and approach in terms of a methodology development for the benchmarking transport logistics from different perspectives: the policy perspective, the transport chain perspective and the terminal perspective.
TR16361r04 BE LOGIC_final_report_en_v04_publishable.doc
8
A methodology for a benchmark of logistic policies was developed serving as the base for the transport policy benchmarking (figure 1). The methodology started with identifying relevant transport logistics policy papers, programmes, directives and regulations governing transport logistics in Member States and other countries. A set of key performance indicators (KPI’s) for the policy benchmarking of Member States has been identified and validated during interviews with representatives from the policy sector. BASIS EU transport policy documents First benchmarking step
Identification of relevant policy documents in USA and Japan
Action plan for keeping freight moving Towards a more competitive rail freight sector Maritim transport without barriers Greening Transport Action plan for the devolpment of Intellegent Transport Systems in Europe
Identification of relevant policy documents in selected EU Member States
Identification of intended policy outcomes regarding logistics and co-modality EU selected EU Member States (MS)
Template: "policy outcome linkage" to compare identified intended policy outcomes in EU, USA and Japan
Template: "policy outcome linkage" to compare identified intended policy outcomes in EU with MS and between MS
Linkage and comparision of intended policy outcomes EU/ USA/ Japan
Linkage, comparision and conflicts of intended policy outcomes EU/ MS
Existing policy outcomes (directives, regulations, etc.) per benchmarking area USA, Japan Third benchmarking step
Template: "document summary sheet" to be used per identified policy document
USA, Japan Second benchmarking step
White Paper - European transport policy for 2010: Time to decide Mid term review of White Paper Towards a rail network giving priorirty to freight EU freight transport agenda Freight transport logistic action plan Logistics . Keeping freight moving
Existing policy outcomes (EU-directives, EU-regulations, etc.) per benchmarking area EU
Analysis of studies
Existing policy outcomes (directives, regulations, etc.) per benchmarking area MS
Template: "Indicator list EU_USA_Japan" to compare existing policy outcomes in EU, USA and Japan based on EU directives and regulations
Template: "Indicator list MS comparison" to compare existing policy outcomes in EU with MS outcomes based on EU directives, regulations and existing studies
Comparision of existing policy outcomes EU/ USA/ Japan
Comparision and conflicts of existing policy outcomes EU/ MS H E R R Y
Figure 1: Principal design of the benchmarking method
In parallel a methodology for a benchmarking of transport chains and terminals was developed serving as the base for the transport chain and terminal benchmarking. Relevant KPI’s for the transport chain benchmarking have been identified. In addition to the description of work (Annex I of the Grant Agreement) a number of interviews were carried out with policy makers and stakeholders in the transport logistics sector in order to validate the identified KPI’s in terms of their use, their feasibility and their applicability. Based on the analysis of the benchmarking methodology specification and KPI’s developed, the general requirements for the e-benchmarking tool have been defined. Further, the software specifications according to the general requirements were identified. Quality standards for transport logistics
In order to support the development of a quality logistics system (2nd key objective of BE LOGIC) a comprehensive analysis was conducted. First existing standards for logistics quality were collected and analysed. Next their strengths and weaknesses were assessed, as well as their market take up and acceptance by customers and operators (applying Delphi technique and an expert focus workshop to validate the findings). This finally resulted in clear recommendations for both governments and for users and providers on how quality could be handled and established in the best way.
TR16361r04 BE LOGIC_final_report_en_v04_publishable.doc
9
How to read this report?
The next chapters summarise the process towards achieving the key objectives and provides a more detailed overview of the results, conclusions and recommendations. Chapter 3 describes benchmarking transport logistics from the policy perspective, identifying main barriers that exist and some general recommendations on how to solve these barriers. Chapter 4 deals with benchmarking transport logistics from the transport chain perspective (including terminals), and particularly the two tools developed under BE LOGIC which support companies in their search for potential strategic improvements of their transport logistics choices. Chapter 5 summarises the work conducted to assess the need for a quality standard for transport logistics. Finally, the potential impacts of the project and the main dissemination activities are summarised in chapter 6.
TR16361r04 BE LOGIC_final_report_en_v04_publishable.doc
10
3
Benchmark perspective
3.1
Process
transport
logistics:
the
policy
Policy documents have been analysed for 13 European countries and for USA and Japan. These policy documents present a lot of intended outcomes to be achieved in the (near) future. Examples of policy intended outcomes is for instance more fair competition across the EU 27 by reducing differences of transport related taxes between the countries. Another example is improving the linkage between transport modes by enlarging the capacities of ports and inland terminals. Due to many existing barriers not all objectives will be achieved. Understanding of how to handle the existing barriers and reduce these in order to achieve the policy goals set, it is important to first know the barriers. Further, it gives recommendations to overcome these barriers. 3.2
Results Infrastructure investments in it self remains a barrier for intermodal transport
Because of budget restrains, prioritization of the investments in the European intermodal network is crucial and has become even more important with the economic crisis and scarcity of financial means. So, budget restrains in it self is an important barrier which hinders the development of suitable port infrastructure and hinterland connections by rail and inland waterways (including terminals for transhipment) as an alternative for road transport. With infrastructure budget under pressure, European coordination on infrastructure development becomes more important. This coordination amongst European stakeholders is lacking however: There is no binding allocation of financial means for the development of (port) infrastructure, which causes planning uncertainties for ports, which in turn may lead to sub-optimal development of ports in Europe. Prioritization of freight at the cost of passenger transport by rail is not always at the interest of national and local politicians. In some countries only a limited number of public funds are allocated to the development of transport terminals, as the focus is still too much on improving connecting infrastructure (i.e. missing links) and through that on the substantial investments needed. In countries where waterborne transport plays a less prominent role, the political urgency to integrate waterborne transport in transport chains is lacking. Experiences with alternative funding through Public Private Partnership is lacking in many countries. With coordination lacking and budget restrains remaining or even increasing, there is a risk that the development of green corridors for freight transport (which need high investments) gets less priority. Differences between countries (i.e. transport related taxes, vehicle weights and dimensions) hinder a level playing field
Taxes are still mainly fixed at the national level. Only specific maximum and minimum levels are fixed with directives and regulations at a European level but no concrete tax level harmonisation exists. The introduction of a real tax harmonisation can only be achieved if member states agree upon such a harmonisation. TR16361r04 BE LOGIC_final_report_en_v04_publishable.doc
11
The existing Euro-vignette-directive enables but does not force the implementation of use based charging. Further, the discussion about the amendment of the Euro-vignette-directive fell to a minimum with the beginning of the economic crises. The internalisation of external costs within toll tariffs on EU level is a further step to use based charging and thus a level playing field. However, transport associations may lobby for their own specific agenda which is not always in the interest of fair competition both within a Member State and between Member States. The current discussion regarding a possible introduction of larger and heavier trucks leads to very contrary actions taken by the Member States and even by regional authorities within certain countries. Although national differences have to be taken into account, it should not lead to different rules that apply to the use of such trucks, as this may lead to uncertainty amongst transport operators. Low interest in improving the quality of services through training and education
Especially in the transport and logistics sector, which is dominated by small and medium sized enterprises, the typical behaviour is “we do it as we always did”. Moreover, small transport companies and one-person-enterprises (owner driver) in particular, often do not have time and budget resources for training and education. This may hinder efficiency improvements and effectiveness of measures aiming to improve the performance of the sector in general and intermodal transport in particular. This is especially true for adopting new technologies and innovations which can significantly improve the level of quality of transport services. The economic downturn may even worsen this situation, as new technologies may require substantial investments. Companies may therefore consider shifting their budgets for “new technologies” to “repair the existing systems”. Recommendations
Based on the main barriers identified, the following general recommendations can be made:
The EC should invest in infrastructure, particularly in rail infrastructure, intermodal terminals and ports. This also applies to the continuation of the Rail Freight Corridors and Green Corridors. Given the limited resources, it is important that priorities are set and that there is a commitment of resources. Progress should be monitored closely. Cost Benefit Analysis could be used to assist in the prioritization, and the EC should have an open eye towards Public Private Partnership to attract other sources of financing. The EC should remove differences between countries. This especially applies to a proactive approach towards ‘megatrucks’, where the EC should aim for a common legal framework in which these large and/or heavy trucks are allowed across Europe. The same applies for uniform safety and security measures for freight vehicles/vessels/trains across Europe. The rail market should be truly liberalised in all EU countries. Training and education in the logistics sector should be a major point of attention. The sector should aim for a minimum level of quality, in order to guarantee a minimum level of services. Special attention should be paid to three aspects: New technologies: not only should the sector be able to work with the new technologies, but higher level employees should also have a basic understanding of IT and be able to express their needs and requirements in a way that it is understood by the IT industry. New methods of working: The transport sector is changing quickly, influenced by globalisation, IT developments, environmental concern, etc. These aspects should be included in the training and education of students and existing personnel.
TR16361r04 BE LOGIC_final_report_en_v04_publishable.doc
12
Best practices could be a good way of showing ‘hands on’ how these new technologies and methods can be applied. In order to have a fair competition within and between modes, harmonisation of taxes and internalisation of costs is a prerequisite. By applying objective criteria, a fair pricing system can be established, taking into account external effects, in which neither specific modes, nor specific countries get a preferential treatment. Last but not least the EC should emphasise the importance of Intelligent Transport Systems (ITS) and act accordingly. ITS in the form of the Single Window concept can be a very effective way to reduce bureaucracy and improve efficiency. In addition, standardization of information exchange between transport modes, such as a Single Transport Document, Intermodal Route Planner and Tracking & Tracing, can significantly improve the competitive position of intermodal transport compared to unimodal transport. In rail the further implementation of ERTMS is essential.
Improve data availability to measure and monitor the performance of the EU27 freight transport system
A more specific lesson was learned during the impact analysis of trends on the performance of the freight transport system. The main issue here is the lack of data availability for EU-27 for all transport modes. Moreover, for a number of important indicators such as load factors, operating cost, energy intensity and emissions intensity, very little information or no information at all was available. For the case of energy intensity and emissions intensity, the available data was not disaggregated at the level of freight transport, i.e., data was available for the entire transport sector but not for specific transport modes or terminals. It is therefore recommended to collect data for these important indicators in the future. The availability of reliable load factor data for all freight transport modes is considered of highest importance, as load factors are used in all modelling efforts to establish the relationship between transport performance (tonne-kilometres) and traffic performance (vehicle-kilometres). A number of important indicators to monitor the sustainability of the transport system, such as energy consumption and emissions, are greatly influenced by the input data used for the load factor. It is therefore very important to conduct studies on the estimation of load factors in EU-27.
TR16361r04 BE LOGIC_final_report_en_v04_publishable.doc
13
4
Benchmark transport logistics: the TRANSPORT CHAIN perspective
4.1
Introduction on the BE LOGIC tools
The objective of benchmarking transport logistics from the transport chain perspective is to improve the quality and efficiency within and across different modes of transport. A benchmark of logistics chains can give companies insight into the potential gains of reconsidering their logistics choices in terms of costs and performances, environmental impact, quality of service. BE LOGIC has developed two web based tools which support companies in their search for potential strategic improvements of their transport logistics choices: 1. The Logistics Benchmarking Tool, enabling users to compare two alternative transport chains on six main criteria: time, cost, flexibility, reliability, quality and sustainability. The combination of these criteria provides the user with a broad overview of the potential effects of a modal change. 2. The European Intermodal Route Finder (EIRF), enabling users to construct their own intermodal routes (direct terminal-terminal relations and indirect terminal relations using one transhipment terminal). The following paragraphs summarise the process of developing both tools, and describe the main results and the recommendations. 4.2
The Logistics Benchmarking Tool Process
Starting point for the Logistics Benchmarking Tool was the overall Benchmark Framework (as already referred to in chapter 2). An extensive literature review was performed and a large number of interviews across Europe were conducted that revealed several insights into the way transport chain actors monitor and benchmark their performance relative to their previous results as well as their competitors. A general set of main indicators could be retrieved. The following six indicators were considered important and used by all interviewees: • • • • • •
Transport cost (quotation) Transport time Flexibility Punctuality Quality Sustainability.
The Logistics Benchmarking Tool was developed in two phases: a basic MS-excel-sheet to test the tool’s methodology and a more sophisticated and methodologically improved online version. The BE LOGIC partners have presented both versions of the tool to companies in Europe. The comments resulting from the first testing round were used to improve the tool
TR16361r04 BE LOGIC_final_report_en_v04_publishable.doc
page 15 of 33
right away. Finally, on the basis of the recommendations received during the tests, an online benchmarking self-assessment tool has been designed and implemented. It is referred to as the Logistics Benchmarking Tool. Main results
The Logistics Benchmarking Tool is presented here by a few screenshots, in order to give an impression of its possibilities. As example a transport from Paris to Milano is used. The tool starts with defining the base case, indicating the distance, the mode of transport and possible intermediate points (see figure 2).
Figure 2: Definition of ‘base case’
Then, for this base case alternative, the key performance indicators and sub-indicators have to be filled in by the users of the Logistics Benchmarking Tool. These (sub)indicators can be either quantitative (see example in figure 3) or qualitative (see example in figure 4).
Figure 3: Example of quantitative indicator ‘time’
TR16361r04 BE LOGIC_final_report_en_v04_publishable.doc
page 16 of 33
Figure 4: Example of qualitative indicator ‘flexibility’
For the indicator ‘environmental sustainability’ the Logistics Benchmarking Tool makes use of the website www.ecotransit.org. The results from this website can be copied to the Logistics Benchmarking Tool (see figure 5).
Figure 5: Example of the environmental indicator
The tool includes CO2, NOx, Non-Methan Hydro Carbons and particles. Depending on the priorities of the users it can give different weights to each of these pollutants. Then, the same steps have to be completed for the intermodal alternative, e.g. from Paris to Milano via Turino. Once this has been completed, the user will give weights to each of the six main indicators that were chosen at the start of the tool, i.e. transport time, costs, flexibility, reliability, quality and environmental emissions. After all these inputs have been given, the user is able to go to the results of the benchmarking of these two transport alternatives: road-only or train from Paris (via Turino) to Milano.
TR16361r04 BE LOGIC_final_report_en_v04_publishable.doc
page 17 of 33
Figure 5 shows that in this example the rail alternative is worse than the road alternative on the indicators ‘transport time’ and ‘costs’. On the indicator ‘environmental sustainability’ rail is performing better. For the other indicators the scores are equal. Given the weights allocated to each of the indicators, the overall score of ‘road’ is approximately 11% better than the ‘rail’ alternative. However, if the weight of the indicator ‘environmental sustainability’ would have been significantly higher, the result would have been rather different. Apart from a tabular presentation, graphics are also available, as well as an output-file in pdfformat.
Figure 6: Comparing the two alternatives
Conclusions and recommendations
An analysis of the interviewees’ reactions to the Logistics Benchmarking Tool reveals that the majority see the tool as a well-structured support to strategic decision making. Both in small and larger companies, the comparison of options is often a process that takes place in one’s mind. To see this process being explicitly translated into a tangible tool was received as a valuable contribution. Interviewees claim that communicating a trade-off with colleagues, managers or customers benefits from this tool and more specifically the way in which the results are visually presented. While seeing the potential benefits, some companies indicated that their current way of working, without the tool, has been satisfactory in the past, and that they would probably not use the tool for daily planning purposes. However, a large part of the companies indicated that he tool is especially useful when trying to grasp the pros and cons of new lanes.
TR16361r04 BE LOGIC_final_report_en_v04_publishable.doc
page 18 of 33
Having said that, their comments also emphasized the fact that certain elements can be improved. To summarize, the most important recommendations on further improvements regarding the usefulness of the tool are that:
Users should be able to work through the tool faster; as it is already possible to only select a small set of indicators for comparison, a possible solution would simply be to make the user interface more user-friendly. The tool should be partly automated. More specifically information on transport time and emissions could be automatically retrieved from other tools/websites. Users should be able to select non-terminal locations in order to more easily compare door-to-door transport. Users should be able to add their own additional indicators to the tool in order to take them into account when comparing alternatives. While the majority of the interviewees completely agree with the 6 defined indicators, it is argued that having the option to add a business or case-specific indicator would only add to the overall value of the tool.
Even though BE LOGIC’s focus has been on SME’s from the very beginning, it was decided to interview a wide array of companies in order to be able to analyse the tool from different angles. An interesting conclusion after talking to larger companies (mainly shippers) is that they see potential for using the Logistics Benchmarking Tool when evaluating and comparing incoming tender applications. It is recommended to further look into the possibilities for this specific use of the tool.
4.3
The European Intermodal Route Finder (EIRF) Process
In order to facilitate the users of the Logistics Benchmarking Tool to explore intermodal alternatives, a terminal database was developed. Starting point for the database development were already existing databases. The ISIC-project1 developed a database comprising approximately 700 intermodal terminals. Also the database of BE LOGIC partner UIRR was consulted. The BE LOGIC partners started with a labour-intensive search for terminal information (i.e. through terminals’ websites, direct contacts with terminal operators, journals with time tables). In order to collect the information in a uniform way, all partners used the same data collection template. Once the database was filled with information (e.g. modes used, transport times to destination terminals, frequencies of the service, contact information of terminals and URL, information of relevant terminal operators) a retrieval algorithm was developed, which enables users to find information on connections between European (27 EU countries, plus Norway and Switzerland) intermodal freight terminals: the European Intermodal Route Finder (EIRF).
1
Integrated Services in the Intermodal Chain (ISIC), final report Task D Improving quality of intermodal terminals, 2005.
TR16361r04 BE LOGIC_final_report_en_v04_publishable.doc
page 19 of 33
Main results
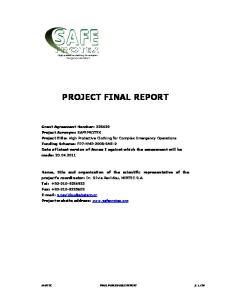
The European Intermodal Route Finder enables users to search for intermodal alternatives between terminals located in 29 European countries (EU27 plus Norway and Switzerland). More specifically the tool provides the user with an overview of services offered between terminals. It includes more than 4,000 direct terminal-terminal relations and over 70,000 indirect relations (including one transhipment terminal). For each relation that is found in the database an overview is produced of transport times, frequencies and modes used between the terminals (including transport by rail, inland waterways and short sea). The map below shows all locations with activated terminals (approximately 650) connected by rail, inland shipping or sea. As might be expected there are many more rail terminals than inland shipping terminals. In East-Europe rail terminals are dominating the landscape, whereas in the Benelux and along the Rhine corridor the network of terminals seems to be overdensed.
# # " # " #
# # " # "
" #
# "
# " # " #
# " #" # "#
" "
# # "
" "#
"# # "" # "
# "
" # "# # " " "# # ""
# # # " # # " " # " " # " # " # " # " " "# ## " # " ## # " " # " # ## "" "" ! # " ! # # " ! " # " # # " ! # # ! # ! # " " # ! " # " # ! # " " ! ! # "" " # # "# ! "# # ! # " # ! " # " # " " ! # # "" ! # # ! # # ! " # " # # ! " ! # " # !# # !# # ! # ! # ! # ! # ! # "! !! # # " # !! # # # ! " # !! # # " !# # ! " # # " " ! ! ! # # ! # ## ! ! "! # !! # !# # # # ! # # "# ! # # "! # ! ! # "# " " ! # # " !"" # ## # ! # ! " ""! ! " ! # # !# # # ! # # ! " # " ! ! # !# ! # # # "## ! !# # # ! ! # # #"!# ! "" # !# # ! # ! ! ! # ! # # ! # ! # # ! !! # # ! !# # ! ! # ! # # !# ! !# !# # ! # " ! # # # " # #! " ! ! ! # "# ! # ! # ### ! # ! # "# # ! ## # ! # ## # !! # # #! ! # # ! # # ## # !# # " # # # ! ! # # !# # # # ! # # ! # # ! # # # # ! ! # ! # # # ! # !### # ! # ! ## ! # # # !# "# # ! " # ! # # # # # ! # ! # # # # ! # ### # ## ## # # ## " # # # # # ! # # ! # # # ## # # " " ! # ### # # # " # # ## # # ! # # # # ! " # # # # ## # # " " # # # "# # " ! # !# ## !## # # # # " " # " # # "# # " " ! " ## # ## # # # # # " " # # " # ## # " # # # " # " # " # # ## " # " # " " " # " "# # # " " " " # " " # " " "# # # " " # # " # " " # # "" # # " # ! " # " # " " #" # " # # " #
" #
#
# # # ! # ! " # " # "
" "
#
Railterminals
!
Inland shipping
"
Seaports
Figure 7: Map of locations with intermodal terminals (rail, inland shipping, seaports)
In order to give an impression of its possibilities, the EIRF is presented by a few screenshots. The tool starts with selecting a country and place of origin, followed by inserting a country and place of destination (see next figure). By default the maximum transit time is set at 7 days, but it can be adjusted in order to opt for a wider or narrower scope.
TR16361r04 BE LOGIC_final_report_en_v04_publishable.doc
page 20 of 33
Figure 8: Screen shot EIRF “input screen”
By choosing the preview results button the query will run and the output will list the possible connections within the maximum transit time slot requested.
TR16361r04 BE LOGIC_final_report_en_v04_publishable.doc
page 21 of 33
Figure 9: Screen shot EIRF “output screen”
Furthermore, the terminal operator and terminal name are hyperlinked, consequently tapping this hyperlink will lead one to the terminal operator’s website as well as terminal contact details. Conclusions and recommendations
Since the European Intermodal Route Finder (EIRF) has gone live through the BE LOGIC website, the tool has been tested and demonstrated. Users have provided feedback, which in general is that the tool is very useful with a high user-friendliness. Of course there is room for further improvements. In summary, the most important recommendations on further improvements regarding the usefulness of the tool are:
Users should be able to select all terminals within a certain distance, e.g. 100 kilometres of own address; Users should be able to select terminals from an interactive map; Users should be able to select all relations to a certain region (i.e. Ruhr Area); Users should be able to select a destination only (i.e. Bucharest) and then preview all terminals which provide services to that destination;
TR16361r04 BE LOGIC_final_report_en_v04_publishable.doc
page 22 of 33
Users should be able to select direct relations only; Currently the contact details of the terminal operator are provided through the tool. However contact details of the transport operators (shuttle operator, barge operator, short sea operator) are more important, as these operators have the information on the transport operations (time tables, frequencies). Users would like to see a route planner for road transport linked to the EIRF, in order to add pre- and end-haulage to the chain.
Although the tool is considered to be very complete, considering the scope of EU27, Norway and Switzerland, and it comprises sea, rail and inland shipping terminals, it is still not complete. Some users have provided information on similar tools (i.e. www.containerzug.de, www.railcontainer.be). Although the scope of these tools is much narrower (in terms of countries, modes of transport, relations), it is highly recommended to compare the connections of the EIRF with those of similar tools. How to keep the information accurate?
The main question is: How to keep the information as accurate as possible? The information which is currently available in the EIRF has been collected by the BE LOGIC partners. This method of searching for terminal information (i.e. through terminals’ websites, direct contacts with terminal operators, journals with time tables) is rather time consuming. If the terminal information (i.e. services, transport times, frequencies) is not updated on a very regular basis, preferably daily, users might get frustrated if the information proofs to be outdated when using the tool. The labour-intensive approach applied by the BE LOGIC project cannot be performed on a very regular basis. Alternatively, regular updates on terminal route time tables could be submitted by the terminal and/or shuttle operators themselves. For this an electronic form has to be developed which can be completed and uploaded to the online terminal database by terminal and/or shuttle operators. Forms developed in the BE LOGIC project (MS Access) might be the starting point. Finally, a business plan for the continuation of the EIRF and the Logistics Benchmarking tool has to be developed, in order to keep the tool ‘alive’ as soon as the projects have come to an end. Options for funding (i.e. one could think of raising money through presenting commercial banners, company logo’s on the website, or raise money through ‘pay per use’ principle, subscription, etcetera) and pro’s and con’s of each option need to be analysed first. Finally, one option or a combination of options can be implemented. The tools also need a host website and entity that is responsible at the operational level (i.e. reply to FAQs).
TR16361r04 BE LOGIC_final_report_en_v04_publishable.doc
page 23 of 33
TR16361r04 BE LOGIC_final_report_en_v04_publishable.doc
page 24 of 33
5
Analysis of logistics quality standards
5.1
Process
The scope of work under Analysis of logistics quality standards has the following two ‘main objectives’: 1. Examine existing quality standards (e.g. ISO, CEN) for transport logistics; 2. Consider the need for new quality standards for transport logistics. The methodological approach to achieve these objectives consisted of the following steps:
Collecting and analysing existing standards for logistics quality. Classifying existing standards. Identifying strengths and weaknesses of existing standards. Reviewing market take up and standards acceptance by customers and operators. Consult with industry actors and stakeholders in order to develop one or more quality Standards to which the logistics industry and their customers can aspire.
To achieve the second objective of examining the need for new quality standards for transport logistics, a two round online Delphi study and expert stakeholder workshop were employed. 5.2
Results
The study identified and analysed existing EU wide standards in transport logistics quality from CEN and also identified national initiatives. The research shows:
these standards are known to few users amongst an expert panel and a focus workshop; as such we can conclude that a key weakness is their lack of dissemination; the lack of transparency at CEN does not help; that ISO9001 and ISO140001 are capable of managing quality and are used as such; ISO 28000 standards re supply chain risk appear to be emerging as equal to the former to form a virtuous trinity; that quality is not purely derived from standards, more from customer-client relationships, and even more so from culture and process.
The BestLog project suggested ‘Logistics Certification Programmes’ on (commonly agreed) good logistics performance standards. The project identified a total 52 certificates in this regard and BE LOGIC identified more. Whilst most of the certificates/labels are country specific for example DIN (Germany), UNE (Spanish), ONORM (Austria) there is the emergence of international and European certificates for specific sectors (such as rail freight or chemicals, or urban freight). BestLog also noted that the certificates themselves are mostly granted by licensed companies or associations, companies often alter official certificates to customize them to special sectors or fields, many national certificates have been adapted to the European certificates and many certificates affect logistics indirectly.
TR16361r04 BE LOGIC_final_report_en_v04_publishable.doc
page 25 of 33
This may make the task of researchers and policy makers less clear but it does perhaps represent the vibrant nature of transport logistics which whilst circa 10-15% in all developed economies, is a derived demand from manufacturing and retail. Our research and that of BestLog suggest a decentralised, open market approach to logistics quality that is sector and region driven, rather than a 'one size fits all' approach. The validation workshop reported that the Delphi study methodology has successfully explored the logistics quality issues. The findings of the study represent a high level of research outputs. Fair and free competition is a prerequisite for quality, but total deregulation not wanted. Existing logistics quality standards are hardly known (similar findings of Delphi study) and thus require efforts to make them known to the users. The ISO 9001 & ISO 14001 are widely known and used by the service providers and users. But these ISO standards are process oriented. They do not include some important aspects such as the quality definition, meeting stated service criteria. SQAS is a standard imposed by the industry themselves, which covers most elements of the supply chain. Quality is better determined by a contract between customer and provider, not the whole supply chain and KPIs are essential for such contracts. Our research shows that: Direct state intervention for a new or modified standard is not wanted; but a totally free market is not seen as a quality-improving framework; Government has an important role to ensure fair and free competition that is a prerequisite for quality standard; where it is not present or distorted intervention may be appropriate; The internalisation of externalities is seen as a part of the basic state role in the market; Quality is better determined by a contract between customer and provider, not for the whole supply chain; A flexible quality code, where the users can define (with KPIs) their requirements, could be a solution for the future.
At all stages: desktop research and interviews with experts, two rounds of Delphi study, and validation workshop, the experts consulted were divided on the final issue: whether or not a new or modified standard is needed, however no clear pressing need for one emerged. Given that the CEN process is clearly intended to respond to market/industry demand, that BestLog recorded many active and disparate initiatives tailored to local and sectoral needs, and our expert panel knew of and did not express any demand we conclude that there is no market demand for new standards and this is an area where subsidiarity is appropriate and functional. The results are non radical, they adopt a mixed market liberal economic view that looks for basic levels of state intervention, based on security and environmental issues. The most radical viewpoint is that the internalisation of externalities is a key part of the state's role, which in the transport policy community is not a new concept. The vision is not that different from the EU we know today. 5.3
Recommendations
The research leads us to recommend: That where a relatively free market exists and there isn’t excessive dominance by any party or sector over another, that quality is handled best through: Mutual agreement between parties on a contract by contract basis; The use of ISO9001 to develop, monitor and improve quality processes;
TR16361r04 BE LOGIC_final_report_en_v04_publishable.doc
page 26 of 33
The use of ISO140001 to develop, monitor and improve quality processes; Facilitation of quality cultures within logistics training and continuous professional development; Support for the development of industry specific standards where appropriate, e.g. SQAS; Initiatives to disseminate the existing CEN standards on logistics and supply chains.
Where there is an imbalanced market: Intervention to support the development of template quality codes to support the balancing of customer and supplier in sectors where there is a significant distortion or imbalance, e.g. provision of infrastructure or oligopolistic sectors such as rail freight. There is no current industry demand for new standards, the ones that exist are not widely known, and a functional trinity of ISO9001, ISO140001 and ISO28000 exists. Therefore we see no need for a new or modified standard. Recommendations for governments
The authorities have a specific role to establish a common and level playing field for all transport modes in order to really improve the entire logistic supply chain as it uses several transport modes. Road transport has clear advantages in short-distance haul compared to other land transport modes, especially the railway transportation. Intermodal transport options can be competitive with ‘only road transport’ option if a fair playing field (considering externalities, safety, security, infrastructure charge.) is created by the authorities. The state has a role to: Define minimum levels for security and environmental issues including the internalisation of externalities; Facilitating quality projects and educating SMEs in how to draft/demand a suitable quality contract; Support infrastructure development; Continue to support the standardisation and improvement of eFreight to enhance information flows in the supply chain; The existence of all labels and standards identified by BestLog and BE LOGIC be actively disseminated in future best practice initiatives such as BESTFACT (starting April 2011). Recommendations for users and providers
The logistics service providers and also shippers (or their associations) should play a central role in developing and improving logistic quality standards. In this regards some industry-led initiatives (e.g. Freight Transport Association –FTA, UK on ‘Building transparency into supply chains service performance indicators2, and European Chemical Transport Association’s Best Practice Guidelines and Guidelines3) can be noted here. We recommend that this kind of initiatives and approach towards logistics quality standards can be applied. Users and supplier of logistics services should ensure that: Quality labels and indicators (e.g. carbon footprints) lead to behavioural change, they have to be renewed and audited - the company to constantly monitor their processes; KPIs are critical to contracts and yet trust and intangibles is a key part of the quality process;
2 3
http://www.fta.co.uk/export/sites/fta/_galleries/downloads/sea_freight/service_performance.pdf http://www.ecta.be/public/content/publications/guidelines/
TR16361r04 BE LOGIC_final_report_en_v04_publishable.doc
page 27 of 33
A flexible quality code, where the users can define their wishes for example using KPIs, could be a solution for the future by the market not by government. But the Delphi panel as well as the workshop panel were divided on some other important issues. For example, they could not decide whether or not we need a new or modified standard for transport logistics quality. The logistics quality standards should be developed and set by the market with the voluntary participation from the industry. The study suggests that the government intervention is not welcome. But the government can play an important role by funding a project to explore such issues or infrastructure development so that the companies can compete in a free and fair market place. The study has identified some important KPIs for a logistics quality contract. The role of shippers is vital to improve the overall quality of logistics supply chain. For this, they should choose some Key Performance Indicators (KPIs) and set the adequate levels (depending on the type of goods and level of service they need). They should have decided which quality labels or certificates suit their industry sector, region, and culture and utilise them for procurement and supplier development. Where a specific standard is required over and above an existing one, then local variations can be developed from existing ones.
TR16361r04 BE LOGIC_final_report_en_v04_publishable.doc
page 28 of 33
6
Impacts and dissemination
6.1
Potential impacts Better use of intermodal transport
The European Intermodal Route Finder which has been developed in BE LOGIC enables users to search for intermodal alternatives between approximately 650 intermodal terminals in 29 European countries (EU27, plus Norway and Switzerland). More specifically the tool provides the user with information on transport time and frequencies offered at more than 4,000 direct intermodal transport relations and approximately 70,000 indirect relations (including one transhipment terminal). Although similar tools exist, the geographical scope and coverage of the EIRF is much larger, and therefore has improved the visibility of comodal solutions significantly. This potentially leads to better use of intermodal transport opportunities, which has a positive impact on the goals set in the White Paper4: 30% of road freight over 300 kilometres should shift to other modes such as rail or waterborne transport by 2030, and more than 50% by 2050. Better decision making on modal choice
Both in small and larger companies the comparison of transport options is often a process that takes place in the decision makers’ mind, rather than being explicitly evaluated by applying a tool. The Logistics Benchmarking Tool offers a structured comparison between road-only and co-modal alternatives. More specifically the way the Logistics Benchmarking Tool presents the results visually is perceived as an added value when communicating the pros and cons of alternatives. Overall this leads to better decision making on modal choice. More sustainable transport
Both the European Intermodal Route Finder and the Logistics Benchmarking Tool increase the visibility of intermodal alternatives, including their performance compared to road-only options. Users of both tools might reconsider their current transport operations from time to time, opting for more sustainable transport solutions. Further, the Logistics Benchmarking Tool is developed in a way that it easily compares transport alternatives on a corridor level. As the environmental performance (emissions) is explicitly part of this comparison, is can contribute to support and facilitate the concept of Green Freight Corridors. 6.2
Main dissemination activities
The dissemination of activities performed and results achieved represents one of the most important phases in a research project, raising awareness towards any potentially interested party and to ensure that the final outcomes of the project are properly exploited. A number of dedicated tools and activities has been realized or organized, in order to guarantee that the most relevant project outcomes are communicated to the widest audience possible, in the most effective way: project website, brochure, newsletters, presentations at national and international conferences, work shops and a final conference. The main dissemination activities are described hereafter in more detail. 4
White Paper, Roadmap to a Single European Transport Area – Towards a competitive and resource efficient transport system, Brussels, 28 March 2011.
TR16361r04 BE LOGIC_final_report_en_v04_publishable.doc
page 29 of 33
Project public website and project logo
The project website is: www.be-logic.info
Figure 10: Screen shot of project website “home”
TR16361r04 BE LOGIC_final_report_en_v04_publishable.doc
page 30 of 33
Workshops
A first workshop has been held on October 1st, 2009 in Vienna (Austria), with the participation of 10 international experts from the transport and logistics sector, including shippers, terminal operators and policy experts. The objective of the workshop has been to present the activities undertaken during the first year of BE LOGIC along with the preliminary results achieved, in order to gather the experts’ opinion and obtain suggestions concerning the organization of future BE LOGIC activities. In particular the benchmarking methodology has been presented and discussed. The participants showed a strong interest in the objectives of BE LOGIC and in the activities and results presented during the meeting. Several suggestions have been proposed, with particular reference to the Logistics Benchmarking Tool: according to the experts, this tool would have been considered more useful if it could offer to the user the possibility of defining the potential alternatives to be benchmarked, rather than making comparisons with similar cases stored in a database linked with the tool. The Logistics Benchmarking Tool development plan has been modified accordingly with the inputs received. A second Workshop has been held on October 29th, 2010 in Paris, with the participation of 15 international experts from the transport and logistics sector. The Workshop aimed at providing an update on existing quality standards, improving quality in the supply chain and what is needed by the sector. The Delphi study conducted in the scope of the project has been assessed as a high level experience. Existing quality standards seems to be hardly known by market players, with the exception of ISO 9001 which is commonly used and known. According to participants, quality is better determined by a contract between customer and provider, rather than by the whole supply chain. A flexible quality code, where the user can define his wishes, could be a solution for the future. Face to Face meetings
Through the validation of the Logistics Benchmarking Tool and the EIRF, the partners in BE LOGIC have had face-to-face meetings with approximately 100 logistics companies and branch organisations across Europe. This was a perfect way to communicate the project objectives and results to the sector. Final conference
The project Final Conference has been held on February 16th and 17th 2011 in Rotterdam (The Netherlands), with the participation of more than 80 relevant stakeholders from the transport and logistics sectors. The Final Conference has been organized around the demonstration and presentation of the Logistics Benchmarking Tool and the European Intermodal Route Finder. Furthermore, presentations of intermodal practices by some European leading logistics companies and lessons learnt have been included into the conference programme. The list of external speakers which contributed with a presentation and participated into the final debate:
Mr. Pawel Stelmaszczyk - European Commission – DG MOVE Mr. Michiel van Veen -Flora Holland Mr. Thijs van den Heuvel - Binnenlandse Container Terminals Nederland Mr. Sergio Barbarino - Procter and Gamble Mr. Jan Tore Pedersen - E-Freight project Mr. Heiko Krebs - Kombiverkehr
TR16361r04 BE LOGIC_final_report_en_v04_publishable.doc
page 31 of 33
Figure 11: Panel participating in the debate at the BE LOGIC Final Conference
TR16361r04 BE LOGIC_final_report_en_v04_publishable.doc
page 32 of 33
The contact details of the co-ordinator and project logo
Jeroen Bozuwa ECORYS Transport & Mobility Watermanweg 44 3006 AD Rotterdam The Netherlands T: +31 10 4538751 F: +31 10 4523680 E:
[email protected] The contact details of the other beneficiaries Beneficiary name
Beneficiary short name
Country
Contact person
Email
Institute of Shipping Economics
ISL
Germany
Holger Kramer
[email protected]
D’Appolonia
DAPP
Italy
NewRail – University of Newcastle
UNEW
United
and Logistics
Valerio Recagno
[email protected]
Tom Zunder
[email protected]
Ronald Jorna
[email protected] [email protected]
Kingdom Mobycon
MOBYCON
The Netherlands
Athens University of Economics
AUEB-RC
Greece
Kostantinos Zografos
Herry Consult GmbH
HERRY
Austria
Norbert Sedlacek
Vilnius Technical University –
VGTU
Lithuania
and Business – Research Center / TRANSLOG
Competence Centre of Intermodal Transport and Logistics (VGTU) International Union of combined
UIRR
Belgium
[email protected]
Vladas Sturys
[email protected]
Algirdas Sakalys
[email protected]
Eric Feyen
[email protected]
road-rail transport companies
TR16361r04 BE LOGIC_final_report_en_v04_publishable.doc
page 33 of 33