PROGRESS IN PERITONEAL DIALYSIS Edited by Raymond Krediet
Progress in Peritoneal Dialysis Edited by Raymond Krediet
Published by InTech Janeza Trdine 9, 51000 Rijeka, Croatia Copyright © 2011 InTech All chapters are Open Access distributed under the Creative Commons Attribution 3.0 license, which permits to copy, distribute, transmit, and adapt the work in any medium, so long as the original work is properly cited. After this work has been published by InTech, authors have the right to republish it, in whole or part, in any publication of which they are the author, and to make other personal use of the work. Any republication, referencing or personal use of the work must explicitly identify the original source. As for readers, this license allows users to download, copy and build upon published chapters even for commercial purposes, as long as the author and publisher are properly credited, which ensures maximum dissemination and a wider impact of our publications. Notice Statements and opinions expressed in the chapters are these of the individual contributors and not necessarily those of the editors or publisher. No responsibility is accepted for the accuracy of information contained in the published chapters. The publisher assumes no responsibility for any damage or injury to persons or property arising out of the use of any materials, instructions, methods or ideas contained in the book. Publishing Process Manager Niksa Mandic Technical Editor Teodora Smiljanic Cover Designer Jan Hyrat Image Copyright beerkoff, 2010. Used under license from Shutterstock.com First published October, 2011 Printed in Croatia A free online edition of this book is available at www.intechopen.com Additional hard copies can be obtained from
[email protected]
Progress in Peritoneal Dialysis, Edited by Raymond Krediet p. cm. ISBN 978-953-307-390-3
free online editions of InTech Books and Journals can be found at www.intechopen.com
Contents Preface IX Chapter 1
Representations of Peritoneal Tissue – Mathematical Models in Peritoneal Dialysis Magda Galach, Andrzej Werynski, Bengt Lindholm and Jacek Waniewski
1
Chapter 2
Distributed Models of Peritoneal Transport 23 Joanna Stachowska-Pietka and Jacek Waniewski
Chapter 3
Membrane Biology During Peritoneal Dialysis Kar Neng Lai and Joseph C.K. Leung
Chapter 4
Angiogenic Activity of the Peritoneal Mesothelium: Implications for Peritoneal Dialysis 61 Janusz Witowski and Achim Jörres
Chapter 5
Matrix Metalloproteinases Cause Peritoneal Injury in Peritoneal Dialysis 75 Ichiro Hirahara, Tetsu Akimoto, Yoshiyuki Morishita, Makoto Inoue, Osamu Saito, Shigeaki Muto and Eiji Kusano
Chapter 6
Proteomics in Peritoneal Dialysis 87 Hsien-Yi Wang, Hsin-Yi Wu and Shih-Bin Su
Chapter 7
Peritoneal Dialysate Effluent During Peritonitis Induces Human Cardiomyocyte Apoptosis and Express Matrix Metalloproteinases-9 99 Ching-Yuang Lin and Chia-Ying Lee
Chapter 8
A Renal Policy and Financing Framework to Understand Which Factors Favour Home Treatments Such as Peritoneal Dialysis 115 Suzanne Laplante and Peter Vanovertveld
Chapter 9
Nutritional Considerations in Indian Patients on PD 133 Aditi Nayak, Akash Nayak, Mayoor Prabhu and K S Nayak
49
VI
Contents
Chapter 10
Hyponatremia and Hypokalemia in Peritoneal Dialysis Patients 145 Sejoong Kim
Chapter 11
Encapsulating Peritoneal Sclerosis in Incident PD Patients in Scotland Robert Mactier and Michaela Brown
Chapter 12
157
Biocompatible Solutions for Peritoneal Dialysis 167 Alberto Ortiz, Beatriz Santamaria and Jesús Montenegro
Preface Continuous peritoneal dialysis was first introduced by Popovich and Moncrief in 1976. It gained popularity as a form of home dialysis in the eighties in Canada, USA, Western Europe and Hong-Kong. Since the nineties Eastern Europe followed and from 2000 onward the main growth was in the so-called third-world countries. As a consequence, the level at which peritoneal is practiced differs very much amongst countries. This translates into research that is focused either on in-vitro studies, some studies in animals, mathematics and, most-importantly, clinical studies in patients. This makes the scope of interest in peritoneal dialysis related studies very wide. The aim of the present publication was not to create a comprehensive reference book on all aspects of peritoneal dialysis with invited authors, recognized as authorities in part of the field. Rather, the objective was to make a collection of various actual subjects, highlighted by authors from all over the world, who had shown their interest in a specific item by submitting an abstract. These abstracts were reviewed and chosen based on the quality of their contents. The chapters which emerged reflect the worldwide progress in peritoneal dialysis during the last years. Five of the twelve chapters comprise clinical issues, two are on kinetic modelling, and the others show the results of the mainly in-vitro studies of the authors and their collaborators. Consequently the interested reader is likely to find state-of the art essays on the subject of his/her interest. I hope this book on Progression in peritoneal dialysis will contribute to spreading the knowledge in this interesting, but underused modality of renal replacement therapy.
Raymond T Krediet, MD, PhD Emeritus Professor of Nephrology Academic Medical Center, University of Amsterdam, The Netherlands
1 Representations of Peritoneal Tissue – Mathematical Models in Peritoneal Dialysis Magda Galach1, Andrzej Werynski1, Bengt Lindholm2 and Jacek Waniewski1
1Institute
of Biocybernetics and Biomedical Engineering, Polish Academy of Sciences, Warsaw 2Divisions of Baxter Novum and Renal Medicine, Department of Clinical Science, Intervention and Technology, Karolinska Institutet, Stockholm 1Poland 2Sweden 1. Introduction During peritoneal dialysis solutes and water are transported across the peritoneum, a thin “membrane” lining the abdominal and pelvic cavities. Dialysis fluid containing an “osmotic agent”, usually glucose, is infused into the peritoneal space, and solutes and water pass from the blood into the dialysate (and vice versa). The complex physiological mechanisms of fluid and solute transport between blood and peritoneal dialysate are of crucial importance for the efficiency of this treatment (Flessner, 1991; Lysaght &Farrell, 1989). The major transport barrier is the capillary endothelium, which contains various types of pores. Capillaries are distributed in the tissue. Across the capillary walls, mainly diffusive transport of small solutes between blood and dialysate occurs. As the osmotic agent creates a high osmotic pressure in the dialysis fluid - exceeding substantially the osmotic pressure of blood - water is transported by osmosis from blood to dialysate and removed from the patient with spent dialysis fluid. At the same time the difference in hydrostatic pressures between dialysate (high hydrostatic pressure) and peritoneal tissue interstitium (lower hydrostatic pressure) causes water to be transported from dialysate to blood. In addition, there is a continuous lymphatic transport from dialysate and peritoneal tissue interstitium to blood. In this chapter a brief characteristic of the two most popular simple models describing transport of fluid and solutes between dialysate and blood during peritoneal dialysis is presented with the focus on their application and techniques for estimation of parameters which may be used to analyze clinically available data on peritoneal transport.
2. Membrane representation of transport barrier This rather complicated transport system of water and solutes can be described with sufficient accuracy for practical purposes with a simple, membrane model based on thermodynamic principles of fluid and solutes transport across an “apparent”
2
Progress in Peritoneal Dialysis
semipermeable membrane that represents various transport barriers in the tissue (Kedem &Katchalsky, 1958; Lysaght &Farrell, 1989; Waniewski et al., 1992; Waniewski, 1999). In this model no specific structure of the membrane is assumed (the “black box” approach). The membrane model allows an accurate description of diffusive and convective transport of solutes and osmotic transport of water between blood and dialysate, but it must be supplemented by fluid and solute absorption from dialysate to blood. 2.1 Estimation of fluid absorption rate from dialysate to peritoneal tissue and determination of dialysate volume during dialysis Transport of fluid from blood to dialysate (ultrafiltration) and from dialysate to peritoneal tissue (absorption) occurs at the same time. Estimation of fluid absorption can be done using a so-called “volume marker” - a substance added to the dialysate in low concentration (so that this addition does not influence the transport of other solutes) which might be distinguished from the solutes produced by the body (and transported to dialysis fluid), to calculate its disappearance from dialysis fluid (Waniewski et al., 1994). Two processes: convection and diffusion take part in the transport of the volume marker from dialysate. The convective transport consists of lymphatic transport and fluid absorption from peritoneal cavity caused by dialysate hydrostatic pressure which is higher than that of interstitium. Because of a high molecular weight of the volume marker, its diffusion is negligible and the determination of its elimination rate, KE, can serve as an estimation of fluid absorption rate from dialysate to peritoneal tissue, QA. However, it should be remembered that even small diffusion of a marker creates an error in determination of KE (and QA). Therefore substantial decrease of marker’s diffusive transport is of great importance and can be achieved by selection of macromolecular solutes, as the diffusive transport decreases with increasing molecular weight. For this reason only high molecular weight protein (albumin and hemoglobin) and dextrans of molecular weight from 70000 to 2 millions have been applied as a volume markers (De Paepe et al., 1988; Krediet et al., 1991; Waniewski et al., 1994). KE (and consequently QA) can be calculated using a simple, one compartment mathematical model representing dialysate of variable volume VD caused by fluid transport from and to the peritoneal cavity. The applied model is based on the assumption that the rate of decrease of volume marker mass in the peritoneal cavity is proportional to the volume marker concentration in the intraperitoneal dialysis fluid. Applying the mass balance equation one gets (Waniewski et al., 1994): dM z K EC z , dt
(1)
where M z is mass and C z concentration of the volume marker. After integration, Eqn (1) can be presented in the following form: M z (t0 ) M z (t end ) K E
tend
C (t )dt K z
E
(t end t0 )C z (t end ),
(2)
t0
where t0 and tend denoted the time of the beginning and the end of a peritoneal dialysis dwell, respectively (therefore tend t0 is the time of dialysis) and C z (t end ) is an average concentration of volume marker in dialysate during the session, which can be calculated
3
Representations of Peritoneal Tissue – Mathematical Models in Peritoneal Dialysis
using frequent measurements of volume marker concentration in dialysate. Measurements should be done more frequently at the beginning of dialysis when concentration changes of the volume marker are more rapid. Mass of volume marker at the beginning of dialysis, M z (t0 ) , is equal to the mass in the fresh dialysis fluid in the peritoneal cavity, whereas mass at the end of dialysis, M z (tend ) , can be calculated knowing dialysate volume and marker concentration at the end of dialysis. It must be also remembered that dialysate volume at the end of dialysis is a sum of the volume removed and the residual volume remaining in the peritoneal cavity, which may be calculated using a short (5 min) rinse dwell just after the end of the dialysis session: VresC zbefore Vres Vrinse C zafter ,
(3)
where Vres is the sought residual volume, Vrins is the rinse volume, C zbefore is the concentration of the marker before the rinse and C zafter is the marker concentration after the rinse. Therefore: Vres VrinseC zafter C zbefore C zafter ,
(4)
Thus, as the other terms in this equation are known, KE can be calculated from Eqn (2) as follows:
K E C z (t0 )VD (t0 ) C z (t end ) VD (t end ) Vres (tend t0 )C z (t end ) .
(5)
2200
3500 3000
2000 2500
Volume [ml]
Marker concentration [counts/min]
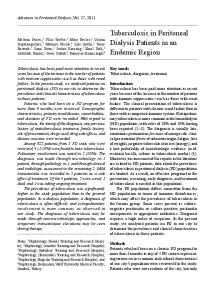
Thereafter, knowing KE and having data concerning marker concentration changes during the session (measured as a radioactivity), using Eqn (2) written not for duration of dialysis, tend , but for a selected time during dialysis, t, dialysate volume during dialysis can be calculated. Expressing the mass of volume marker, M z (t ) , as the product of dialysate volume, VD (t ) , and marker concentration C z (t ) one gets (Figure 1):
1800
1600
2000 1500 1000
1400 500 1200
0
50
100
150
200
250
Time [min]
300
350
400
0 0
50
100
150
200
250
300
350
Time [min]
Fig. 1. Marker dialysate concentration during peritoneal dialysis dwell (left panel) and comparison of volumes calculated from marker concentration using Eqn (6) (right panel): dialysate volume (solid line), apparent volume calculated without the correction for the absorption of marker (dashed line) and absorbed volume (KE = 2.29, dotted line).
400
4
Progress in Peritoneal Dialysis
M z (t 0 ) C z (t )
VD (t )
APPARENT VOLUME
C z (t end ) K Et . C z (t )
(6)
ABSORPTION
It is worth noting that the first part of the right hand side of Eqn (6) is the formula for calculation of dialysate volume using dilution of the volume marker without marker absorption taken into account. The second part is the correction for marker absorption (Figure 2). 2.2 Description of fluid transport in peritoneal dialysis For low molecular weight osmotic agents, as glucose or amino acids, the value of osmotically induced ultrafiltration flow, QU, is proportional to the difference of osmotic pressure between dialysate and blood, D B (Waniewski et al., 1996b). The coefficient of proportionality, aos , is called osmotic conductance. The mass balance equation for fluid is then as follows (Chen et al., 1991): dVD QV QU QA aos ( D B ) QA . dt
(7)
where: QV is the net rate of peritoneal dialysate volume change, QU is the rate of ultrafiltration flow ( QU aos (Π D Π B ) ) and QA is the fluid absorption rate.
3000
3000
2800
2800
Dialysate volume [ml]
Dialysate volume [ml]
Since VD and QA (with the assumption that QA K E ) can be estimated from Eqns (2) and (6), whereas D and B can be measured, thus Eqn (7) can be used for determination of osmotic conductance (Figure 2, left panel). Note however, that QA K E is only a simplified assumption. Thus if both parameters (aos as well as QA) are fitted, then the fitted QA value may not have a value comparable to KE (Figure 2, right panel). All clinical data shown in this chapter are from Karolinska Institutet, Stockholm, Sweden.
2600
2400
2200
2000
0
50
100
150
200
250
Time [min]
300
350
400
2600
2400
2200
2000 0
50
100
150
200
250
300
350
400
Time [min]
Fig. 2. Dialysate volume (x) calculated from marker concentration using Eqn (6) and osmotic model (solid line) with one fitted parameter and assumption QA K E (left panel, aos = 0.105, KE = 1.93), and with two fitted parameters (right panel, aos = 0.134, QA = 3.48).
Representations of Peritoneal Tissue – Mathematical Models in Peritoneal Dialysis
5
As shown in Figure 2, the osmotic model underestimates dialysate volume during the first phase of dialysis dwell. This is the result of the assumption that osmotic conductance is constant that generally is only a simplification (Stachowska-Pietka et al., 2010; Waniewski et al., 1996a). The fluid transport may be also described by a simple phenomenological formula proposed by Pyle et al. (Figure 3 shows example of patient with ultrafiltration failure defined as net ultrafiltration volume at 4 hour of the dwell less than 400 ml), and applied also by other investigators (Stelin &Rippe, 1990): QV (t ) ap e
k p ( t t0 )
bp ,
(8)
where t0 is the start time of the dialysis, and ap, bp and kp are the constants. 2700
Dialysate volume [ml]
2600 2500 2400 2300 2200 2100 2000 0
50
100
150
200
250
300
350
400
Time [min]
Fig. 3. Dialysate volume: clinical data (x) and Pyle model (solid line, ap = 19.6, kp = 0.022, bp = 2.5). 2.3 Transport of low molecular solutes in peritoneal dialysis Analysis of transport of low molecular weight solutes, such as urea, creatinine or glucose, from blood to dialysate (or in opposite direction) is of special importance in the evaluation of the quality of dialysis (Lysaght &Farrell, 1989; Waniewski et al., 1995). One of the methods used for assessment of the transport barrier between blood and dialysate is application of the so-called thermodynamic transport parameters. For the estimation of these parameters there is a need for frequent measurement of dialysate volume (i.e. volume marker concentration) during dialysis as well as concentrations of other solutes in the dialysate and blood, and then calculation of the rate of solutes mass change caused by their transport from blood to dialysate (or in opposite direction). Solute transport occurs in three ways: a) diffusion of solute caused by the differences in solute’s concentration in dialysate and blood; b) convective transport with fluid flow from blood to dialysate (ultrafiltration); c) convective transport with fluid absorbed from dialysate to the subperitoneal tissue and lymphatic vessels (absorption). In the description of these processes it is assumed that generation of solutes in the subperitoneal tissue and peritoneal cavity as well as the interaction between solutes are negligibly small. All of these transport components are governed by specific forces (often described as thermodynamic forces) the effects of which, measured as a rate of solute flow, depends not
6
Progress in Peritoneal Dialysis
only on the value of the force, but also on transport parameters characterizing the environment in which the solute transport occurs. Thus, the rate of diffusive solute transport is proportional to the difference of solute’s concentration between blood and dialysate, C B C D , with the rate coefficient KBD, called diffusive mass transport coefficient. The other two transport components are convective. The fluid flux, caused by the difference of osmotic pressures and the difference of hydrostatic pressures, carries solutes across the membrane characterized by its sieving coefficient. Sieving coefficient, S, determines the selectivity of this process: a sieving coefficient of 1 indicates an unrestricted solute transport while for S equal 0 there is no transport. Note also, that for a given membrane each solute has its specific sieving coefficient. Therefore, for the second transport component, the rate of convective flow is proportional to the rate of water flow (ultrafiltration), QU, to the average solute concentration in blood and dialysate CR, and to sieving coefficient S. For the membrane model of peritoneal tissue CR is expressed as follows: C R (1 F )C B FC D ,
(9)
where C B and C D are concentrations in blood plasma and dialysate, respectively, and F is: F
1 1 , Pe e Pe 1
(10)
where Pe is Peclet number which is the ratio of terms characterizing the convective and diffusive transport: Pe
SQU . K BD
(11)
In clinical investigations it has been demonstrated that for low molecular weight solutes it can be assumed that F 0.5 and for proteins F 1. The illustration of this estimation of F can be done using clinical data concerning the dwell study with 1.36% glucose solution published in (Olszowska et al., 2007). In this paper the values of KBD for small solutes were found to be between 8 ml/min (glucose) and 25 ml/min (urea) and S of 0.68. Using these data it is possible to calculate F, yielding the values between 0.46 (for KBD = 8 ml/min) and 0.65 (for KBD = 25 ml/min). For the third component, the rate of solutes absorption is proportional to the rate of fluid absorption rate, QA, and the solute concentration in dialysate. In this case the sieving coefficient is taken as equal to one. It is justified by experimental investigations in which no sieving effect (even for proteins) was demonstrated. The total solute flow between blood and dialysate is the sum of all the described components. Thus, using the thermodynamic description, the following mass balance equation can be written (Waniewski et al., 1995): dVDC D K BD (C B C D ) SQUC R Q AC D . dt
(12)
In this equation there are two transport coefficients: diffusive mass transport coefficient, KBD, and sieving coefficient, S, which characterize membrane properties of peritoneal tissue. All other variables in Eqn (12) can be measured or calculated from the measured values. In
7
Representations of Peritoneal Tissue – Mathematical Models in Peritoneal Dialysis
principle Eqn (12) can be used for estimation of S and KBD. For practical reasons (decrease of the impact of measurement errors on parameters estimation) it is better to use Eqn (12) in its integral form (Waniewski et al., 1995): VD (t )C D (t ) VD (t0 )C D (t0 ) K BD (C B C D )t SQUC R t QA C D t ,
(13)
where the bar above symbols denotes averaged values for the time period from t0 to t and t t t0 . The parameters KBD and S can be estimated from Eqn (13) using two dimensional linear regression. The theoretical curves for solute concentrations that can be obtained by this procedure are compared to the measured concentrations in dialysis fluid in Figure 4. GLUCOSE
220
SODIUM
135 Clinical data Fitted
200
134
Concentration [mmol/L]
Concentration [mmol/L]
180 160 140 120 100 80
133
132
131
130
60 129
40 20
0
50
100
150
200
250
300
350
Clinical data Fitted
128 0
400
50
100
150
Time [min]
200
250
300
350
400
Time [min]
UREA
30
Concentration [mmol/L]
25
20
15
10
5
0
Clinical data Fitted 0
50
100
150
200
250
300
350
400
Time [min]
Fig. 4. Solute concentrations during peritoneal dialysis: clinical data vs. fitting curve (Eqn (13)) for: glucose (KBD = 10.2 , S = -0.62), sodium (KBD = 11.6, S = 0.73) and urea (KBD = 14.0, S = 1.82) It must be remembered that there are following limitations for the values of estimated parameters: 0 K BD and 0 S 1 .
(14)
The estimated values of KBD are typically positive, but the limitations for S are often violated in experimental investigations (Waniewski et al., 1996d), as for the case depicted in Figure 4.
8
Progress in Peritoneal Dialysis
The reason for the problem with estimation of S is the assumption used in the estimation procedure that the transport parameters (KBD and S) are constant during the whole dwell time (Imholz et al., 1994; Krediet et al., 2000; Waniewski et al., 1996c). Additionally, in normal condition of peritoneal dialysis the convective transport is much smaller than the diffusive one. In experimental conditions this problem can be overcome by choosing the concentration of the investigated solute in dialysate close to that in blood. In this way the diffusive transport component is substantially decreased and is similar to the convective component. In these conditions application of two-dimensional linear regression results in estimation of KBD and S which are within the theoretical limits. The other advantages of this approach is the possibility of simplification of expression for convective transport in which the average value of substance concentration CR can be substituted with solute blood plasma concentration and in this way, the problem of estimation of F can be eliminated. 2.4 Parameter estimation: An example In the paper by Olszowska et al (Olszowska et al., 2007), data from a clinical study on dwells lasting 4 hours with glucose based (1.36%) and amino acids based (1.1%) solutions in 20 clinically stable patients on peritoneal dialysis are presented. With frequent sampling of dialysate, three samples of blood and with dialysate volume and fluid absorption rate obtained using macromolecular volume marker (RISA, radioiodinated serum albumin) it was possible to apply Eqn (13) and two-dimensional linear regression for estimation of diffusive mass transport coefficient, KBD, and sieving coefficient, S, for glucose, potassium, creatinine, urea and total protein. The results demonstrate slightly higher values of KBD obtained for dwells with amino acid solution as compared with glucose based solution (e.g. for glucose KBD = 8.3 ml/min, S = 0.62 vs. KBD 8.1 ml/min, S = 0.21 and for urea KBD = 28.2 ml/min, S = 0.48 vs. KBD 25.3 ml/min, S = 0.39). It seems that the amino acid based solution exerts a specific impact on peritoneal tissue which causes slight increases of diffusive and convective transport. It is worth to note that, for substances specified above, values of KBD and S, estimated using two-dimensional linear regression, were in acceptable range (KBD>0, 0S1). However, for amino acids themselves estimation of S failed and the estimation of KBD was performed with assumption that for these solutes S was 0.55 and therefore one-dimensional linear regression was applied. In this condition the estimated averaged values of KBD for essential amino acids was 10.320.51 ml/min and for nonessential amino acids was 10.61.33 ml/min. Similar results was also described in (Douma et al., 1996). In contrast to this assumption, the estimation of parameters performed for shorter periods of time demonstrated that estimated parameters have higher values at the beginning of the dwells than at the end (Waniewski, 2004), and it was proposed that the parameters values estimated for dwell time change with time as described by the function f (t ) 1 0.6875 e t /50 (t is time in minutes). A more detailed evaluation of this variability (vasoactive effect) can be found in (Imholz et al., 1994; Waniewski, 2004; Douma et al., 1996).
3. Pore representation of peritoneal transport barrier In the membrane model of the peritoneal barrier, no structure of this barrier is considered. It is simply assumed that blood and dialysate are separated by a semipermeable membrane and that the transport phenomena can be described using the thermodynamic theory of the transport processes. The pore model is more complex and derived from the field of capillary
9
Representations of Peritoneal Tissue – Mathematical Models in Peritoneal Dialysis
physiology. The basic idea of this model is the assumption that the capillary wall in the subperitoneal tissue is heteroporous and that the transport through the pores may be evaluated using the hydrodynamic theory of transport along a cylindrical pipe (Deen, 1987) which describes how much the solute and fluid transport is affected due to presence of the pores comparing to a uniform, semipermeable membrane. In 1987, Rippe et al proposed the so-called two-pore model to describe solute and fluid transport during peritoneal dialysis (Rippe &Haraldsson, 1987; Rippe &Stelin, 1989; Rippe et al., 1991b; Rippe &Haraldsson, 1994). According to this model, the membrane is heteroporous with two size of pores: large pores (radius 250 Å), and small pores (radius 43 Å). A large number of small pores makes the membrane permeable to most small solutes, whereas a very small number of large pores allows for the transport of macromolecules (proteins) from blood to peritoneal cavity. However, this model could not describe the phenomenon of sieving of small solutes, such as sodium, for which one observes a marked decline of dialysate concentration, reflecting a water-only (free of solutes) pathway. After discovery of the existence of aquaporins, the model was extended with a third type of pore, the ultrasmall pore, allowing an accurate description of the low sieving coefficients of small solutes (Figure 5). As it has been shown by Ni et al. (Ni et al., 2006) the ultrasmall pores are an analog of aquaporin-1 in endothelial cells of peritoneal capillaries and venules.
Fig. 5. Scheme of the three-pore model: J – flow of the fluid (subscript ‘v’) or solute (subscript ‘s’) through the pore (subscript ‘s’ – small pore, ‘l’ – large pore or ‘u’ – ultrasmall pore), L – lymphatic absorption from the peritoneal cavity, CB – blood concentration. CD – dialysate concentration, VD – dialysate volume. 3.1 Three-pore model According to the three-pore model (Figure 5), the change of the peritoneal volume (VD) depends on the sum of the fluid flows through the three types of pores ( JVpore , pore: u ultrasmall, s – small, l - large) and the peritoneal lymph flow, L, (Rippe &Levin, 2000). Thus (Rippe &Stelin, 1989; Rippe et al., 1991a; Rippe et al., 1991b; Rippe &Levin, 2000): dVD JVU JVS JVL L , dt
(15)
and JVpore is governed by the hydrostatic and osmotic pressures as follows (Rippe &Levin, 2000):
10
Progress in Peritoneal Dialysis
JVpore αporeLpS ΔP(VD ) σ solute , pore Δπ solute (t ) , solute
(16)
where: LpS is the membrane ultrafiltration coefficient, pore is the part of LpS accounted for the specific type of pore, P is the hydrostatic pressure difference between the blood capillaries and the peritoneal cavity (which depends on the fluid volume in the peritoneal V (t ) V0 cavity: P(VD ) P(V0 ) D , V0 is the initial dialysate volume, 490 is an empirical 490 coefficient, (Twardowski et al., 1983)), solute,pore is the solute osmotic reflection coefficient describing osmotic efficiency of the solute in the pore, and solute is the solute crystalloid osmotic pressure gradient ( Δπ solute (t ) RT[C solute , B C solute ,D ] , R – gas constant, T – absolute temperature, Csolute,B and Csolute,D - solute concentration in blood and dialysate, respectively). Solutes are transported only through the large and small pores and by the lymphatic flow, and therefore the solute mass change in the peritoneal cavity (Msolute,D) is described by the following mass balance equation (Rippe &Levin, 2000): dMsolute ,D dt
JSsolute ,S JSsolute ,L LC solute ,D .
(17)
where JSsolute ,pore - solute flow through the pore The solute flow, JSsolute ,pore , is by diffusion and convection, and is defined as: JSsolute ,pore PSsolute , pore (C solute ,D C solute , B ) J vpore (1 σ solute , pore )C solute , diffusion
(18)
convection
where: PSsolute,pore is a solute permeability surface area for the specific type of pore, C solute is the mean membrane solute concentration, C solute (1 Fsolute )C solute , B FC solute ,D , and Pe Fsolute 1 / Pesolute , pore 1 /( e solute ,pore 1) is a function of the ratio of convective to diffusive transport given by the Peclet number Pepore,solute (Rippe &Levin, 2000): Pesolute , pore JVpore
1 σ solute , pore PSsolute , pore
,
(19)
compare to Eqns (9)-(12). Note that 1 σ solute , pore is sieving coefficient for these particular pore and solute. In the previous approach based on the membrane model, there were two transport coefficients: diffusive mass transport coefficient (KBD) and sieving coefficient (S) which both characterize membrane properties of peritoneal tissue and can be estimated from clinical or experimental data. The analogues of these parameters in the three-pore model are, respectively, the permeability surface area coefficient (PSsolute,pore) and the solute’s osmotic reflection coefficient (solute,pore) which may be calculated using the following formulas (Rippe &Levin, 2000):
A A , PSsolute , pore Dsolute 0 x pore A0 solute , pore
(20)
Representations of Peritoneal Tissue – Mathematical Models in Peritoneal Dialysis
solute , pore 1
(1 )2 [2 (1 )2 ](1 / 3) , 1 / 3 2 / 3 2
11
(21)
where: Dsolute represents the free solute diffusion coefficient, A0 x is the unrestricted (nominal) pore area over unit diffusion distance, A/A0 is the restriction factor for diffusion defined as the ratio of the effective surface pore area over unrestricted (nominal) pore area, and = solute radius/pore radius. 3.2 Parameter estimation: Problems and pitfalls The three-pore model is more complicated than the membrane model and it is not possible to find analytical or integrated solutions and to estimate parameter values using linear regression. Therefore the model has to be solved numerically using a computer software with ODE (ordinary differential equation) solver (e.g. Matlab, Berkeley-Madonna or JSim) and with some parameter estimation techniques (Freida et al., 2007; Galach et al., 2009; Galach et al., 2010). For example, in Matlab the estimation of parameters may be done using function fminsearch (Nelder-Mead type simplex search method) with the aim to minimize the difference between numerical predictions and clinical data (usually, absolute difference or the squared difference). Therefore, the aim is to find the global minimum of the error function, and, thus, the values of parameters that describe the predicted curves as close to the clinical data as possible (Freida et al., 2007; Galach et al., 2009; Galach et al., 2010). It should however be noted that, with the increasing number of estimated parameters or decreasing number of data points, the chance that not global but local minimum is attained is growing (Juillet et al., 2009). The results are often strongly dependent on starting values of the fitted parameters (in particular on their difference from those that describe the global minimum (Juillet et al., 2009)), see an example in Section 3.3. To deal with these problems, one can lower the number of fitted parameters using the sensitivity analysis to find parameters with the highest influence on numerical results, and use not one but many initial sets of parameter values to check parameter space extensively, avoid local minima and hit the global minimum. Additionally, to avoid calculation problems when fitted parameters have different order of magnitude (i.e. in chosen set of parameters there are very small as well as large values), it is to be preferred to fit not the parameter itself but its multiplier:
Parfitted x Parinitial ,
(22)
where Parfitted is the sought value of the parameter, Parinitial is a basal value of the parameter and x is the fitted coefficient. Then all fitted coefficients (x) have a similar order of magnitude. Another important issue is an appropriate selection of parameters set, because it is often possible to obtain similar predictions with much different sets of fitted parameters (see an example in Section 3.3). Therefore, any final conclusions should be drawn with the utmost caution. 3.3 Parameter estimation: An example Clinical data of patients on six hour peritoneal dialysis dwell with glucose 3.86% solution (Karolinska Institutet, Stockholm, Sweden) were used to estimate the parameters of the three-pore model. More detailed description of the clinical data can be found in (Galach et al., 2010). The model was solved using ode45 solver of Matlab® v. R2010b software
12
Progress in Peritoneal Dialysis
(MathWorks Inc., USA) based on an explicit 4th and 5th order Runge-Kutta formula. The data of each patient separately were used as target values for estimation of the model parameters done using Matlab® function fminsearch (Nelder-Mead type simplex search method) with the aim to minimize the function fmin that described the sum of fractional absolute differences between theoretical predictions and clinical data scaled to the experimental values: sim |C exp (T ) C sim (T )| |C exp (Ti ) C Na |V exp (Ti ) VDsim (Ti )| , D (Ti )| f min D U , D iexp U , D i Na , D exp ... exp VD (Ti ) CU , D (Ti ) C Na , D (Ti ) i i i
|C exp (T ) C sim (T )| ... G , D iexp G , D i C G , D (Ti ) i
, (23)
where VD(Ti) is dialysate volume at time Ti, Cs,D(Ti) is dialysate solute concentration at time Ti (‘s’: ‘G’ – glucose, ‘Na’ - sodium), ‘exp’ stands for clinical data, and ‘sim’ stands for simulation results. The chosen fmin function depends, of course, on dialysate volume and on glucose, urea and sodium as a representative of small solutes: glucose is an osmotic agent, urea is a marker of uremia, and sodium is a solute for which the so-called “sodium dip” (indicating sodium sieving as water passes the ultra-small pores) is observed during the peritoneal dwell. The influence of the other substances is taken into account only through their impact on dialysate volume. Six parameters were estimated by fitting the three-pore model to clinical data: LpS (membrane UF-coefficient), L (peritoneal lymph flow), PS (permeability surface area coefficient) for glucose, sodium and urea and, alternatively, rsmall (small pore radius, Set 1), or small (the part of LpS accounted for the small pores, Eqn (16), Set 2), see Table 1. Other parameters were calculated from the estimated ones or their values were assumed based on previous investigations (Rippe &Levin, 2000), Table 1. The choice between two different sets Three-pore model parameters Set 1
Set 2 Fitted parameters
LpS, L, PSsmall,G, PSsmall,Na, PSsmall,U, rsmall
LpS, L, PSsmall,G, PSsmall,Na, PSsmall,U, small
Assumed parameters (Rippe &Levin, 2000)
ultrasmall small large, rlarge, rsolute
large, rsmall, rlarge, rsolute,, solute, small
Parameters calculated from the fitted values PSlarge,solute, in proportion to the fitted values for small pores, solute, small (dependent on rsmall)
PSlarge,solute in proportion to the fitted values for small pores, ultrasmall to achieve pore 1 pore
Table 1. Division of the three-pore model parameters according to the source of their values.
13
Representations of Peritoneal Tissue – Mathematical Models in Peritoneal Dialysis
of parameters that describe the three pore structure of the transport barrier used in estimation procedure is the choice between two different hypotheses about the variation of this structure among patients. The first hypothesis (Set 1) is based on the assumption that the radius of the small pore may vary from patient to patient but the fractional contribution of these pores to the hydraulic permeability, small, is the same in all patients. The other alternative with small varying between patients but the size of small pores being the same is investigated when Set 2 is selected. In general, both parameters may be expected to vary among patients, and, moreover, a similar variability may be considered for the remaining types of pores (large and ultrasmall). However, one cannot estimate all the parameters from the limited data and therefore, based on the previous experience with the model, the values of some of them need to be selected before the estimation procedure starts. The impact of the assumptions on the large pores on the simulations is less than those on the small pores. Thus, it was assumed that the radii of large and ultrasmall pores as well as the percentage input of large pores to the hydraulic permeability were constant. Note that the fraction of ultrasmall pores was related to the fraction of small and large pores by the condition that the sum of all coefficients should be one. It may happen that each single run of the fitting procedure (fminsearch function) for different starting parameter values yields different final sets of parameters and also different predictions for the simulated curves (Figure 6), which not necessarily are good approximations of the clinical data (Figure 6, right middle panel). It is also worth to mention that, usually, the fitting procedure is not sensitive to single data errors and may yield a smooth curve based on the other points (Figure 6, left panels). As in the previous studies (Galach et al., 2009; Waniewski et al., 2008), the results of the simulations and estimations show that the three-pore model with fitted parameters is capable of reproducing clinical data concerning peritoneal dialysis with glucose solution rather well (Figures 6-9), but the parameter values are substantially different for different patients (Tables 2-3).
Parameters
Initial 2 hour Set 1
Dwell 6 hour Set 1
Set 2
LpS
0.0610
0.0870
0.0890
L
0.1624
2.9127
3.7367
PSG
12.53
10.45
9.76
PSNa
9.77
15.21
12.78
PSU
23.05
31.83
31.37
rsmall
43.8
48.5
43.0 (not estimated)
small
0.90 (not estimated)
0.90 (not estimated)
0.9799
Table 2. Values of estimated parameter for patient No 1; Estimation procedure: data concerning initial 2 hours of the dwell and Set 1 of the estimated parameters (Table 1), data concerning the whole dwell and Set 1 of the estimated parameters, data concerning the whole dwell and Set 2 of the estimated parameters
14
Progress in Peritoneal Dialysis
145
Sodium concentration [mmol/L]
Ultrafiltration volume [ml]
700 600 500 400 300 200 100 0 0
20
40
60
80
100
140
135
130
125
120
120
0
20
40
Time [min]
Sodium concentration [mmol/L]
Ultrafiltration volume [ml]
600 500 400 300 200 100
20
40
60
Time [min]
80
100
120
135
130
125
0
20
40
20
40
60
80
100
120
60
80
100
120
Time [min]
145
Sodium concentration [mmol/L]
Ultrafiltration volume [ml]
100
140
120
120
700 600 500 400 300 200 100 0
80
145
700
0 0
60
Time [min]
0
20
40
60
Time [min]
80
100
120
140
135
130
125
120
0
Time [min]
Fig. 6. Ultrafiltration volume and sodium concentration during initial 2 hours of the session for the patient No 1 and following starting points (x values) in the fitting procedure (fminsearch): [0.95,0.74,1.10,1.14,1.35,1.52] (top), [1.24,2.48,0.59,2.27,2.33,2.09] (middle) and [0.71,1.03,1.18,1.86,0.78,1.95] (bottom).
15
600
600
500
500
Ultrafiltration volume [ml]
Ultrafiltration volume [ml]
Representations of Peritoneal Tissue – Mathematical Models in Peritoneal Dialysis
400 300 200 100 0
0
20
40
60
Time [min]
80
100
Sodium concentration [mmol/L]
Sodium concentration [mmol/L]
125
120
20
40
60
Time [min]
80
100
100
0
50
100
150
200
250
300
350
400
0
50
100
150
200
250
300
350
400
300
350
400
Time [min]
140 135 130 125 120 115
120
Time [min]
160
Glucose concentration [mmol/L]
160
Glucose concentration [mmol/L]
200
145
130
140
120
100
80
60
40 0
300
0
120
135
115 0
400
20
40
60
Time [min]
80
100
120
140 120 100 80 60 40
0
50
100
150
200
250
Time [min]
Fig. 7. Ultrafiltration volume, sodium concentration and glucose dialysate concentration during initial 2 hours of the session (left panel) and during the whole dwell (right panel) for the patient No 2 and for the same parameter values estimated from the initial 2 hours of the dwell; - simulation result, x - dialysate data, o - blood data.
16
700
700
600
600
Ultrafiltration volume [ml]
Ultrafiltration volume [ml]
Progress in Peritoneal Dialysis
500 400 300 200 100 0
0
20
40
60
80
100
500 400 300 200 100 0
120
0
50
100
Time [min]
Sodium concentration [mmol/L]
Sodium concentration [mmol/L]
250
300
350
400
300
350
400
300
350
400
145
140
135
130
125
120 0
20
40
60
80
100
140
135
130
125
120
120
0
50
100
Time [min]
150
200
250
Time [min]
200
Glucose concentration [mmol/L]
200
Glucose concentration [mmol/L]
200
Time [min]
145
180 160 140 120 100 80 60 40 20
150
0
20
40
60
Time [min]
80
100
120
180 160 140 120 100 80 60 40 20
0
50
100
150
200
250
Time [min]
Fig. 8. Ultrafiltration volume, sodium concentration and glucose dialysate concentration during initial 2 hours of the session (left panel) and during the whole peritoneal dialysis dwell (right panel) for the patient No 1 and Set 1 of the estimated parameters ( parameters from Table 2, column 1 and 2); - simulation result, x - dialysate data, o - blood data
17
400
400
300
300
Ultrafiltration volume [ml]
Ultrafiltration volume [ml]
Representations of Peritoneal Tissue – Mathematical Models in Peritoneal Dialysis
200 100 0 -100 -200 -300 0
50
100
150
200
250
300
350
200 100 0 -100 -200 -300
400
0
50
100
Time [min]
Sodium concentration [mmol/L]
Sodium concentration [mmol/L]
300
350
400
138 136 134 132
50
100
150
200
250
300
350
300
350
400
300
350
400
140 138 136 134 132 130 0
400
50
100
Time [min]
150
200
250
Time [min]
140
Glucose concentration [mmol/L]
140
Glucose concentration [mmol/L]
250
142
140
120 100 80 60 40 20 0 0
200
Time [min]
142
130 0
150
50
100
150
200
250
Time [min]
300
350
400
120 100 80 60 40 20 0
0
50
100
150
200
250
Time [min]
Fig. 9. Ultrafiltration volume, sodium and glucose concentration during 6 hour peritoneal dialysis dwell for the patient No 3 and Set 1 (left panel) or Set 2 (right panel) in fitting procedure; - simulation result, x - dialysate data, o - blood data.
18
Progress in Peritoneal Dialysis
The assumption that the parameter values are constant during the whole dwell is only a simplification (Imholz et al., 1994; Krediet et al., 2000; Stachowska-Pietka et al., 2010; Waniewski et al., 1996a, 1996d). The transport processes occurring during the first part of dialysis dwell are much more rapid than in the later part, and therefore the parameters estimated using data from the first part of the dwell only may not be correct for the whole dwell (Figure 6); thus, the values of parameters estimated from the partial data and the whole set of data may differ (Figures 7-8, Table 2). It is also worth noting that the selection of the assumptions, and consequently selection of the proper set of parameters for estimation procedure, is of high importance and has influence on all fitted parameters values and simulation results (Figure 9, Tables 2 and 3). The results of the simulations for different sets of estimated parameters may all give a good approximation of clinical data (Figure 9, results of the simulations for Set 1 and 2), however the fitted parameter values in these sets are different (Tables 3). But it may vary according to the patient. For example: for the patient No 1 the differences between fitted values of the parameters for Set 1 and 2 do not exceed 30% (Figure 8, Table 2), whereas for the patient No 3 the differences for 2 parameters were greater than 60% and for one parameter even than 100% (Figure 9, Table 3). Thus it is always very important to compare parameters fitted with the same assumptions or to discuss the differences in assumed hypotheses. Parameters
Dwell 6 hour Set 1
Set 2
LpS
0.0371
0.0862
L
2.5976
2.5026
PSG
16.8806
17.05821
PSNa
16.6024
27.5764
PSU
30.2129
24.1114
rsmall
26.7370
43 (not estimated)
small
0.9 (not estimated)
0.9799
Table 3. Values of estimated parameter for patient No 3 using data for whole dwell with two sets of the estimated parameters (Table 1).
4. Conclusions Peritoneal dialysis is an interesting and important area for mathematical modeling. In fact peritoneal dialysis treatment as we know it today is the result of kinetic modeling leading to the concept of continuous ambulatory peritoneal dialysis. The first mathematical models describing peritoneal dialysis were based on a simple idea of a semipermeable peritoneal barrier between blood and dialysate allowing solute and fluid transport characterized by the so-called transport parameters (Imholz et al., 1994; Krediet et al., 2000; Waniewski et al., 1995; Waniewski, 1999). Such models were – and still are - useful in evaluation of peritoneal dwell studies and their various versions have been widely applied especially for analysis of solute transport (Heimburger et al., 1992; Pannekeet et al., 1995; Smit et al., 2005; Waniewski et al., 1991, 1992). Despite the fact that they were used to demonstrate and interpret new
Representations of Peritoneal Tissue – Mathematical Models in Peritoneal Dialysis
19
transport phenomena, many questions concerning the mechanisms for the transport process could not be answered using this simple mathematical modeling because, although such models can be well fitted to the data and used to estimate transport parameters separately for fluid and each solute, however they cannot reliably predict the results of dialysis session and indicate the relationship between the parameters for different solutes and fluid. Therefore, another type of model, with additional and more physiological assumptions about the structure of the peritoneal membrane, was proposed (Rippe &Haraldsson, 1987; Rippe et al., 1991a; Rippe &Haraldsson, 1994). The pore model derived the description and relationships between the transport parameters from the solute size and the structure of the transport barrier (size of pores, number of pores etc.). The mentioned models of peritoneal transport were included into practical methods and computer programs for the evaluation of the efficacy and adequacy of peritoneal dialysis (Haraldsson, 2001; Van Biesen et al., 2003; Van Biesen et al., 2006; Vonesh et al., 1991; Vonesh &Keshaviah, 1997; Vonesh et al., 1999). In this chapter these two most popular models describing peritoneal transport of fluid and solutes were presented and compared as regards their basic ideas and aims as well as their applicability. The membrane model provides a simple relationship between the rates of fluid and solute flows and their respective driving forces, whereas the three-pore model gives a quantitative relationship between the transport coefficients for various solutes and between fluid and solute transport coefficients. Additionally, the parameters estimation techniques and the possible problems with parameter estimation were discussed.
5. References Chen, T.W., Khanna, R., Moore, H., Twardowski, Z.J. &Nolph, K.D. (1991). Sieving and reflection coefficients for sodium salts and glucose during peritoneal dialysis in rats. Journal of the American Society of Nephrology, Vol. 2, No. 6, pp. (1092-1100) De Paepe, M., Belpaire, F., Schelstraete, K. &Lameire, N. (1988). Comparison of different volume markers in peritoneal dialysis. J Lab Clin Med, Vol. 111, No. 4, pp. (421-429) Deen, W.M. (1987). Hindered transport of large molecules in liquid-filled pores. AIChE Journal, Vol. 33, No. 9, pp. (1409) Douma, C.E., de Waart, D.R., Struijk, D.G. &Krediet, R.T. (1996). Effect of amino acid based dialysate on peritoneal blood flow and permeability in stable CAPD patients: a potential role for nitric oxide? Clin Nephrol, Vol. 45, No. 5, pp. (295-302) Flessner, M.F. (1991). Peritoneal transport physiology: insights from basic research. J Am Soc Nephrol, Vol. 2, No. 2, pp. (122-135) Freida, P., Galach, M., Divino Filho, J.C., Werynski, A. &Lindholm, B. (2007). Combination of crystalloid (glucose) and colloid (icodextrin) osmotic agents markedly enhances peritoneal fluid and solute transport during the long PD dwell. Perit Dial Int, Vol. 27, No. 3, pp. (267-276) Galach, M., Werynski, A., Waniewski, J., Freida, P. &Lindholm, B. (2009). Kinetic analysis of peritoneal fluid and solute transport with combination of glucose and icodextrin as osmotic agents. Perit Dial Int, Vol. 29, No. 1, pp. (72-80) Galach, M., Waniewski, J., Axelsson, J., Heimburger, O., Werynski, A. &Lindholm, B. (2010). Mathematical modeling of the glucose-insulin system during peritoneal dialysis with glucose-based fluids. Asaio J, Vol. 57, No. 1, pp. (41-47) Haraldsson, B. (2001). Optimization of peritoneal dialysis prescription using computer models of peritoneal transport. Perit Dial Int, Vol. 21 Suppl 3, pp. (S148-151)
20
Progress in Peritoneal Dialysis
Heimburger, O., Waniewski, J., Werynski, A. &Lindholm, B. (1992). A quantitative description of solute and fluid transport during peritoneal dialysis. Kidney Int, Vol. 41, No. 5, pp. (1320-1332) Imholz, A.L., Koomen, G.C., Struijk, D.G., Arisz, L. &Krediet, R.T. (1994). Fluid and solute transport in CAPD patients using ultralow sodium dialysate. Kidney Int, Vol. 46, No. 2, pp. (333-340) Juillet, B., Bos, C., Gaudichon, C., Tome, D. &Fouillet, H. (2009). Parameter estimation for linear compartmental models--a sensitivity analysis approach. Ann Biomed Eng, Vol. 37, No. 5, pp. (1028-1042) Kedem, O. &Katchalsky, A. (1958). Thermodynamic analysis of the permeability of biological membranes to non-electrolytes. Biochim Biophys Acta, Vol. 27, No. 2, pp. (229-246) Krediet, R.T., Struijk, D.G., Koomen, G.C. &Arisz, L. (1991). Peritoneal fluid kinetics during CAPD measured with intraperitoneal dextran 70. ASAIO Trans, Vol. 37, No. 4, pp. (662-667) Krediet, R.T., Lindholm, B. &Rippe, B. (2000). Pathophysiology of peritoneal membrane failure. Perit Dial Int, Vol. 20 Suppl 4, pp. (S22-42) Lysaght, M.J. &Farrell, P.C. (1989). Membrane phenomena and mass transfer kinetics in peritoneal dialysis. Journal of Membrane Science, Vol. 44, No. 1, pp. (5) Ni, J., Verbavatz, J.M., Rippe, A., Boisde, I., Moulin, P., Rippe, B., Verkman, A.S. &Devuyst, O. (2006). Aquaporin-1 plays an essential role in water permeability and ultrafiltration during peritoneal dialysis. Kidney Int, Vol. 69, No. 9, pp. (1518-1525) Olszowska, A., Waniewski, J., Werynski, A., Anderstam, B., Lindholm, B. &Wankowicz, Z. (2007). Peritoneal transport in peritoneal dialysis patients using glucose-based and amino acid-based solutions. Perit Dial Int, Vol. 27, No. 5, pp. (544-553) Pannekeet, M.M., Imholz, A.L., Struijk, D.G., Koomen, G.C., Langedijk, M.J., Schouten, N., de Waart, R., Hiralall, J. &Krediet, R.T. (1995). The standard peritoneal permeability analysis: a tool for the assessment of peritoneal permeability characteristics in CAPD patients. Kidney Int, Vol. 48, No. 3, pp. (866-875) Rippe, B. &Haraldsson, B. (1987). Fluid and protein fluxes across small and large pores in the microvasculature. Application of two-pore equations. Acta Physiol Scand, Vol. 131, No. 3, pp. (411-428) Rippe, B. &Stelin, G. (1989). Simulations of peritoneal solute transport during CAPD. Application of two-pore formalism. Kidney Int, Vol. 35, No. 5, pp. (1234-1244) Rippe, B., Simonsen, O. &Stelin, G. (1991a). Clinical implications of a three-pore model of peritoneal transport. Adv Perit Dial, Vol. 7, pp. (3-9) Rippe, B., Stelin, G. &Haraldsson, B. (1991b). Computer simulations of peritoneal fluid transport in CAPD. Kidney Int, Vol. 40, No. 2, pp. (315-325) Rippe, B. &Haraldsson, B. (1994). Transport of macromolecules across microvascular walls: the two-pore theory. Physiol Rev, Vol. 74, No. 1, pp. (163-219) Rippe, B. &Levin, L. (2000). Computer simulations of ultrafiltration profiles for an icodextrin-based peritoneal fluid in CAPD. Kidney Int, Vol. 57, No. 6, pp. (25462556) Smit, W., Parikova, A., Struijk, D.G. &Krediet, R.T. (2005). The difference in causes of early and late ultrafiltration failure in peritoneal dialysis. Perit Dial Int, Vol. 25 Suppl 3, pp. (S41-45)
Representations of Peritoneal Tissue – Mathematical Models in Peritoneal Dialysis
21
Stachowska-Pietka, J., Waniewski, J., Vonesh, E. &Lindholm, B. (2010). Changes in free water fraction and aquaporin function with dwell time during continuous ambulatory peritoneal dialysis. Artif Organs, Vol. 34, No. 12, pp. (1138-1143) Stelin, G. &Rippe, B. (1990). A phenomenological interpretation of the variation in dialysate volume with dwell time in CAPD. Kidney Int, Vol. 38, No. 3, pp. (465-472) Twardowski, Z.J., Prowant, B.F., Nolph, K.D., Martinez, A.J. &Lampton, L.M. (1983). High volume, low frequency continuous ambulatory peritoneal dialysis. Kidney Int, Vol. 23, No. 1, pp. (64) Van Biesen, W., Carlsson, O., Bergia, R., Brauner, M., Christensson, A., Genestier, S., HaagWeber, M., Heaf, J., Joffe, P., Johansson, A.C., Morel, B., Prischl, F., Verbeelen, D. &Vychytil, A. (2003). Personal dialysis capacity (PDC(TM)) test: a multicentre clinical study. Nephrol Dial Transplant, Vol. 18, No. 4, pp. (788-796) Van Biesen, W., Van Der Tol, A., Veys, N., Lameire, N. &Vanholder, R. (2006). Evaluation of the peritoneal membrane function by three letter word acronyms: PET, PDC, SPA, PD-Adequest, POL: what to do? Contrib Nephrol, Vol. 150, pp. (37-41) Vonesh, E.F., Lysaght, M.J., Moran, J. &Farrell, P. (1991). Kinetic modeling as a prescription aid in peritoneal dialysis. Blood Purif, Vol. 9, No. 5-6, pp. (246-270) Vonesh, E.F. &Keshaviah, P.R. (1997). Applications in kinetic modeling using PD ADEQUEST. Perit Dial Int, Vol. 17 Suppl 2, pp. (S119-125) Vonesh, E.F., Story, K.O. &O'Neill, W.T. (1999). A multinational clinical validation study of PD ADEQUEST 2.0. PD ADEQUEST International Study Group. Perit Dial Int, Vol. 19, No. 6, pp. (556-571) Waniewski, J., Werynski, A., Heimburger, O. &Lindholm, B. (1991). Simple models for description of small-solute transport in peritoneal dialysis. Blood Purif, Vol. 9, No. 3, pp. (129-141) Waniewski, J., Werynski, A., Heimburger, O. &Lindholm, B. (1992). Simple membrane models for peritoneal dialysis. Evaluation of diffusive and convective solute transport. Asaio J, Vol. 38, No. 4, pp. (788-796) Waniewski, J., Heimburger, O., Park, M.S., Werynski, A. &Lindholm, B. (1994). Methods for estimation of peritoneal dialysate volume and reabsorption rate using macromolecular markers. Perit Dial Int, Vol. 14, No. 1, pp. (8-16) Waniewski, J., Heimburger, O., Werynski, A., Park, M.S. &Lindholm, B. (1995). Diffusive and convective solute transport in peritoneal dialysis with glucose as an osmotic agent. Artif Organs, Vol. 19, No. 4, pp. (295-306) Waniewski, J., Heimburger, O., Werynski, A. &Lindholm, B. (1996a). Osmotic conductance of the peritoneum in CAPD patients with permanent loss of ultrafiltration capacity. Peritoneal Dialysis International, Vol. 16, No. 5, pp. (488-496) Waniewski, J., Heimburger, O., Werynski, A. &Lindholm, B. (1996b). Simple models for fluid transport during peritoneal dialysis. Int J Artif Organs, Vol. 19, No. 8, pp. (455466) Waniewski, J., Heimburger, O., Werynski, A. &Lindholm, B. (1996c). Diffusive mass transport coefficients are not constant during a single exchange in continuous ambulatory peritoneal dialysis. Asaio J, Vol. 42, No. 5, pp. (M518-523) Waniewski, J., Heimburger, O., Werynski, A. &Lindholm, B. (1996d). Paradoxes in peritoneal transport of small solutes. Perit Dial Int, Vol. 16 Suppl 1, pp. (S63-69)
22
Progress in Peritoneal Dialysis
Waniewski, J. (1999). Mathematical models for peritoneal transport characteristics. Perit Dial Int, Vol. 19 Suppl 2, pp. (S193-201) Waniewski, J. (2004). A Mathematical Model of Local Stimulation of Perfusion by Vasoactive Agent Diffusing from Tissue Surface. Cardiovascular Engineering, Vol. 4, No. 1, pp. (115) Waniewski, J., Debowska, M. &Lindholm, B. (2008). How accurate is the description of transport kinetics in peritoneal dialysis according to different versions of the threepore model? Perit Dial Int, Vol. 28, No. 1, pp. (53-60)
2 Distributed Models of Peritoneal Transport Joanna Stachowska-Pietka and Jacek Waniewski Institute of Biocybernetics and Biomedical Engineering
Polish Academy of Sciences, Warsaw
Poland 1. Introduction There are several methods to model the process of water and solute transport during peritoneal dialysis (PD). The characteristics of the phenomena and the purpose of modelling influence the choice of methodology. Among others, the phenomenological models are commonly used in clinical and laboratory research. In peritoneal dialysis, the compartmental approach is widely used (membrane model, three-pore model). These kinds of models are based on phenomenological parameters, sometimes called “lumped parameters”, because one parameter is used to describe the net result of several different processes that occur during dialysis. The main advantage of the compartmental approach is that it decreases substantially the number of parameters that have to be estimated, and therefore its application in clinical research is easier. However, in the compartmental approach, it is usually very difficult to connect the estimated parameters with the physiology and the local anatomy of the involved tissues. Therefore, these models have limited applications in the explanation of the changes that occur in the physiology of the peritoneal transport. For example, the membrane models describe exchange of fluid and solute between peritoneal cavity and plasma through the “peritoneal membrane”. However, this approach does not take into account the anatomy and physiology of the peritoneal transport system and cannot be used for the explanation of the processes that occur in the tissue during the treatment. Basic concepts and previous applications of distributed models are summarized in Section 2. A mathematical formulation of the distributed model for fluid and solute peritoneal transport is also presented in Section 2. The effective parameters, which characterize transport through the peritoneal transport system, PTS (i.e. the fluid and solute exchange between the peritoneal cavity and blood), can be estimated from the local physiological parameters of the distributed models. The comparisons between transport parameters applied in phenomenological description and those derived using a distributed approach, are presented in Sections 3 and 4 for fluid and solute transport, respectively. Typical distributed profiles of tissue hydration and solutes concentration in the tissue are presented in Section 5.
2. Distributed modelling of peritoneal transport The first applications of the distributed model are dated to the early 1960s and were limited to the diffusive transport. Pipper et al. studied the exchange of gases between blood and artificial gas pockets within the body (Piiper, Canfield, and Rahn 1962). The transport of
24
Progress in Peritoneal Dialysis
gases between subcutaneous pockets and blood was studies in rats and piglets (Van Liew 1968; Collins 1981). The theory of heat and solute exchange between blood and tissue was investigated using distributed approach by Perl (Perl 1963, 1962). The first application of the distributed model for the description of the diffusive transport of small solutes was proposed by Patlak and Fenstermacher, in order to describe the transport from cerebrospinal fluid to the brain (Patlak and Fenstermacher 1975). The diffusive delivery of drugs to the human bladder during intravesical chemotherapy, as well as drug delivery from the skin surface to the dermis, has been also studied in normal and cancer tissue using distributed approach (Gupta, Wientjes, and Au 1995; Wientjes et al. 1993; Wientjes et al. 1991). The distributed model was also applied for the theoretical description of fluid and solute transport in solid tumors (Baxter and Jain 1989, 1990, 1991). The need of the model that could relate the anatomy and local physiological processes with the observed outcome of the peritoneal transport was mentioned by Nolph, Miller, and Popovich (Nolph et al. 1980). One of the attempts in this direction was proposed by Dedrick, Flessner and colleagues. They considered a distributed approach, in which the spatial structure of the tissue with blood capillaries and lymphatics distributed at different distance from the peritoneal cavity, was taken into account (Dedrick et al. 1982; Flessner 2005; Flessner, Dedrick, and Schultz 1985). Another approach, based on the three-pore model, assumes existence of serial layers of two kinds: tissue and “peritoneal membrane” (Venturoli and Rippe 2001). The application of distributed models in intraperitoneal therapies was initiated in the early eighties of the 20th century. Initially, the diffusive transport of gases between intraperitoneal pockets and blood was studied by Collins in 1981 (Collins 1981). In the peritoneal dialysis field the distributed approach was introduced by Dedrick, Flessner and colleagues (Dedrick et al. 1982; Flessner, Dedrick, and Schultz 1984). The distributed modelling of diffusive solute transport during peritoneal dialysis was also studied by Waniewski (Waniewski 2002). Further applications of the model in the peritoneal dialysis field were related to the transport of small, middle and macro -molecules in animal studies as well as in CAPD patients (Dedrick et al. 1982; Flessner 2001; Flessner, Dedrick, and Schultz 1985; Flessner et al. 1985; Flessner, Lofthouse, and Zakaria el 1997). The initial models of peritoneal solute transport considered interstitium as a rigid, porous medium with constant fluid void volume and intraperitoneal and interstitial hydrostatic pressures (Flessner, Dedrick, and Schultz 1984). This theoretical description was validated with experimental data from rats (Flessner, Dedrick, and Schultz 1985). In the later model of IgG peritoneal transport, the changes in interstitial and intraperitoneal pressure were taken into account according to experimental studies (Flessner 2001). The process of intraperitoneal drug delivery, especially for anticancer therapies, was also described using the distributed approach (Flessner 2001; Collins et al. 1982; Flessner 2009). The so far mentioned models were applied for diffusive and convective solute transport. Seames, Moncrief and Popovich were the first who investigated osmotically driven fluid and solute transport during peritoneal dwell (Seames, Moncrief, and Popovich 1990). However, their attempt was later disproved by animal experiments (Flessner et al. 2003; Flessner 1994). Further investigations by Leypoldt and Henderson were focused on solute transport driven by diffusion and ultrafiltration from blood and interactions of the solute with the tissue (Leypoldt 1993; Leypoldt and Henderson 1992). A new attempt to apply a distributed approach to model impact of chronic peritoneal inflammation from sterile solutions and structural changes within the tissue on the solute and water transport was undertaken recently by Flessner et al. (Flessner et al. 2006).
25
Distributed Models of Peritoneal Transport
The distributed model of fluid absorption was proposed by Stachowska-Pietka et al. and applied for the analysis changes in the tissue caused by infusion of isotonic solution into the peritoneal cavity (Stachowska-Pietka et al. 2005; Stachowska-Pietka et al. 2006). This model can be applied to describe situation at the end of a dwell with hypertonic solution, when the osmotic pressure decreases and the intraperitoneal hydrostatic pressure is the main transport force. The osmotically driven glucose transport was modelled by Cherniha, Waniewski and co-authors (Cherniha and Waniewski 2005; Waniewski et al. 2007; Waniewski, StachowskaPietka, and Flessner 2009). These authors where able to predict high ultrafiltration from blood to the peritoneal cavity and positive interstitial pressure profiles assuming a high value of reflection coefficient for glucose in the capillary wall and a low value of reflection coefficient for glucose in the tissue. Further extensions of this model were suggested (Stachowska-Pietka, Waniewski, and Lindholm 2010; Stachowska-Pietka 2010; Stachowska-Pietka and Waniewski 2011). In this new approach, the variability of dialysis fluid volume, hydrostatic pressure and solute concentrations with dwell time were additionally taken into account and yielded a good agreement of the theoretical description and clinical data. A distributed model that takes into account also the two phase structure of the tissue and allows for the modelling of bidirectional fluid and macromolecular transport during PD was recently formulated (Stachowska-Pietka, Waniewski, and Lindholm 2010; Stachowska-Pietka 2010). 2.1 Basic concepts The distributed approach takes into account the spatial distribution of the peritoneal transport system (PTS) components. Typically, this concept includes the microcirculatory exchange vessels that are assumed to be uniformly distributed within the tissue. However, this simplifying assumption can in general be omitted and the variability of the tissue space and structure can be taken into account. In order to describe the distributed structure of PTS, the methods of partial differential equation (instead of ordinary differential equations) should be applied. As a result, the changes in the spatial distribution of solutes and fluid in the tissue with time can be modelled. Peritoneal fluid and solute exchange concerns all the organs that surround peritoneal cavity. It is assumed that tissue is perfused with blood by capillaries, which are placed at different distance from the peritoneal surface (Figure 1).
Peritoneal Cavity
Interstitial tissue Fluid and solutes exchange through the capillary wall
Fluid and solute absorption from p.c. Fluid and solute transport into p.c.
Potential fluid and solute outflow
Lymphatic absorption from the tissue x=0
x=L
distance
Fig. 1. Fluid and solute transport pathways during peritoneal dialysis: dashed, red circles – blood capillaries walls, solid, orange circles – lymphatic capillaries
26
Progress in Peritoneal Dialysis
Lymphatic absorption plays an important role in the process of regulation of fluid and solute transport within the tissue. The tissue properties, including the spatial distribution of blood and lymph capillaries, are idealized in the distributed modelling by the assumption that blood and lymph capillaries are uniformly distributed within the tissue and that the interstitium is a deformable, porous medium, see Figure 1 (Flessner 2001; Waniewski 2001). The difference in solute concentration between blood and dialysis fluid results in a quasi-continuous spatially variable concentration profile. Moreover, fluid infusion into the peritoneal cavity induces increase of interstitial hydrostatic pressure and results in fluid transport within the tissue. The tissue hydrostatic pressure equilibrates with the intraperitoneal hydrostatic pressure at the peritoneal surface, and decreases with the distance from the peritoneal cavity. 2.1.1 Structure of the peritoneal transport systems and its barriers Once water and solutes leave the peritoneal cavity and enter the adjacent tissue they penetrate to its deeper parts, c.f. Figure 1. In the tissue, fluid and solute partly cross the heteroporous capillary wall and are washed out by the blood stream, whereas another part is absorbed from the tissue by local lymphatics. A part of the fluid and solute accumulates in the tissue. In some situations, fluid and solutes can leave the tissue on its other side, as in the case of the intestinal wall or in some experiments with the impermeable outer surface (skin) removed (Flessner 1994). Figure 1 summarizes the fluid and solute transport pathways. Two main transport barriers for peritoneal fluid and solute transport are considered in the distributed approach. On the basis of experimental data it was found that: 1) the heteroporous structure of the capillary wall, and 2) interstitium, are significant barriers of the peritoneal transport system (Flessner 2005). The experimental studies showed that interstitium is the most important barrier for the transport of fluid and selected solutes across the tissue. In contrast, some authors considered also the mesothelium as a substantial transport barrier and modeled it as a semipermeable membrane with the properties analogous to the that of the endothelium (Seames, Moncrief, and Popovich 1990). They analyzed the transport of water, BUN, creatinine, glucose and inulin. They fitted the model to the data on intraperitoneal volume and solute concentrations in dialysate and blood and predicted negative values of interstitial hydrostatic pressure (Seames, Moncrief, and Popovich 1990). However, later studies disproved this assumption and found the positive interstitial pressure profiles in the tissue (Flessner et al. 2003). 2.1.2 Fluid and solute void volume The fluid space within the interstitium can be described using the interstitial fluid void volume ratio, , that is defined as the fraction of the interstitial space that is available for interstitial fluid (non-dimensional, being the ratio of volume over volume). Typically, at physiological equilibrium, this value remains around 15% - 18%, and may be doubled during peritoneal dialysis (Zakaria, Lofthouse, and Flessner 2000, 1999). The fraction of solute interstitial void volume, S , i.e., the fraction of tissue volume effectively available to the solute S , depends on the solute molecular size, and in the case of large macromolecules can be significantly smaller than that for fluid. Experimental studies showed that distribution of the solute macromolecules can be restricted to even 50% of (Wiig et al. 1992). Therefore, in general S . The interstitial fluid void volume ratio as a function of interstitial hydrostatic pressure derived on the basis of experimental studies is presented in Figure 2, c.f. (Cherniha and Waniewski 2005; Stachowska-Pietka et al. 2005; Stachowska-Pietka et al. 2006).
27
Distributed Models of Peritoneal Transport 0.45 0.4 FLUID VOID VOLUME
0.35 0.3 0.25 0.2 0.15 0.1 0.05 -4
-3
0 -2 -1 0 1 2 3 4 5 INTERSTITIAL HYDROSTATIC PRESSURE P, mmHg
6
Fig. 2. The experimental data of interstitial fluid void volume ratio measured in the rat skeletal muscle and signed by solid circles (Zakaria, Lofthouse, and Flessner 1999) and the fitted interstitial fluid void volume ratio curve, , as a function of interstitial pressure, P . This approach reflects the experimental findings showing that interstitial fluid void volume ratio may increase initially rapidly (for positive, low values of interstitial pressure), whereas there is no effect of further increasing of P if reaches its maximal value, MAX . The interstitial fluid void volume, , can be mathematically described as (Stachowska-Pietka et al. 2006):
MIN
MAX MIN PP MIN 1 e 0 1 MAX 0 MIN
(1)
where MIN 0.177 and MAX 0.36 are respectively minimal and maximal values of the fluid void volume, 0 0.18 is the fluid void volume for P P0 0 mmHg, 2.019 mmHg-1, and P0 is the initial value of interstitial hydrostatic pressure measured in mmHg, see Figure 2. A particular case of this general formula was considered previously by An and Salathe (An and Salathe 1976). They were the first, who proposed the explicit formula for the fluid void volume as a function of interstitial pressure, assuming erroneously that MIN 0 and MAX 1 . 2.2 Distributed model of fluid transport The changes in the total tissue volume are considered to be small enough to assume the constant total tissue volume. Therefore, the whole tissue is considered as not expendable, whereas the interstitial compliance and changes in the tissue hydration are taken into account. Under this condition, the equation for the changes in the fraction of the interstitial fluid void volume ratio can be described using the volume balance of the interstitium as follows (Stachowska-Pietka et al. 2006; Stachowska-Pietka et al. 2005; Flessner 2001): j V qV t x
(2)
28
Progress in Peritoneal Dialysis
where is the fraction of the interstitial fluid volume over the total tissue volume, further on called as the void volume, jV is the volumetric fluid flux across the interstitium, qV is the rate of the net fluid flow into the tissue from the internal sources (sinks) such as blood or lymphatic capillaries per unit tissue volume, t is the dwell time, and x is the distance measured from the peritoneal cavity. Note, that volumetric flux, jV , is defined as volumetric flow (in ml/min) per unit surface (in cm2) perpendicular to its direction, i.e., the unit of flux is cm/min. The unit of local volumetric flow density, qV , is 1/min, i.e., as for volumetric flow (in ml/min) per unit volume (in mL). The orientations of specific fluid fluxes are presented in Figure 3. Fluid flux across the interstitium depends on the local tissue hydraulic conductivity, K , and local interstitial hydrostatic pressure gradient, P / x . Moreover, the osmotic agent (crystalloid or colloid) may exert osmotic effect on the fluid. These effects can be taken into account by including the role of local tissue osmotic gradients into the model. In particular, the impact of the oncotic gradient exerted by proteins was previously included in the Darcy formula by Taylor et al. (Taylor, Bert, and Bowen 1990). Thus, the volumetric fluid flux across the interstitium may be calculated by the extended Darcy law as follows (Waniewski, Stachowska-Pietka, and Flessner 2009; Waniewski et al. 2007): P C ST RT S jV K x x S 1,..., N
(3)
where ST is the reflection coefficient (positive for osmotically active solutes in the tissue), CS is the concentration of solute in the tissue, and solutes are indexed by S from 1 to N.
Peritoneal Cavity
Tissue
jV
qS jS
cap
qL
jV
qVcap
qLCS jS
jV
qL qScap qVcap
qScap qVcap
qLCS jV
Fig. 3. Scheme of fluid and solute transport and positive orientations of each flux as modelled by the distributed approach: dashed circles – blood capillaries walls, solid circles – lymphatic capillaries. Fluid flow between tissue and circulatory system, qV cap , can occur through the capillary wall in both directions: into and from the tissue. In addition, the final net inflow of fluid to the tissue is typically smaller due to the local tissue lymphatic absorption. Therefore, the net fluid inflow into the tissue is given as:
29
Distributed Models of Peritoneal Transport
qV qV cap qL
(4)
where qV cap is the net fluid flow through the capillary wall into the tissue, and qL is the rate of lymphatic absorption in the tissue. For the calculation of the fluid flow across capillary wall, the three-pore model or the membrane model can be applied. According to both approaches, the fluid flow across the capillary wall, qV cap , is driven by the hydrostatic (first term) and osmotic pressure (second term) differences that are exerted through the capillary wall. In particular, if the membrane model is applied for the microvascular exchange of fluid, net fluid flow across the capillary wall to the tissue can be calculated as (StachowskaPietka et al. 2006; Waniewski, Stachowska-Pietka, and Flessner 2009): qV cap LP a PB P LP a
S 1,..., N
Scap RT C B,S CS
(5)
where PB and C B ,S are the hydrostatic pressure and solute concentration in the blood, respectively, P and CS are interstitial hydrostatic pressure and solute concentration in the tissue, respectively, LP a and S cap are the capillary wall hydraulic conductance and reflection coefficient of the capillary wall, respectively. If the three-pore model for the microvascular exchange across capillary wall is applied, the fluid transport through each type of pore should be calculated separately, and summed up. Equation (1) specifies the interstitial fluid void volume, , as a function of interstitial d P pressure, P . Therefore, the rate of change of can be transformed as and t dP t equation (2) for time evolution of variable can be converted to the following equation for the time evolution of variable P (Stachowska-Pietka et al. 2006): d P jV qV dP t x
(6)
In order to find theoretical solution, these equations must be combined with equations for the transport of solutes. In general, the transport parameters in equations (2) - (5), such as K , qL , LP a , ST , Scap can be assumed constant for some approximate considerations (Waniewski 2001; Flessner 2001). However, physiological data suggest that in more realistic modelling, the relationship between the parameters and the tissue properties should be taken into account. In particular, the dependence of tissue hydration, hydraulic conductivity, or lymphatic absorption on the interstitial hydrostatic pressure as well as the vasodilation induced by hyperosmotic dialysis fluid should be considered. Therefore, in numerical simulations of distributed models, some of the transport parameters (such as K , qL , LP a ) are typically functions of model variables (solute concentration in the tissue, CS , interstitial hydrostatic pressure, P, and also indirectly of interstitial fluid void volume ratio, ) and dwell time, t . The specific forms of these functions can be found elsewhere (Stachowska-Pietka et al. 2006; Waniewski, Stachowska-Pietka, and Flessner 2009; Stachowska-Pietka 2010). Initial and boundary conditions for this problem are well define and were previously discussed in details (Stachowska-Pietka et al. 2006; Stachowska-Pietka 2010; Stachowska-Pietka et al. 2005).
30
Progress in Peritoneal Dialysis
2.3 Distributed model of solute transport The solute concentration profiles within the tissue can be derived from the equation on the local solute mass balance using a partial differential equation for local solute balance as (Stachowska-Pietka et al. 2007; Waniewski 2002; Waniewski, Stachowska-Pietka, and Flessner 2009; Flessner 2001): S CS t
jS qS x
(7)
where S is the fraction of interstitial fluid void volume ratio, , available for the distribution of solute S , CS is the solute concentration in the interstitial fluid, jS is the solute flux across the tissue, qS is the rate of the net solute inflow to the tissue from the external sources/sinks, such as blood or lymph, x is the distance measured from the peritoneal surface, and t is time. The solute flux across the tissue, jS , is defined as the solute flow (in mmol/min) per unit surface (in cm2) perpendicular to its direction, i.e., the unit of flux is mmol/min/cm2. The unit of local solute flow density, qS , is mmol/min/mL, i.e., as for solute flow (in mmol/min) per unit volume (in mL). The orientations of solute fluxes are presented in Figure 3. Solute flux across the tissue comprises two components. The diffusive transport of solute depends on the local concentration gradient, whereas fluid flux across the tissue induces its convective transport. Therefore, the solute flux across the tissue can be calculated as follows (Stachowska-Pietka et al. 2007; Waniewski 2002; Waniewski, Stachowska-Pietka, and Flessner 2009; Flessner 2001): jS DST
CS sST jV C S x
(8)
where DST is the diffusivity of solute S in the tissue, sST is sieving coefficient of solute in the tissue, and jV is the volumetric fluid flux across the tissue. Note, that for homogenous structure ST 1 sST is the tissue reflection coefficient of solute S . The net changes in the solute amount in the tissue are considered to be caused by the local microvascular exchange between blood and tissue through the capillary wall, decreased by the solute absorption from the tissue by local lymphatics: qS qScap qL CS
(9)
where qScap in the net solute flux across the capillary wall into the tissue, and qL is the rate of local lymphatic absorption. Depending on the purpose of the study, the solute transport between blood and tissue can be calculated according to the three-pore model or the membrane model. In general, solute flux across the capillary wall is driven by the solute concentration difference between blood and tissue, C B,S CS , and by the convective fluid flow across the capillary wall, qV cap . In particular, if the membrane model is applied for the microvascular exchange, the solute net flux across the capillary wall to the tissue can be calculated as (Waniewski et al. 2007; Waniewski, Stachowska-Pietka, and Flessner 2009): qScap pS a C B ,S CS sScap qV cap fC B ,S 1 f CS
(10)
Distributed Models of Peritoneal Transport
31
where pS a is the diffusive permeability of solute S through the capillary wall, sScap is sieving coefficient for solute in the capillary wall, and f is the weighting factor within the range from 0 to 1, which in general can be calculated from the fluid flow across the capillary wall according to the formula for Peclet number. Note, that S cap 1 sS cap is the capillary wall reflection coefficient for solute S . In the case of a three-pore model for the microvascular exchange across the capillary wall it can be described as the sum of solute fluxes through each type of the pore. Equation (7) together with equations (8) - (10) for jS and qS may be analyzed theoretically for constant values of S , constant transport parameters such as DST , sST , pS a , sScap , and for given fluid transport characteristics jV and qV cap . However, in the general case, equation (7) must be coupled with equation (6) for time evolution of P , in order to calculate and then S . Furthermore, the dynamic changes in the transport parameters, caused by the changes in tissue hydration and vasodilation of the capillary bed, make DST and pS a functions of P (or ), CS and dwell time, t . The specific forms of these functions can be found elsewhere (Stachowska-Pietka 2010; Stachowska-Pietka et al. 2006; Waniewski, Stachowska-Pietka, and Flessner 2009). The details concerning initial and boundary conditions for solute and fluid peritoneal transport can be found elsewhere (StachowskaPietka and Waniewski 2011; Stachowska-Pietka 2010; Waniewski, Stachowska-Pietka, and Flessner 2009, Waniewski 2001, 2002).
3. Modelling of fluid transport The purpose of this section is to present relationships between the net fluid transport parameters for the transport between blood and dialysis fluid in the peritoneal cavity (as estimated using phenomenological models of peritoneal dialysis in clinical and experimental studies), and the separate characteristics of the capillary wall and interstitial transport barriers as well as the distributed geometry of peritoneal transport system (PTS). Two simplified versions of the distributed model for fluid peritoneal transport are analysed assuming steady state conditions. The effective permeability of the tissue is analysed for the simplified model in which fluid transport is driven by hydrostatic pressure difference, causing fluid absorption. In order to present osmotic properties of PTS, the distributed model of osmotic fluid flow is presented, in which water absorption from the peritoneal cavity is neglected. In order to evaluate effective transport parameters from the distributed model, which can be compare with the experimental values, one should refer to the net fluid flow instead of fluid flux. In general, the net fluid flow can be calculated from the fluid flux by multiplying by the effective peritoneal surface area A in cm2. Therefore JV A jV is the fluid flow described in mL/min, and A 6000 cm2. More details concerning results presented in this section can be found in (Waniewski, Stachowska-Pietka, and Flessner 2009). 3.1 Effective hydraulic conductivity A simple version of the distributed model with fluid flow induced only by hydrostatic pressure may be applied for the derivation of the description of the flux across the tissue
peritoneal surface, jV tsteady , x 0 jV perit , and the effective hydraulic conductivity for fluid
32
Progress in Peritoneal Dialysis
at time tsteady , when the system reaches its steady-state. Therefore, equation (3) for fluid transport across tissue can be simplified to the from jV K
P , whereas fluid transport x
across capillary wall is given by qV cap LP a PB P . In this case, the fluid flow across the peritoneal surface (i.e. fluid flux multiplied by effective peritoneal surface area) depends on the hydrostatic pressure difference between peritoneal cavity and the tissue and can be described by the following formula (Waniewski, Stachowska-Pietka, and Flessner 2009):
JV perit memLP a PD P eq
(11)
where PD and P eq are hydrostatic pressures in the peritoneal cavity and tissue, respectively, and memLP a is the effective hydraulic conductivity for transport between blood and dialysate that is calculated as: memLP a A tanh K LP a
(12)
with L / F , L - tissue width, and F K / LP a - fluid penetration depth in the tissue, K - tissue hydraulic conductivity, LP a - hydraulic conductance of capillary wall, A -
effective peritoneal surface area. Furthermore, assuming that tissue width is much higher than the fluid penetration depth, F L , i.e. 1 , one can get the following, simplified formula for the effective hydraulic conductivity for transport between blood and dialysate:
memLP a A K LP a
(13)
Some exemplary values of fluid penetration depth, effective hydraulic conductivity of PTS and the corresponding values of tissue and capillary wall transport are presented in Table 1. Remark 1. Formula (13) can be transformed to memLP a A LP a F , which means that the fluid transport may be considered, according to the distributed model, as proceeding directly between blood and dialysis fluid across the total capillary wall surface within the tissue layer of the width F with hydraulic conductance Lp a , as this capillary would be immersed directly in dialysis fluid (Waniewski, Stachowska-Pietka, and Flessner 2009). Remark 2. Formula (13) can be alternatively transformed to memLP a A K / F indicating that the same fluid transport may be considered also as proceeding between blood and dialysis fluid across the tissue layer with hydraulic conductivity K and width F (which is fluid penetration depth) without any interference from blood flow in the capillaries; however, F depends on Lp a (Waniewski, Stachowska-Pietka, and Flessner 2009). Remark 3. The maximal possible value of memLP a is A LP a L , which would happen if the fluid penetrated fully the whole tissue layer, and in this case the effective hydraulic conductivity of distributed system would be equal to the total hydraulic conductance for the whole capillary bed in the tissue (Waniewski, Stachowska-Pietka, and Flessner 2009).
33
Distributed Models of Peritoneal Transport
Parameter Assumed/adjusted: K 104 , cm2min-1mmHg-1 LP a 104 , ml·min-1mmHg-1g-1
Range of values 0.139 1.48 – 3.66
Derived: F , cm memLP a ,
0.19 – 0.31 ml·min-1mmHg-1
0.27 – 0.43
Table 1. Theoretical values of transport parameters assumed in computer simulations and the corresponding values of effective transport parameters of PTS estimated for A = 6000 cm2: K – tissue hydraulic conductivity, LP a - capillary wall hydraulic conductance, A – effective peritoneal surface area, F - fluid penetration depth, memLP a - effective hydraulic conductivity of PTS (Waniewski, Stachowska-Pietka, and Flessner 2009). 3.2 Effective reflection coefficient and osmotic conductance In this section a model with a single osmotic agent that induces osmotic fluid flow between blood and the peritoneal cavity is discussed. The hydrostatic pressure gradient in the tissue also contributes to the fluid flow, but the hydrostatic pressure difference across the capillary wall is neglected by assuming, for example, that it is approximately balanced by oncotic pressure difference. This approximation may be used only for the description of osmotic ultrafiltration induced by a high concentration of a crystalloid osmotic agent. Therefore, in the case of a single osmotic agent (as glucose), equation (3) for fluid flux across the tissue is C P cap cap T jV K , and equation (5) is qV LP a RT C B C . Note, that for the x x sake of simplicity, in the case of single solute, the bottom index S for solute can be omitted. If the solute (e.g., glucose) concentration profile in the tissue may be approximately described by the exponential function with the solute penetration depth , i.e. as C C B C D C B exp x / , the steady state fluid flow across the peritoneal surface can
approximated by the following formula (Waniewski, Stachowska-Pietka, and Flessner 2009):
JV perit memLP a eff RT C D C eq
(14)
where memLP a is the effective hydraulic conductivity of the peritoneal transport system, C D and C eq are solute concentrations in dialysate and tissue, respectively, and eff is the effective reflection coefficient for solute transport between peritoneal cavity and blood given by (Waniewski, Stachowska-Pietka, and Flessner 2009):
eff
cap 1 e L /
(15)
where F / is the ratio of fluid to solute penetration depth, cap is the capillary wall reflection coefficient to solute S. Moreover, assuming that the tissue width is much higher than the solute penetration depth, i.e. L , one can get the following simplified formula for the effective reflection coefficient of PTS (Waniewski, Stachowska-Pietka, and Flessner 2009):
34
Progress in Peritoneal Dialysis
eff
cap
(16)
Remark 1. The value of the effective reflection coefficient for particular solute transport between peritoneal cavity and blood, eff , can not exceed the value of the capillary wall reflection coefficient for this solute, cap , i.e. eff cap . Remark 2. The effective reflection coefficient can be calculated from the capillary wall reflection coefficient, after dividing by the ratio of fluid to solute penetration depth. Moreover, if necessary, this value should be additionally decreased by the formula 1 e L / . As the result, the distributed geometry of the capillary bed yields a substantial decrease in the effective reflection coefficient for crystalloid osmotic agents compared with their reflection coefficient in the capillary wall. Numerical simulations suggest 7-20 times lower values of eff if compared to cap (see, Table 2 and (Waniewski, Stachowska-Pietka, and Flessner 2009)). Remark 3. The effective reflection coefficient for the transport between peritoneal cavity and blood depends not only on the sieving properties of the capillary wall, but is also related to the tissue transport properties, since both fluid and solute penetration depths depends on the local tissue and capillary wall permeabilities. Remark 4. The effective osmotic conductance for the transport between peritoneal cavity and blood depends on both tissue and capillary wall transport characteristics and can be calculated as the effective hydraulic conductivity described by equation (13), multiplied by the effective reflection coefficient, described by equation (15), c.f. equation (14) (Waniewski, Stachowska-Pietka, and Flessner 2009):
memOsmCond eff memLp a
(17)
In Table 2, some typical values of effective reflection coefficient and osmotic conductance of PTS are derived for glucose in the case of clinical dialysis. Parameter Assumed/adjusted:
cap Derived: , cm eff memOsmCond, (ml/min)/(mmol/l)
Range of values 0.16 – 0.46 0.015 – 0.017 11.40 – 20.86 0.014 – 0.022 0.116
Table 2. Theoretical values of glucose transport parameters assumed in computer simulations and the corresponding values of effective transport parameters of PTS (Waniewski, Stachowska-Pietka, and Flessner 2009): cap - capillary wall reflection coefficient, - solute penetration depth, - ratio of fluid to solute penetration depth, eff - effective reflection coefficient of PTS, memOsmCond – effective osmotic conductance of PTS.
4. Modelling of solute transport During peritoneal dialysis solutes, such as osmotic agents, buffer solutes, additives and drugs, are transported from dialysis fluid to the tissue, and inside the tissue are absorbed to
Distributed Models of Peritoneal Transport
35
blood and lymph. On the other hand, solutes, which are to be removed with peritoneal dialysis, are transported first from blood to the tissue and there they are partly absorbed with lymph and partly transported to dialysis fluid. The contribution of blood and lymph flows to the solute gradient, created within the tissue due to the presence of dialysis fluid at the tissue surface, results in characteristic solute concentration profiles within the tissue. For some solutes, diffusive transport prevails (as for small molecules), but the role of convective transport through the capillary wall and (convective) absorption with lymph increases with the increased molecular weight. In particular, in the case of macromolecules, both types of convective transport should be considered. Therefore, for small molecules such as urea, creatinine, the simplified version of the distributed model with pure diffusive transport can be considered. In this case, simple relationships between net solute transport characteristics such as effective diffusivity across PTS, solute penetration depth and effective blood flow, and corresponding local distributed parameters are presented. The impact of combined diffusive and convective transport on derived effective characteristics is analysed in Section 4.2. In particular, the comparison between diffusive and convective penetration depth, as well as the analysis of effective sieving coefficient for macromolecules is analysed. Note, that all results presented in this section were derived for the steady state conditions. Moreover, to compare the effective solute transport parameters with the experimental one, the solute flux from the peritoneal cavity is multiplied by the effective peritoneal surface area, A. This transforms the equation for solute flux, jS , into the equation for solute flow, JS A jS , expressed in mmol/min. More details concerning models and the derivation of the expressions for effective transport parameters can be found in (Waniewski 2002, 2001). The bottom index S, which denotes solute, was omitted in this section for the sake of simplicity. 4.1 Diffusive solute transport between blood and the peritoneal cavity In this section the relationships between the net diffusive mass transport coefficients for the solute transport between blood and dialysis fluid and the local physiology based transport parameters of distributed models are analyzed. Moreover, the formulas for the solute diffusive penetration depth and effective peritoneal blood flow are derived. Therefore, a simplified model of pure diffusive transport across the tissue is analysed at the steady state C with the solute flux across the tissue given by jS DT and solute transport across x capillary wall described by equation (10). Note, that equation (10) can be grouped in the
following way: qScap k capC B kT C , where k cap pS a scap qV cap f is a unidirectional clearance
for transport between blood and tissue, and kT pS a scap qV cap 1 f is a unidirectional
clearance for transport from tissue to blood (Waniewski 2002). 4.1.1 Effective diffusive mass transport parameter At the steady state, the solute flow from the peritoneal cavity to the tissue can be presented in analogy to the membrane models in the following way (Waniewski 2002): JS perit memKBDS C D C B
(18)
36
Progress in Peritoneal Dialysis
where C D and C B are solute concentrations in dialysate and blood, respectively, memKBDS is the effective diffusive mass transport parameter for solute S, and describes the ratio of the equilibrium concentration of solute in the tissue over its concentration in blood and can be calculated as k cap / kT qL . In this case, the effective diffusive mass transport parameter for solute S can be approximated from the formula (Waniewski 2002, 2001):
memKBDS A DT kT qL
(19)
Theoretical values of effective diffusive mass transport parameter derived from the distributed model compared with the experimental values are presented in Figure 4 and in Tables 3 and 4.
memKBDS, ml/min
100.00
10.00
1.00
0.10
0.01 0
20
40
60
80
100
120
rS, Å
Fig. 4. Theoretical values of effective diffusive mass transport parameter derived from the distributed model (solid line, assuming A=1 m2) and the experimental values: * (Rippe and Stelin 1989), + (Kagan et al. 1990),▲ (Imholz et al. 1993), ♦ (Pannekeet et al. 1995), after (Waniewski 2001). Remark 1. If one neglects convective transport across the capillary wall and the tissue lymphatic absorption, the effective diffusive mass transport parameter for solute S can be calculated from a simplified formula (Dedrick et al. 1982): memKBDS A DT pS a
(20)
Remark 2. The important difference between equations (18) and the corresponding equation for diffusive solute transport according to the phenomenological membrane approach is the presence of coefficient in equation (18). Therefore, according to the distributed model (equation (18)), the equilibration level for a solute in dialysate is not its concentration in blood, C B , as it is in the membrane model, but its equilibrium concentration in the tissue C eq C B . In typical physiological conditions of the transport through the capillary wall,
37
Distributed Models of Peritoneal Transport
is close to 1 for small and middle molecules, but substantially lower than 1 for macromolecules (Waniewski 2002, 2001). Therefore, the correction for is practically important only for macromolecules. In this case, the membrane model may underestimate the effective diffusive mass transport parameter. In fact, the equilibrium level for total protein five times lower than blood concentration was observed in experiments in dogs with prolonged accumulation of the lost protein in dialysate (Rubin et al. 1985). The typical values of for proteins are presented in Table 3. Solute β2-microglobulin myoglobin α-globulin albumin transferin haptoglobin IgG α2-macroglobin IgM
MW
Dif , mm
memKBDS , ml/min
11 800 17 000 45 000 68 000 90 000 100 000 150 000 820 000 900 000
0.385 0.465 0.652 0.731 0.746 0.732 0.667 0.529 0.456
0.986 0.961 0.811 0.656 0.475 0.430 0.351 0.277 0.212
1.091 0.704 0.348 0.262 0.212 0.202 0.182 0.144 0.124
Table 3. Solute diffusive penetration depth, Dif , the ratio of the equilibrium concentration of solute in the tissue over its concentration in blood, , and effective diffusive transport parameter, memKBDS , estimated from the distributed model assuming A=1 m2 (Waniewski 2002). 4.1.2 Diffusive solute penetration depth The solute concentration distribution within the tissue (assuming only diffusive transport across the tissue) is described in the steady state by the following equation:
2C 2 C eq C B / Dif x 2
(21)
where C eq is the solute concentration in the tissue at equilibrium, and Dif is diffusive penetration depth given by (Waniewski 2001):
Dif DT / kT qL
(22)
where DT is tissue diffusivity, kT is unidirectional clearance for transport from tissue to blood, and qL is tissue lymphatic absorption. The penetration depth for solutes with different molecular weight is presented in Tables 3 and 4. Remark 1. In the case of purely diffusive transport across the capillary wall and the tissue, and neglected lymphatic absorption from the tissue, one can get a simplified formula Dif DT / pS a (Dedrick et al. 1982), which shows that purely diffusive penetration depth
for solutes depends on the square root of their diffusivity in the tissue divided by their diffusivity across capillary wall.
38
Progress in Peritoneal Dialysis
Remark 2. The diffusive solute penetration depth depends not only on the diffusive properties of both transport barriers. The additional correction for the lymphatic absorption from the tissue, qL , fluid transport across the capillary wall, qV cap , and sieving properties of the capillary wall, scap , should be additionally taken into account resulting in further decrease of the solute penetration depth.
Remark 3. Formula (19) can be transformed to memKBDS A kT qL 1 , which means that
the effective diffusive mass transport parameter for solute transport may be considered, according to the distributed model, as proceeding directly between blood and dialysis fluid across the total capillary wall surface within the tissue layer of the width
1 Dif tanh L / Dif
(where L is tissue width) with the transport parameter equal to
T
k qL , and these capillaries can be considered as immersed directly in dialysis fluid (Waniewski 2002; Waniewski, Werynski, and Lindholm 1999). For small solutes, kT qL is approximately equal to pS a (Waniewski, Werynski, and Lindholm 1999). Remark 4. Formula (19) can be alternatively transformed to memKBDS A DT / 2 indicating that the same solute transport may be considered also as proceeding between blood and dialysis fluid across the tissue layer with solute tissue diffusivity DT and width
2 Dif / tanh L / Dif
without any interference from blood flow in the capillaries
(Waniewski 2002; Waniewski, Werynski, and Lindholm 1999). Remark 5. Note, that for L Dif , 1 2 Dif . 4.1.3 Effective peritoneal blood flow In the context of peritoneal dialysis it is usually assumed that only a relatively thin layer of the tissue that is adjacent to the peritoneal surface participates effectively in the exchange of solutes between dialysate and blood. The rate of blood flow in this layer is called the effective peritoneal blood flow (EPBF). Some investigators attempted to evaluate EPBF using quickly diffusing gases, others considered the gas clearances as an overestimation of EPBF and pointed out the possibility of much lower values for EPBF as well as different EPBF values for solutes of different transport characteristics (Nolph and Twardowski 1989). The effective peritoneal blood flow, EPBF, can be defined according to the distributed model as the blood flow in a tissue layer of the depth equal to the solute penetration depth, that is (Waniewski, Werynski, and Lindholm 1999):
EPBF A qB Dif
(23)
where A is effective peritoneal surface area, qB is perfusion rate (in ml/min/g), and Dif is solute diffusive penetration depth. An alternative approach to the definition of EPBF can be found in (Waniewski, Werynski, and Lindholm 1999; Waniewski 2002). 4.2 Combined diffusive and convective solute transport In this section the relationships between the net diffusive mass transport coefficients for the solute transport between blood and dialysis fluid and the local physiology based transport parameters of distributed models are analyzed for combine diffusive and convective solute
39
Distributed Models of Peritoneal Transport
transport. Inclusion of convective solute transport across the tissue is especially important in the case of macromolecules. In this section, the impact of the convective flow on the solute penetration depth as well on the effective reflection coefficient of peritoneal transport system is analyzed. Remark 1. The effective peritoneal blood flow is different for different solutes, see Table 4. Solute H2 CO2 Urea Creatinine Glucose Sucrose Vitamin B12 Inulin
Dif ,
memKBDS ,
mm 0.68 0.39 0.18 0.18 0.19 0.19 0.21 0.24
ml/min
EPBF , ml/min
269.6 154.6 19.8 14.7 11.6 7.9 4.1 1.9
269.6 154.6 52.7 53.8 55.1 57.7 63.4 71.2
Table 4. Theoretical values of solute penetration depth, diffusive mass transport coefficient, and perfusion rate calculated according to the distributed model assuming perfusion rate qB 0.3 ml/min/g (Waniewski, Werynski, and Lindholm 1999). In the commonly applied phenomenological membrane models, the solute flow from dialysate to blood is typically evaluated using the following equation (Waniewski 2006, 2001): JS KBDS (C D C B ) SJV [(1 F )C D FC B ] ,
(24)
where KBDS is membrane diffusive mass transport coefficient, S is membrane sieving coefficient, jV is fluid flow between blood and dialysate, C B and C D are solute concentrations in blood and dialysate, respectively, and F is a weighing factor for the mean concentration (Waniewski 2001). In order to compare both approaches, one may derive fro distributed model the following expression for solute flow from the peritoneal cavity to the tissue at the steady state (Waniewski 2001): JS perit memKBDS C D C B sT JV 1 f C D f C B .
(25)
where memKBDS DT ( kT qL ) is the effective diffusive transport parameter (see previous
section), k cap / kT qL the
tissue
over
its
describes the ratio of the equilibrium concentration of solute in
concentration
in blood
(see previous
section),
f 0.5 ,
1 Pe 2 / 4 1 / Pe , and Pe sT JV / memKBDS (Waniewski 2001). 4.2.1 Effective sieving coefficient for macromolecules The important difference between phenomenological versus distributed approach (equations (24) and (25)) is the presence of coefficient in equation (25). As it was
40
Progress in Peritoneal Dialysis
discussed in previous section, this parameter is typically close to 1 for small and middle molecules, whereas its values remain substantially lower than 1 for macromolecules (c.f. Table 3). In consequence, the concentration of macromolecules in dialysate equilibrates with their concentration in the tissue equal to C B , instead of that in blood. Equation (25) indicates relationship between effective sieving coefficient for macromolecules and fluid flow direction, which is not present in the membrane model. In general, the sieving coefficient may be measured directly if convective transport is prevailing, i.e. with very high fluid flow, or in isochratic conditions, i.e. during diffusive equilibrium at both sides of the membrane. If the measurement is done using solute concentration in blood as the reference, then the obtained value depends on the direction of fluid flow. Remark 1. For jV perit 0 (i.e. in the direction from peritoneal cavity to the tissue) and Pe 1 (i.e. with convective transport prevailing over diffusive one), then the measured value of sieving coefficient is equal to the sieving coefficient of solute in the tissue, sT , whereas for fluid flux across the tissue in the opposite direction (i.e. jV perit 0 ) and Pe 1 this value is equal to C . 4.2.2 Diffusive vs. convective penetration depth Let us consider the combine diffusive and convective solute transport at the steady state. It can be shown that the solute penetration depth can be calculated in this case as (Waniewski 2001):
Dif 2 Dif 2 Conv 2 / 4 Dif / 2
(26)
where Dif is diffusive penetration depth, equation (22). The convective penetration depth for purely convective solute transport across the tissue, Conv , is defined as:
Conv sT jV / kT qL
(27)
The comparison between the overall penetration depth , and its diffusive and convective components, Dif and Conv , calculated for JV perit 1 ml/min is presented in Table 5. JV perit 1 ml/min is a typical value for the rate of fluid absorption from the peritoneal cavity. Remark 1. For small molecules with prevailing diffusive transport (i.e. Conv / Dif 1 ) the overall solute formula for the penetration depth can be simplified to Dif Conv / 2 (Waniewski 2001). Remark 2. In the case of solutes that are transported mainly by convection Conv (for Conv / Dif 1 ) or, if they cannot penetrate the tissue, 0 (for Conv / Dif 1 ). Remark 3. That penetration depth for small solutes (creatinine) is dominated by the process of diffusion, for middle molecules (inulin, β2-microglobulin) both processes contribute to the depth of solute penetration, and for macromolecules (albumin, IgM) the convective transport prevails, see Table 5.
41
Distributed Models of Peritoneal Transport
Solute
Dif , mm
Conv , mm
, mm
0.25 0.29 0.60 0.71 0.44
0.03 0.19 0.85 2.63 3.40
0.26 0.40 1.15 2.81 3.46
Creatinine Inulin 2-microglobulin Albumin IgM
Table 5. Penetration depth for different transport processes and for different solutes for JV perit 1 ml/min (Waniewski 2001).
5. Kinetics of peritoneal dialysis The phenomenological models of the peritoneal transport such as the three-pore model or the membrane model, describe the kinetic of solute and fluid in the peritoneal cavity (Stachowska-Pietka 2010; Waniewski 2006). Complementary to them, the distributed approach allows for modeling the changes in the tissue, such as space distribution of interstitial hydrostatic pressure, tissue hydration and solute concentration in the tissue (Flessner, Dedrick, and Schultz 1985; Stachowska-Pietka et al. 2006; Waniewski, StachowskaPietka, and Flessner 2009; Flessner 2001). However, due to the complexity of the peritoneal phenomena as well as its high nonlinearity, distributed models are solved numerically for most applications. For example, numerical simulations of a peritoneal distributed model can be performed for a single exchange with hypertonic glucose solution 3.86%, see Figure 5 (Stachowska-Pietka and Waniewski 2011). The infusion of hypertonic solution induces water inflow into adjacent tissue. In consequence, increase of interstitial hydrostatic pressure and tissue hydration (as assessed by fluid void volume) can be observed in the tissue layer close to the peritoneal cavity (about 2.5 mm from the peritoneal surface, Figure 5, left panel) during next minutes and hours whereas the hydration of deeper tissue layers remains unchanged. Glucose diffuses from the peritoneal cavity into the tissue causing increase of glucose concentration in a thin layer of the tissue close to the peritoneal cavity (less than 0.01 cm width), c.f. Figure 5, right panel. at t=1 min at t=30 min at t=120 min at t=360 min
0.34
VOID VOLUME
0.32 0.3 0.28 0.26 0.24 0.22 0.2
CG at t=1 min
160
CG at t=30 min CG at t=120 min
140
CG at t=360 min
120 100 80 60 40 20
0.18 0.16 0
180
GLUCOSE TISSUE CONCENTRATION CG [mmol/L]
0.36
0.05
0.1
0.15 0.2 0.25 DISTANCE X [cm]
0.3
0.35
0.4
0 0
0.05
0.1
0.15 0.2 0.25 DISTANCE X [cm]
0.3
0.35
0.4
Fig. 5. Interstitial fluid void volume ratio, (left panel), and glucose concentration in interstitial fluid, CG (right panel) at t=1, 60, 120, and 360 min. as a function of distance from the peritoneal cavity, X (Stachowska-Pietka and Waniewski 2011).
42
Progress in Peritoneal Dialysis
3400
180
3200
160
GLUCOSE DIALYSATE CONCENTRATION CD,G [mmol/L]
INTRAPERITONEAL VOLUME VD [mL]
Concomitantly to the changes in the tissue hydration and solute concentration, the intraperitoneal fluid volume and glucose concentration change with dwell time, Figure 6 (Stachowska-Pietka and Waniewski 2011). The fluid absorption from the peritoneal cavity and ultrafiltration to the cavity results in the changes of intraperitoneal volume, as observed in clinical studies (Figure 6, left panel). Moreover, due to glucose diffusion into adjacent tissue, its intraperitoneal concentration decreases during the dwell time (Figure 6, right panel). Other results on the kinetics of dialysis according to distributed approach can be found elsewhere (Seames, Moncrief, and Popovich 1990; Flessner, Dedrick, and Schultz 1985, 1984; Flessner 2001; Stachowska-Pietka 2010; Stachowska-Pietka et al. 2005; Stachowska-Pietka, Waniewski, and Lindholm 2010, 2010).
3000 2800 2600 2400 2200 2000 0
60
120
180 240 TIME T [min]
300
360
140 120 100 80 60 40 0
60
120
180 240 TIME T [min]
300
360
Fig. 6. Intraperitoneal volume, VD, (left panel), and glucose concentration in dialysis fluid, CD, (right panel) as function of dwell time T (Stachowska-Pietka and Waniewski 2011).
6. Conclusions Distributed modeling allows for a detailed description of the peritoneal transport system with its real geometry and different characteristics for the main transport barriers of the capillary wall and the tissue (for most solutes of interest: the interstitium). Lymphatic absorption from the tissue, so important for the protein turnover, can also be taken into account. The models are based on the macroscopic approach with continuous distribution of the capillary and lymphatic vessels in the tissue instead of the real discrete system of these vessels. However, they can adequately describe the available data about solute concentrations and hydrostatic pressure inside the tissue during experimental studies on peritoneal dialysis (Stachowska-Pietka et al. 2006; Waniewski, Stachowska-Pietka, and Flessner 2009; Flessner 2001). The distributed approach yields important relationships between the measurable transport parameters that are defined by the membrane models, as the diffusive mass transport parameter, hydraulic conductivity, sieving coefficient, etc., for the description of the net transport between blood and dialysis fluid in the peritoneal cavity, and the fundamental parameters for the description of the transport across the capillary wall, the tissue and lymphatic absorption from the tissue, see Figure 7. These basic local transport parameters are subject to interpatient variability and they can change with time on dialysis that may
43
Distributed Models of Peritoneal Transport
result in serious complications in the treatment. Unfortunately, these local transport characteristics cannot be directly measured in clinical setting and one has to derive their values using mathematical models and the information from animal studies. Some of the basic questions about peritoneal transport, as the width of the tissue layer involved in the exchange of fluid and solutes during peritoneal dialysis and rate of the blood flow that participates in this exchange can be correctly answered only if the local transport coefficients are known. The formulas for the effective transport parameters, penetration depth, effective blood flow, etc., are derived from the model for the steady state transport assuming spatial homogeneity of the transport system, and therefore their application for the real dialysis may be limited for some solutes and dialysis conditions.
Peritoneal Cavity
Effective parameters
Blood
memL P a A K LP a
eff cap / F / memKBDS A DT k T qL
Penetration depths F K / LP a
Dif DT / kT qL
Fig. 7. Simple relationships between the effective peritoneal transport parameters and penetration depths and the local tissue and capillary wall transport parameters: memLP a effective hydraulic conductivity, A – effective peritoneal surface area, K – tissue hydraulic conductivity, LP a - capillary wall hydraulic conductance, eff - effective reflection coefficient, cap - capillary wall reflection coefficient. F - fluid penetration depth, solute penetration depth, memKBDS - effective diffusive transport parameters, DT - solute diffusivity in the tissue, kT - a unidirectional clearance for transport from tissue to blood, qL - tissue lymphatic absorption. Any realistic description of peritoneal dialysis must take into account that the conditions in the peritoneal cavity and in the tissue continuously change with dwell time due to, for example, vasodilatation induced by hyperosmolality of dialysis fluid and overhydration of the tissue induced by increased hydrostatic pressure in the peritoneal cavity. Therefore, computer modeling is necessary for such a theory as shown in Section 5, see also (Stachowska-Pietka 2010). The distributed modeling can be applied for many problems of clinical and experimental interest, and further extensions are possible. For example, the contribution of a cellular compartment in the tissue to the transport of small ions (sodium, potassium) should be taken into account (Coester et al. 2007), and a more detailed structure of the interstitium
44
Progress in Peritoneal Dialysis
need to be proposed to solve the problems with bidirectional transport of macromolecules (Stachowska-Pietka 2010). Nevertheless, the current understanding and quantification of the peritoneal transport obtained using the distributed approach is already a helpful tool in clinical and experimental research.
7. Acknowledgment J. Stachowska-Pietka was supported by a grant N N518 417736 from the Polish Ministry of Science and Higher Education.
8. Nomenclature Symbols A C or CS CB or CB,S CD or CD,S DT or DST K kT L LP a memKBDS memLPa memOsmCond P PB PD pS a s
tissue hydraulic conductivity, cm2/min/mmHg unidirectional clearance for transport from tissue to blood, 1/min tissue width, cm hydraulic conductance of the capillary wall, 1/min/mmHg effective diffusive mass transport coefficient of the PTS, mL/min effective hydraulic conductivity of the PTS, mL/min/mmHg effective osmotic conductance of PTS, (ml/min)/(mmol/l) interstitial hydrostatic pressure, mmHg blood hydrostatic pressure, mmHg intraperitoneal hydrostatic pressure, mmHg diffusive permeability of solute across the capillary wall, 1/min tissue lymphatic absorption, 1/min
qL cap
Parameter effective peritoneal surface area, cm2 solute concentration in the tissue, mmol/l solute concentration in blood, mmol/l solute concentration in dialysate, mmol/l solute diffusivity in the tissue, cm2/min
or sS
cap
sieving coefficient for solute across the capillary wall
sT or sST
sieving coefficient of solute in the tissue
S
interstitial fluid void volume solute void volume
Conv
ratio of the equilibrium concentration of solute in the tissue over its concentration in blood solute overall penetration depth, cm solute convective penetration depth, cm
Dif
solute diffusive penetration depth, cm
F
cap
fluid penetration depth, cm or S
cap
capillary wall reflection coefficient for solute S
Distributed Models of Peritoneal Transport
eff T or ST
45
effective reflection coefficient for PTS tissue reflection coefficient for solute S
9. References An, K. N., and E. P. Salathe. 1976. A theory of interstitial fluid motion and its implications for capillary exchange. Microvasc Res 12 (2):103-19. Baxter, L. T., and R. K. Jain. 1989. Transport of fluid and macromolecules in tumors. I. Role of interstitial pressure and convection. Microvasc Res 37 (1):77-104. ———. 1990. Transport of fluid and macromolecules in tumors. II. Role of heterogeneous perfusion and lymphatics. Microvasc Res 40 (2):246-63. ———. 1991. Transport of fluid and macromolecules in tumors. III. Role of binding and metabolism. Microvasc Res 41 (1):5-23. Cherniha, R., and J. Waniewski. 2005. Exact solutions of a mathematical model fro fluid transport in peritoneal dialysis. Ukrainian Math. Journal 57 (8):1112-1119. Coester, A. M., D. G. Struijk, W. Smit, D. R. de Waart, and R. T. Krediet. 2007. The cellular contribution to effluent potassium and its relation to free water transport during peritoneal dialysis. Nephrol Dial Transplant 22 (12):3593-600. Collins, J. M. 1981. Inert gas exchange of subcutaneous and intraperitoneal gas pockets in piglets. Respir Physiol 46 (3):391-404. Collins, J. M., R. L. Dedrick, M. F. Flessner, and A. M. Guarino. 1982. Concentrationdependent disappearance of fluorouracil from peritoneal fluid in the rat: experimental observations and distributed modeling. J Pharm Sci 71 (7):735-8. Dedrick, R. L., M. F. Flessner, J. M. Collins, and J. S. Schultz. 1982. Is the peritoneum a membrane? ASAIO J 5:1-8. Flessner, M. F. 1994. Osmotic barrier of the parietal peritoneum. Am J Physiol 267 (5 Pt 2):F861-70. ———. 2001. Transport of protein in the abdominal wall during intraperitoneal therapy. I. Theoretical approach. Am J Physiol Gastrointest Liver Physiol 281 (2):G424-37. ———. 2005. The transport barrier in intraperitoneal therapy. Am J Physiol Renal Physiol 288 (3):F433-42. ———. 2009. Intraperitoneal Chemotherapy. In Nolph and Gokal's textbook of peritoneal dialysis, edited by R. Khanna and R. T. Krediet. USA: Springer. Flessner, M. F., J. Choi, H. Vanpelt, Z. He, K. Credit, J. Henegar, and M. Hughson. 2006. Correlating structure with solute and water transport in a chronic model of peritoneal inflammation. Am J Physiol Renal Physiol 290 (1):F232-40. Flessner, M. F., R. L. Dedrick, and J. S. Schultz. 1984. A distributed model of peritonealplasma transport: theoretical considerations. Am J Physiol 246 (4 Pt 2):R597-607. ———. 1985. A distributed model of peritoneal-plasma transport: analysis of experimental data in the rat. Am J Physiol 248 (3 Pt 2):F413-24. ———. 1985. Exchange of macromolecules between peritoneal cavity and plasma. Am J Physiol 248 (1 Pt 2):H15-25.
46
Progress in Peritoneal Dialysis
Flessner, M. F., J. D. Fenstermacher, R. L. Dedrick, and R. G. Blasberg. 1985. A distributed model of peritoneal-plasma transport: tissue concentration gradients. Am J Physiol 248 (3 Pt 2):F425-35. Flessner, M. F., J. Lofthouse, and R. Zakaria el. 1997. In vivo diffusion of immunoglobulin G in muscle: effects of binding, solute exclusion, and lymphatic removal. Am J Physiol 273 (6 Pt 2):H2783-93. Flessner, M., J. Henegar, S. Bigler, and L. Genous. 2003. Is the peritoneum a significant transport barrier in peritoneal dialysis? Perit Dial Int 23 (6):542-9. Gupta, E., M. G. Wientjes, and J. L. Au. 1995. Penetration kinetics of 2',3'-dideoxyinosine in dermis is described by the distributed model. Pharm Res 12 (1):108-12. Imholz, A. L., G. C. Koomen, D. G. Struijk, L. Arisz, and R. T. Krediet. 1993. Effect of dialysate osmolarity on the transport of low-molecular weight solutes and proteins during CAPD. Kidney Int 43 (6):1339-46. Kagan, A., Y. Bar-Khayim, Z. Schafer, and M. Fainaru. 1990. Kinetics of peritoneal protein loss during CAPD: I. Different characteristics for low and high molecular weight proteins. Kidney Int 37 (3):971-9. Leypoldt, J. K. 1993. Interpreting peritoneal membrane osmotic reflection coefficients using a distributed model of peritoneal transport. Adv Perit Dial 9:3-7. Leypoldt, J. K., and L. W. Henderson. 1992. The effect of convection on bidirectional peritoneal solute transport: predictions from a distributed model. Ann Biomed Eng 20 (4):463-80. Nolph, K. D., F. Miller, J. Rubin, and R. Popovich. 1980. New directions in peritoneal dialysis concepts and applications. Kidney Int Suppl 10:S111-6. Nolph, K. D., and Z. J. Twardowski. 1989. The peritoneal dialysis system. In Peritoneal Dialysis, edited by K. D. Nolph. Dordrecht: Kluwer. Pannekeet, M. M., A. L. Imholz, D. G. Struijk, G. C. Koomen, M. J. Langedijk, N. Schouten, R. de Waart, J. Hiralall, and R. T. Krediet. 1995. The standard peritoneal permeability analysis: a tool for the assessment of peritoneal permeability characteristics in CAPD patients. Kidney Int 48 (3):866-75. Patlak, C. S., and J. D. Fenstermacher. 1975. Measurements of dog blood-brain transfer constants by ventriculocisternal perfusion. Am J Physiol 229 (4):877-84. Perl, W. 1962. Heat and matter distribution in body tissues and the determination of tissue blood flow by local clearance methods. J Theor Biol 2:201-235. ———. 1963. An extension of the diffusion equation to include clearance by capillary blood flow. Ann N Y Acad Sci 108:92-105. Piiper, J., R. E. Canfield, and H. Rahn. 1962. Absorption of various inert gases from subcutaneous gas pockets in rats. J Appl Physiol 17:268-74. Rippe, B., and G. Stelin. 1989. Simulations of peritoneal solute transport during CAPD. Application of two-pore formalism. Kidney Int 35 (5):1234-44. Rubin, J., T. Adair, Q. Jones, and E. Klein. 1985. Inhibition of peritoneal protein losses during peritoneal dialysis in dogs. ASAIO J 8:234-237. Seames, E. L., J. W. Moncrief, and R. P. Popovich. 1990. A distributed model of fluid and mass transfer in peritoneal dialysis. Am J Physiol 258 (4 Pt 2):R958-72.
Distributed Models of Peritoneal Transport
47
Stachowska-Pietka, J. 2010. Mathematical modeling of ultrafiltration and fluid absorption during peritoneal dialysis. PhD Thesis, Institute of Biocybernetics and Biomedical Engineering Polish Academy of Sciences, Warsaw. Stachowska-Pietka, J., and J. Waniewski. 2011. Distributed modeling of glucose induced osmotic fluid flow during single exchange with hypertonic glucose solution. Biocybernetics and Biomedical Engineering 31 (1):39-50. Stachowska-Pietka, J., J. Waniewski, M. F. Flessner, and B. Lindholm. 2006. Distributed model of peritoneal fluid absorption. Am J Physiol Heart Circ Physiol 291 (4):H186274. ———. 2007. A distributed model of bidirectional protein transport during peritoneal fluid absorption. Adv Perit Dial 23:23-7. Stachowska-Pietka, J., J. Waniewski, M. Flessner, and B. Lindholm. 2005. A mathematical model of peritoneal fluid absorption in the tissue. Adv Perit Dial 21:9-12. Stachowska-Pietka, J., J. Waniewski, and B. Lindholm. 2010. Bidirectional transport of fluid and protein during peritoneal dialysis assessed by distributed model with structured interstitium. Perit Dial Int 30 (Suppl. 2):S44. ———. 2010. Integrated distributed model of fluid and solute transport during peritoneal dialysis. Perit Dial Int 30 (Suppl. 1):S20. Taylor, D. G., J. L. Bert, and B. D. Bowen. 1990. A mathematical model of interstitial transport. I. Theory. Microvasc Res 39 (3):253-78. Van Liew, H. D. 1968. Coupling of diffusion and perfusion in gas exit from subcutaneous pocket in rats. Am J Physiol 214 (5):1176-85. Venturoli, D., and B. Rippe. 2001. Transport asymmetry in peritoneal dialysis: application of a serial heteroporous peritoneal membrane model. Am J Physiol Renal Physiol 280 (4):F599-606. Waniewski, J. 2001. Physiological interpretation of solute transport parameters for peritoneal dialysis. J Theor Med 3:177-190. ———. 2002. Distributed modeling of diffusive solute transport in peritoneal dialysis. Ann Biomed Eng 30 (9):1181-95. ———. 2006. Mathematical modeling of fluid and solute transport in hemodialysis and peritoneal dialysis. J Mem Sci 274:24-37. Waniewski, J., V. Dutka, J. Stachowska-Pietka, and R. Cherniha. 2007. Distributed modeling of glucose-induced osmotic flow. Adv Perit Dial 23:2-6. Waniewski, J., J. Stachowska-Pietka, and M. F. Flessner. 2009. Distributed modeling of osmotically driven fluid transport in peritoneal dialysis: theoretical and computational investigations. Am J Physiol Heart Circ Physiol 296 (6):H1960-8. Waniewski, J., A. Werynski, and B. Lindholm. 1999. Effect of blood perfusion on diffusive transport in peritoneal dialysis. Kidney Int 56 (2):707-13. Wientjes, M. G., R. A. Badalament, R. C. Wang, F. Hassan, and J. L. Au. 1993. Penetration of mitomycin C in human bladder. Cancer Res 53 (14):3314-20. Wientjes, M. G., J. T. Dalton, R. A. Badalament, J. R. Drago, and J. L. Au. 1991. Bladder wall penetration of intravesical mitomycin C in dogs. Cancer Res 51 (16):4347-54.
48
Progress in Peritoneal Dialysis
Wiig, H., M. DeCarlo, L. Sibley, and E. M. Renkin. 1992. Interstitial exclusion of albumin in rat tissues measured by a continuous infusion method. Am J Physiol 263 (4 Pt 2):H1222-33. Zakaria, E. R., J. Lofthouse, and M. F. Flessner. 1999. In vivo effects of hydrostatic pressure on interstitium of abdominal wall muscle. Am J Physiol 276 (2 Pt 2):H517-29. ———. 2000. Effect of intraperitoneal pressures on tissue water of the abdominal muscle. Am J Physiol Renal Physiol 278 (6):F875-85.
3 Membrane Biology During Peritoneal Dialysis Kar Neng Lai1 and Joseph C.K. Leung2
2Division
1Nephrology Centre, Hong Kong Sanatorium and Hospital, of Nephrology, Department of Medicine, Queen Mary Hospital, University of Hong Kong, Hong Kong
1. Introduction Peritoneal dialysis (PD) is a life-supporting renal replacement therapy used by 10-15% of patients with end-stage renal failure worldwide. The success of long-term PD depends entirely on the longevity and integrity of the peritoneal membrane. The peritoneum is covered by a mesothelial monolayer beneath which is a basement membrane and submesothelial layer that contains collagen, fibroblasts, adipose tissue, blood vessels and lymphatics. During PD, peritoneal cells are repeatedly exposed to a non-physiological hypertonic environment with high glucose content and low pH. Mesothelial cells (MCs) play an important role in regulating the inflammatory response in the peritoneal cavity: they produce pro-inflammatory cytokines and chemoattractants. By secreting these chemokines or cytokines, MCs contribute to the recruitment of leukocytes following the expression of adhesion molecules. Chronic changes in the peritoneum with fibrosis develop after years of peritoneal dialysis. The most marked changes are in cases of severe and recurrent peritonitis. Others have made similar observations that long-term exposure to peritoneal dialysis solutions appears to increase fibrosis and the probability of ultrafiltration failure. Encapsulating peritoneal sclerosis represents the most severe and fatal complication of membrane failure. Conventional peritoneal dialysis fluids (PDFs) make use of the osmotic gradient generated by glucose. Years of exposure to PDFs compounded with peritonitis result in the formation of an avascular layer of interstitial matrix and plasma proteins in the sub-mesothelial compact zone and an epithelial-to-mesenchymal transition (EMT) of mesothelial cells [1]. The fibrotic process in the peritoneal membrane is developed following acute and chronic release of inflammatory mediators related to PD. Independent extrinsic and intrinsic events (Table 1) contribute to chronic inflammation in patients on PD leading to complications including peritoneal membrane ultrafiltration failure, fluid overload, protein energy wasting and even atherosclerosis.
2. Extrinsic factors 2.1 Uremia It has been shown that the peritoneum of uremic and current hemodialysis patients who have never exposed to PD is abnormal as well; this finding implies that uremia induces inflammation in the peritoneum [2]. There is a marked increase in vasculopathy below the compact zone.
50
Progress in Peritoneal Dialysis
Extrinsic Factors Uremia PDFs Infections – especially peritonitis Intrinsic Factors Mesothelium Sub-mesothelial compact zone Sub-mesothelial blood vessels Epithelial-to-mesenchymal transition (EMT) Receptors for GDPs and AGE Macrophages Peritoneal adipocytes Table 1. Events promoting chronic inflammation in PD 2.2 Peritoneal Dialysis Fluids (PDFs) D-glucose is a reactive compound that exerts effect on the mesothelial cells directly by upregulating the synthesis of transforming growth factor- (TGF-) and connective tissue growth factor by MCs or through its degradation pathway into glucose degradation products (GDPs) and formation of advanced glycation end-products (AGEs). Exposure to GDPs leads to enhanced cytotoxic damage and pro-inflammatory response in MCs stimulating the production of vascular endothelial growth factor (VEGF) that enhances vascular permeability and angiogenesis. GDPs also down-regulate the expression of intercellular tight junction proteins like ZO-1, occludine and claudin-1 in MCs, again via VEGF [3]. Factors such as the buffer, glucose or GDPs formed during heat sterilization, are critical in determining the biocompatibility of different PDFs. Mesothelial cell repair (remesothelialization) after exposure to GDPs is impaired, independent of D-glucose concentration. After exposure of mesenchymal cells to PDFs, the expression of cytokeratin 18 and E-cadherin is reduced while the expression of -SMA and vimentin as a sign of EMT is increased [4]. Expression of intercellular tight junction proteins is down-regulated after incubation with PDFs. 2.3 Infection Bacterial peritonitis is associated with a sharp increase in total cell and neutrophil counts (400-fold) in PDFs up to 2-3 weeks after peritonitis despite clinical remission [5]. There was a progressive increase in the percentage of mesothelial cells or dead cells in the total cell population in PDFs. Dialysate levels of interleukin-1β (IL-1β), interleukin-6 (IL-6), tumor necrosis factor-Fand TGF- increased markedly on day 1 before their levels decreased gradually [5,6]. This active release of pro-inflammatory cytokines and sclerogenic growth factors may continue some time despite clinical remission of peritonitis. The peritoneal cytokine networks after peritonitis may potentially affect the physiological properties of the peritoneal membrane [5].
3. Intrinsic factors 3.1 Mesothelium Peritoneal mesothelial cells are biologically active and play distinctive biological roles other than local host defense [3]. The MCs are sensitive to the effect of pH despite the
Membrane Biology During Peritoneal Dialysis
51
conventional PDFs are usually buffered from pH of 5.2–7.4 in 15–30 min in clinical studies while TGF- production by MCs is less with bicarbonate-buffered PDF. Glucose in the PDF can bring about major changes in the environment of the mesothelial cells as well as that of the cells underlying the mesothelium and the production of various cytokines are increased as a result of this exposure (Table 2). The peritoneal membrane also synthesizes prosteoglycans, expresses AGE receptors and produces aquaporins [3,7]. It is noteworthy that glucose may exert little effect on the synthesis of specific mediators, such as VEGF yet its synthesis is greatly enhanced by GDPs or AGE. Serial peritoneal biopsy study shows denudation of the mesothelial monolayer as early as six months after maintenance PD.
Synthesis of chemokines: MCP-1, RANTES, Interferon-inducible protein-10 Synthesis of fibrogenic cytokines – TGF-, bFGF Synthesis of prosteoglycans Induction of angiogenesis – VEGF Expression of AGE receptors
Table 2. Biological role of peritoneal mesothelium 3.2 Sub-mesothelial compact zone After years of continuous peritoneal dialysis, a good percentage of patients would have marked increase in the thickness of the submesothelial compact zone. The layer resembles scar tissue with a relatively amorphous, avascular appearance. Animal studies reveal that a spotty inflammation is detected at different places of the peritoneum in the first few weeks of exposure to PDF. With time, these areas of inflammation and sclerosis gradually coalesce and become more uniform to cover much of the peritoneum that is in contact with the PDF. As the fibrosis becomes more uniform, the patient will gradually lose ultrafiltration. 3.3 Sub-mesothelial blood vessels In parallel with fibrosis, the peritoneum shows a progressive increase in capillary number (angiogenesis) and vasculopathy, which are involved in both the elevation of small solute transport across the peritoneal membrane and ultrafiltration failure. GDPs stimulate VEGF production by MCs [8]. Local production of VEGF during PD appears to play a central role in the processes leading to peritoneal neo-angiogenesis and functional decline. The changes in the structure of the peritoneal function over time on PD as found in functional tests has been confirmed in biopsy studies performed on patients [2]. These show both neoangiogenesis and fibrosis as the underlying morphological changes contributing to these phenomena. As mentioned previously, uptake of the glucose by sub-mesothelial blood vessels will be quite rapid following increased permeability due to abnormal angiogenic vessels and the increased surface area of the microvasculature. This results in dissipation of the osmotic driving force through increased area and solute transport. In addition, disruption of intercellular tight junction in MCs may occur following down-regulation of ZO-1 expression in which VEGF plays an important role [3,8]. 3.4 Epithelial-to-mesenchymal transition (EMT) Chronic exposure of the mesothelium to sterile PDFs may result in an EMT. Local inflammation and oxidative stress, which results from the continuous peritoneal injury,
52
Progress in Peritoneal Dialysis
accelerate the EMT of peritoneal mesothelial cells resulting in peritoneal fibrosis and ultrafiltration failure. EMT is a process by which the MCs undergo a progressive loss of epithelial phenotype and acquire fibroblast-like characteristics, which allows these cells to invade the mesothelial stroma contributing to angiogenesis, fibrosis and ultrafiltration failure. Yanez-Mo et al. [9] recovered and cultured human MCs from the spent dialysate of 54 stable patients. Eighty-five percent of these patients had no previous peritonitis. Omental fibroblasts were separated from three of omental MCs samples from 39 CAPD patients. There was a transition from an epithelial type of mesothelial cell to a fibroblast-like cell with loss of normal markers of the mesothelium and phenotypic changes following progressive and continuous exposure to PDFs. For patients who were exposed to dialysate for more than 12 months, their mesothelial cells changed from 75% cobblestone phenotype to less than 30% with the remainder being fibroblast-like. In some patients they observed that in less than 9 months there was loss of cytokeratin in the mesothelial cell layer. These findings suggest chronic exposure to the peritoneum to the current glucose-based PDFs could lead to morphologic and phenotypic changes in the mesothelium with 24 months. Transforming growth factor-, more specifically TGF-1, is one of the main mediators of the PD solutions’ profibrotic effects through the Smads 2 and 3 pathways. These effects include fibroblast activation, collagen deposition, inhibition of fibrinolysis, maintenance of fibrosis and neoangiogenesis [3]. Acting through the Smad pathway, TGF- induces -catenin formation which in conjunction with Activator Protein-1 activates matrix metalloproteinase9 expression facilitating the invasion of the extracellular matrix [10]. Interestingly, angiotensin II inhibitors (which are TGF- activity suppressors) have recently been shown to reduce peritoneal fibrosis and neoangiogenesis, as well as to prevent the increase of small solute transport in long-term PD patients [11]. Non-viral microbubble-delivery of Smad7 transgene markedly abolishes the peritoneal fibrosis induced by glucose-containing PDF [12]. Neutrophil gelatinase-associated lipocalin (NGAL) is specifically induced in human peritoneal MCs by interleukin-1. Leung et al. [13] demonstrated that incubation of human peritoneal MCs with recombinant NGAL reversed the TGF--induced up-regulation of Snail and vimentin but rescued the down-regulation of E-cadherin. Their in vitro data suggest that NGAL may exert a protective effect in modulating the EMT activated following peritonitis. Lately, Bajo et al. [14] demonstrated a clear association between GDPs present in conventional heat-sterilized PDFs and the induction of EMT in the peritoneal membrane. To date, no study has investigated the direct correlation between the inflammatory environment created as a consequence of recurrent peritonitis episodes and EMT, but many of the inflammatory cytokines known to be involved in driving EMT such as IL-1β, tumor necrosis factor- (TNF-α) and TGF-β are present at high concentrations within the peritoneal membrane during peritonitis, and more importantly perhaps, the levels of these cytokines may remain elevated after the acute inflammatory response has subsided [5]. Clearly, the constant exposure of the mesothelial cells to increased levels of inflammatory cytokines and growth factors that have a known role to play in driving EMT could significantly increase the process of EMT-driven membrane fibrosis. In their study, Bajo et al. [14] reported no correlation between number of previous peritonitis episodes and mesothelial cell EMT observed in these patients; however, their results do suggest that the severity and duration of the peritonitis episode may supersede the protective effects of the low-GDP PDFs.
Membrane Biology During Peritoneal Dialysis
53
3.5 Receptors for GDPs and AGE AGEs have been detected immunohistochemically in the peritoneum of PD patients. Receptor for advanced glycation end-products (RAGE) is the best characterized signal transduction receptor for AGEs. Primarily binding of AGEs to their receptor was regarded as a scavenger receptor involved in AGE removal and AGE clearance. However, ligand binding to RAGE results in an activation of key signal transduction pathways, such as NFB and multiple cellular signaling cascades like activation of MAP kinase. Local interaction between RAGE and AGEs/GDPs leads to the development of peritoneal inflammation, neoangiogenesis and, finally, fibrosis. Anti-RAGE antibody partially prevents the development of submesothelial and interstitial fibrosis and EMT in an animal model of peritoneal fibrosis [15]. Aminoguanidine (AG) prevents formation of AGE. Supplementation of AG to PDF showed inhibitory effects on peritoneal AGE accumulation, mesothelial denudation, submesothelial monocyte infiltration, peritoneal permeability and ultrafiltration, and preserved the functional capacity of peritoneal macrophages in the rat. PDF-induced fibrosis was significantly reduced by AG [16]. The use of AG in human is limited by its pH and toxicity. It is now evident that RAGE is much more than a single receptor for AGEs or a scavenger receptor; it has a broad repertoire of ligands. The key pathophysiological step seems to be GDP-dependent AGE formation in the uremic milieu, through which an enhanced expression of RAGE in the peritoneum could be observed. Recently, other AGE receptors, including AGE-R-1 (p 60), AGE-R-2 (p 90) and AGE-R-3 (gallectin-3) are also found to be expressed on MCs [17]. Different GDPs exert differential regulation on the regulation and expression of these receptors on human peritoneal MCs [17]. However, the functional significance of these various forms has not yet been completely delineated. 3.6 Macrophages Resident macrophages increase markedly with bacterial peritonitis and are able to enhance the release of peroxide and pro-inflammatory cytokines including interleukin-1β and TNF. TGF- complementary DNA (cDNA) molecules per macrophage are significantly greater than those of macrophages in non-infective PDFs throughout the peritonitis period [5]. There was no significant correlation between PDFs levels of TGF- and TGF- cDNA molecules per macrophage, suggesting that peritoneal macrophages are not the predominant source of TGF- in PDFs.
4. The “less recognized” inflammatory role of peritoneal adipocytes in PD Adipose tissue is abundant in omental or mesenteric peritoneum but less so in parietal, intestinal and diaphragmatic peritoneum. Contrary to the prevailing view that adipose tissue functions only as an energy storage depot, compelling evidence reveals that adipocytes can mediate various physiological processes through secretion of an array of mediators and adipokines that include leptin, adiponectin, resistin, TNF-, IL-6, TGF-, VEGF and other growth factors [18]. Moreover, adipocytes express receptors for leptin, insulin growth factor-1 (IGF-1), TNF-, IL-6, TGF- and may form a network of local autocrine, paracrine and endocrine signals [19]. All of these adipokines exert important endocrine functions in chronic kidney diseases and may also contribute to systemic inflammation in these patients. This is of special significance in patients undergoing PD as
54
Progress in Peritoneal Dialysis
the initiation of treatment is often associated with an increase in fat mass that could be associated with the genetic effect on energy metabolism in addition to glucose absorption from the PDFs [20]. A recent study indicates that an increased fat mass in PD, like in other patient groups, may indeed have adverse metabolic consequences with increased systemic inflammation and worst survival [21]. Interestingly, there is a difference in the release of growth factors between visceral and subcutaneous adipose tissue [22]. The omental adipose tissue, most affected by PD, releases IL-6 two to three folds higher than the subcutaneous fat tissue [23]. The visceral (truncal) fat mass correlates significantly with circulating IL-6 levels but not for non-truncal fat mass [24]. Ultrastructural study reveals that a portion of omental adipocytes protrude from the mesothelial surface, thus may come into direct contact with dialysate [25]. In addition, dialysate may also reach the parietal adipose tissue when the mesothelial monolayer is damaged. It is therefore logical to postulate that with repeated exposure to PDFs and the continuous change in peritoneal physiology during PD, peritoneal adipocytes will inevitably be "activated". Although much work has focused on peritoneal mesothelial cells, scant attention has been paid to the role of peritoneal adipocytes during PD.
5. Crosstalk between peritoneal cells and adipocytes Leptin is a peptide hormone mainly derived from adipocytes and is cleared principally by the kidney. The serum leptin concentration is increased in patients with chronic renal failure or undergoing dialysis [26,27] and the serum leptin increases by 189% within a month after the initiation of PD treatment [28]. Leptin is also elevated during acute infection, in response to proinflammatory cytokines including IL-1 and TNF- [26]. In the kidney, leptin stimulates cell proliferation and synthesis of collagen IV and TGF- in glomerular endothelial cells. In glomerular mesangial cells, leptin increases the glucose transport, upregulates the expression of TGF- type II receptor and the synthesis of collagen I through phosphatidylinositol-3-kinase related pathway [26]. Available data suggests that leptin triggers a paracrine interaction between glomerular endothelial and mesangial cells through the increased synthesis of TGF- in glomerular endothelial cells and upregulated TGF- receptor expression in mesangial cells. Whether such paracrine interaction is operating between peritoneal adipocytes and MCs remains to be explored. To the best of our knowledge, there is only one previous study on the effect of PDF on adipocytes that demonstrates increased leptin synthesis in a murine adipocyte cell line (3T3-L1) by glucosecontaining PDFs [29]. It is likely that proinflammatory mediators released by MCs upon exposure to PDF could induce functional alteration of adjacent adipocytes. The likely candidates are IL-1 and TNF-, TGF-, VEGF and IL-6. Indeed, a recent in vitro study has shown that IL-6 modulates leptin production and lipid metabolism in human adipose tissue [30]. Using MC and adipocyte cell cultures established in our laboratory, we have shown that high glucose content in dialysate fluid is one of the major culprits that causes structural and functional abnormalities in peritoneal cells during PD [8,31,32]. Glucose significantly increases the protein synthesis of leptin by adipocytes in a dose-dependent manner and upregulates the expression of leptin receptor, Ob-Rb, in MCs [31]. The increased leptin production by adipocytes and enhanced Ob-Rb expression in MC following exposure to glucose suggest the existence of a cross-talk mechanism between adipocytes and MCs that may be relevant in peritoneal membrane dysfunction developed during peritoneal dialysis.
Membrane Biology During Peritoneal Dialysis
55
6. Persistent release of proinflammatory mediators in patients under maintenance PD or after an episode of peritonitis Patients on maintenance PD have increased intra-peritoneal levels of hyaluronan and cytokines including IL-1, IL-6 and TGF- [33,34]. Chronic inflammation remains an important cause of morbidity in patients with end-stage renal failure. The main causes for inflammation in PD patients are PD-related peritonitis, continuous exposure to dialysis solutions and exit site infection [35]. Patients on PD with peritonitis may experience prolonged inflammation even when clinical evaluation suggests resolution of PD-related peritonitis [5]. The highly sensitive C-reactive protein remains significantly higher than baseline even by day 42 after an episode of peritonitis [36]. A longitudinal study conducted in patients treated for PD-related peritonitis also revealed elevation of serum leptin levels during acute peritonitis. The rise was contributed to anorexia in the earlier stage. In contrast, the serum adiponectin levels fell showing an inverse correlation between these two adipokines during acute peritonitis. Furthermore, the protracted course of inflammation even after bacterial cure of peritonitis was likely to cause the loss of lean body mass and to increase mortality [36].
7. Clinical syndrome of chronic inflammation in PD The above-mentioned dialysis risk factors and certain PD-specific characteristics are associated with the inflammatory burden possibly linking inflammation, increased peritoneal solute transport rate and declined residual renal function to poor outcome. Both local (intra-peritoneal) and systemic inflammation may additively be the cause and consequence of peritoneal membrane failure, and are important prognosticators of mortality in PD patients. Several factors deserve special emphasis. It has been shown that even with apparent clinical remission of PD-related peritonitis, dialysis patients, after an episode of peritonitis, may still be affected by prolonged systemic chronic inflammation. The significantly prolonged inflammation contributed to a poorer nutritional status and higher mortality [36]. The finding is consistent with our previous study that the level of cytokines in the peritoneal effluent remained higher than that in non-infective effluent throughout the 6week post-peritonitis period in parallel with elevated serum C reactive protein (CRP), despite clinical remission [5]. One-sixth of these patients with prolonged elevation of serum CRP died of a cardiovascular event over a median period of 17 months [37]. Therefore, the prolonged inflammation is likely to potentiate atherogenesis and increase the risk of cardiovascular events. Other than persistent low-grade inflammation, subclinical malnutrition may be another factor for the high mortality in these patients. Chronic inflammation with atherosclerosis is closely related to malnutrition, forming the malnutrition–inflammation–atherosclerosis (MIA) syndrome [37]. The underlying mechanism for malnourishment is likely to be multifactorial. Possible contributory factors include protein loss in the dialysate, the feeling of fullness due to PDF in abdomen, uremia-associated cachexia caused by leptin signaling through the hypothalamic melanocortin receptor [38], and protein energy wasting. The complications of membrane failure and fluid overload further enhance a higher incidence of cardiovascular events. Our proposal of a hypothetical mechanism of chronic inflammation in PD is shown in Figure 1.
56
Progress in Peritoneal Dialysis
non-infective
Inflammatory stimuli
Peritonitis-related Peritonitis
Uremia Dialysate pH, peroxide, glucose GDPs, AGE Infections
Acute inflammation Release of cytokine: leptin, IL-6, TNF- CRP and suppression of adiponectin
mesothelial layer
Prolonged inflammation via VEGF
via TGF- Sub-mesothelial compact zone
Epithelial-tomesenchymal transition
CRP Pre-albumin Neoangiogenesis Dissipate the osmotic driving force through increased area and solute transport
Decrease of effective osmotic pressure
Atherogenesis
Poor appetite Malnutrition
Loss of ultrafiltration Fluid overload Decline of residual renal function
Cardiovascular risk
Increased morbidity
Fig. 1. Interactions between peritonitis-related and non-infective factors leading to chronic inflammation and increased morbidity in peritoneal dialysis patients
8. Newer osmotic agents in PDFs Low-GDP PDFs clearly have an advantage over high GDP solutions [14,39]. But the continued presence of glucose remains a significant problem for the cells. Alternative hypertonic agents with additive that may prevent chronic inflammation will continue to be a subject of research.
Membrane Biology During Peritoneal Dialysis
57
9. Conclusion During long-term maintenance PD, the peritoneal biology changes with chronic exposure to dialysate. Meticulous attention for chronic inflammation should be practiced in peritoneal dialysis patients, especially following peritonitis. Adequate nutritional support and screening for persistent inflammation are warranted such that the vicious circle like malnutrition–inflammation–atherosclerosis syndrome can be abolished.
10. Acknowledgement Part of the work described in this paper was supported by the Baxter Extramural Grant and L & T Charitable Foundation & the House of INDOCAFE
11. References [1] McLoughlin RM, Toply N. Switching on EMT in the peritoneal membrane: considering the evidence. Nephrol Dialy Transplant 2011; 26: 12-15. [2] Williams JD, Craig KJ, Topley N, Von Ruhland C, Fallon M, Newman GR, Mackenzie RK, Williams GT. Peritoneal Biopsy Study Group: Morphologic changes in the peritoneal membrane of patients with renal disease. J Am Soc Nephrol 2002; 13: 470– 479. [3] Lai KN, Tang SC, Leung JC. Mediators of inflammation and fibrosis. Perit Dial Int 2007; Suppl 2: S65-71. [4] Oh EJ, Ryu HM, Choi SY, Yook JM, Kim CD, Park SH, Chung HY, Kim IS, Yu MA, Kang DH, Kim YL. Impact of low glucose degradation product bicarbonate/lactatebuffered dialysis solution on the epithelial-mesenchymal transition of peritoneum. Am J Nephrol. 2010; 31:58-67. [5] Lai KN, Lai KB, Chan TM, Lam CW, Li FK, Leung JCK. Changes of cytokine profile during peritonitis in patients on continuous ambulatory peritoneal dialysis. Am J Kidney Dis 2000; 35: 644-652. [6] Zemel D, Koomen GCM, Hart, AAM, TenBerge RJM, Struijk DG, Krediet RT. Relationship of TNFalpha, interleukin-6, and prostaglandins to peritoneal permeability for macromolecules during longitudinal follow-up of peritonitis in continuous ambulatory peritoneal dialysis. J Lab Clin Med 1993;122:686-696 [7] Lai KN, Lam MF, Leung JC. Peritoneal function: the role of aquaporins. Perit Dial Int 2003; Suppl 2: S20-25. [8] Leung JC, Chan LY, Li FF, Tang SC, Chan KW, Chan TM, Lam MF, Wieslander A, Lai KN. Glucose degradation products downregulate ZO-1 expression in human peritoneal mesothelial cells: the role of VEGF. Nephrol Dial Transplant 2005; 20: 1336-1349. [9] Yanez-Mo M, Lara-Pezzi E, Selgas R, Ramirez-Huesca M, Dominguez-Jimenez C, Jimenez-Heffernan JA, Aguilera A, Sánchez-Tomero JA, Bajo MA, Alvarez V, Castro MA, del Peso G, Cirujeda A, Gamallo C, Sánchez-Madrid F, López-Cabrera M. Peritoneal dialysis and epithelialto-mesenchymal transition of mesothelial cells. N Engl J Med 2003; 348:403–413.
58
Progress in Peritoneal Dialysis
[10] Selgas R, Bajo A, Jiménez-Heffernan JA, Sánchez-Tomero JA, Del Peso G, Aguilera A, López-Cabrera M. Epithelial-to-mesenchymal transition of the mesothelial cell—its role in the response of the peritoneum to dialysis. Nephrol Dial Transplant. 2006; 21 (Suppl 2): S2-S7. [11] Kolesnyk I, Noordzij M, Dekker FW, Boeschoten EW, Krediet RT. A positive effect of AII inhibitors on peritoneal membrane function in long-term PD patients. Nephrol Dial Transplant 2009; 24:272-277. [12] Guo H, Leung JC, Lam MF, Chan LY, Tsang AW, Lan HY, Lai KN. Smad7 transgene attenuates peritoneal fibrosis in uremic rats treated with peritoneal dialysis. J Am Soc Nephrol 2007; 18: 2689-2703. [13] Leung JC, Lam MF, Tang SC, Chan LY, Tam KY, Yip TP, Lai KN. Roles of neutrophil gelatinase-associated lipocalin in continuous ambulatory peritoneal dialysis-related peritonitis. J Clin Immunol 2009; 29:365-378 [14] Bajo MA, Pérez-Lozano ML, Albar-Vizcaino P, del Peso G, Castro MJ, Gonzalez-Mateo G, Fernández-Perpén A, Aguilera A, Sánchez-Villanueva R, Sánchez-Tomero JA, López-Cabrera M, Peter ME, Passlick-Deetjen J, Selgas R. Low GDP peritoneal dialysis fluid ('balance') has less impact in vitro and ex vivo on epithelial-to-mesenchymal transition (EMT) of mesothelial cells than a standard fluid. Nephrol Dial Transplant 2011; 26:282-291. [15] De Vriese AS, Tilton RG, Mortier S, Lameire NH. Myofibroblast transdifferentiation of mesothelial cells is mediated by RAGE and contributes to peritoneal fibrosis in uraemia. Nephrol Dial Transplant 2006 21: 2549-2555. [16] Zareie M, Tangelder GJ, ter Wee PM, Hekking LH, van Lambalgen AA, Keuning ED, Schadee-Eestermans IL, Schalkwijk CG, Beelen RH, van den Born J. Beneficial effects of aminoguanidine on peritoneal microcirculation and tissue remodelling in a rat model of PD. Nephrol Dial Transplant 2005; 20:2783-2792. [17] Lai KN, Leung JC, Chan LY, Li FF, Tang SC, Lam MF, Lam MF, Tse KC, Yip TP, Chan TM, Wieslander A, Vlassara H. Differential expression of receptors for advanced glycation end-products in peritoneal mesothelial cells exposed to glucose degradation products. Clin Exp Immunol 2004 138: 466-475 [18] Friedman JM. Obesity in the new millennium. Nature 2000; 404:632-634. [19] Myers MG, Jr. Leptin receptor signaling and the regulation of mammalian physiology. Recent Prog Horm Res 2004; 59:287-304. [20] Nordfors L, Heimburger O, Lonnqvist F, et al. Fat tissue accumulation during peritoneal dialysis is associated with a polymorphism in uncoupling protein 2. Kidney Int 2000; 57:1713-1719 [21] Araujo IC, Kamimura MA, Draibe SA, et al. Nutritional parameters and mortality in incident hemodialysis patients. J Ren Nutr 2006; 16:27-35 [22] Fain JN, Madan AK, Hiler ML, Cheema P, Bahouth SW. Comparison of the release of adipokines by adipose tissue, adipose tissue matrix, and adipocytes from visceral and subcutaneous abdominal adipose tissues of obese humans. Endocrinology 2004; 145:2273-2282
Membrane Biology During Peritoneal Dialysis
59
[23] Mohamed-Ali V, Goodrick S, Rawesh A, et al. Subcutaneous adipose tissue releases interleukin-6, but not tumor necrosis factor-alpha, in vivo. J Clin Endocrinol Metab 1997; 82:4196-4200 [24] Axelsson J, Rashid Qureshi A, Suliman ME, et al. Truncal fat mass as a contributor to inflammation in end-stage renal disease. Am J Clin Nutr 2004; 80:1222-1229. [25] Di Paolo N, Sacchi G. Atlas of peritoneal histology. Perit Dial Int 2000; 20 Suppl 3:S5-96 [26] Wolf G, Chen S, Han DC, Ziyadeh FN. Leptin and renal disease. Am J Kidney Dis 2002; 39:1-11 [27] Fruhbeck G, Gomez-Ambrosi J, Muruzabal FJ, Burrell MA. The adipocyte: a model for integration of endocrine and metabolic signaling in energy metabolism regulation. Am J Physiol Endocrinol Metab 2001; 280:E827-847 [28] Kim DJ, Oh DJ, Kim B, et al. The effect of continuous ambulatory peritoneal dialysis on change in serum leptin. Perit Dial Int 1999; 19 Suppl 2:S172-175 [29] Teta D, Tedjani A, Burnier M, Bevington A, Brown J, Harris K. Glucose-containing peritoneal dialysis fluids regulate leptin secretion from 3T3-L1 adipocytes. Nephrol Dial Transplant 2005; 20:1329-1335 [30] Trujillo ME, Sullivan S, Harten I, Schneider SH, Greenberg AS, Fried SK. Interleukin-6 regulates human adipose tissue lipid metabolism and leptin production in vitro. J Clin Endocrinol Metab 2004; 89:5577-5582 [31] Leung JC, Chan LY, Tang SC, Chu KM, Lai KN. Leptin induces TGF-beta synthesis through functional leptin receptor expressed by human peritoneal mesothelial cell. Kidney Int 2006; 69:2078-2086 [32] Leung JC, Chan LY, Tam KY, et al. Regulation of CCN2/CTGF and related cytokines in cultured peritoneal cells under conditions simulating peritoneal dialysis. Nephrol Dial Transplant 2009; 24:458-469. [33] Lai KN, Szeto CC, Lai KB, Lam CW, Chan DT, Leung JC. Increased production of hyaluronan by peritoneal cells and its significance in patients on CAPD. Am J Kidney Dis 1999; 33:318-324 [34] Lai KN, Lai KB, Szeto CC, Lam CW, Leung JC. Growth factors in continuous ambulatory peritoneal dialysis effluent. Their relation with peritoneal transport of small solutes. Am J Nephrol 1999; 19:416-422 [35] Pecoits-Filho R, Stenvinkel P, Wang AY, Heimburger O, Lindholm B. Chronic inflammation in peritoneal dialysis: the search for the holy grail? Perit Dial Int 2004; 24:327-339. [36] Lam MF, Leung JC, Lo WK. Tam S, Mong MC, Lui SL, Tse KC, Chan TM, Lai KN. Hyperleptinaemia and chronic inflammation after peritonitis predicts poor nutritional status and mortality in patients on peritoneal dialysis. Nephrol Dial Transplant 2007; 22:1445-1450. [37] Stenvinkel P, Heimburger O, Lindholm B, Kaysen GA, Bergstrom J. Are there two types of malnutrition in chronic renal failure? Evidence for relationships between malnutrition, inflammation and atherosclerosis (MIA syndrome). Nephrol Dial Transplant 2000; 15:953–960.
60
Progress in Peritoneal Dialysis
[38] Cheung W, Yu PX, Little BM, Cone RD, Marks DL, Mak RH. Role of leptin and melanocortin signaling in uremia-associated cachexia. J Clin Invest 2005; 115:1659– 1665. [39] Flessner MF. Sterile solutions and peritoneal inflammation. Contrib Nephrol 2006; 150: 156-165.
4 Angiogenic Activity of the Peritoneal Mesothelium: Implications for Peritoneal Dialysis 1Department
Janusz Witowski1,2 and Achim Jörres2
of Pathophysiology, Poznań University of Medical Sciences, Poznań 2Department of Nephrology and Medical Intensive Care, Charité Universitätsmedizin Berlin, Campus Virchow-Klinikum, Berlin 1Poland 2Germany
1. Introduction Functional deterioration of the peritoneum as a dialyzing organ is a leading cause of peritoneal dialysis (PD) failure. The problem usually develops 2-4 years after the initiation of therapy (Davies et al., 1996; Struijk et al., 1994) and may affect as many as 50% of all PD patients (Kawaguchi et al., 1997). The alterations that develop in the peritoneal membrane over time include submesothelial thickening, fibrosis, angiogenesis, and vascular degeneration (Honda et al., 2008; Mateijsen et al., 1999; Williams et al., 2002; Williams et al., 2003). These changes are associated with an increase in peritoneal solute transport with resultant dissipation of the osmotic gradient and loss of ultrafiltration. Indeed, it has been estimated that up to 75% of patients with ultrafiltration failure will have increased vascular area (Heimburger et al., 1990; Ho-Dac-Pannekeet et al., 1997). Pathological angiogenesis not only increases vascular surface area of the peritoneum but is also a key step in the progression of fibrosis (Wynn, 2007). Therefore, it is essential to understand how PD environment impacts on peritoneal vasculature.
2. Vascular endothelial growth factor The process of angiogenesis requires tight coordination of cell proliferation, differentiation, migration, and cell-matrix interactions. The most important molecules that control blood vessel growth and permeability are vascular endothelial growth factors (VEGFs). VEGF-A (also designated and further referred to as VEGF) is the founding member of the VEGF family and was originally discovered by its ability to enhance vascular permeability (Nagy et al., 2007). In mammals, other VEGF family members include VEGF-B, -C, and -D, as well as placenta growth factor (PlGF). Structurally, the VEGFs are related to the family of platelet-derived growth factors (PDGF) (Olsson et al., 2006). VEGF is a highly conserved, disulfide-bonded dimeric glycoprotein, encoded by a single gene. The human Vegf gene is located on the short arm of chromosome 6 and alternative RNA splicing gives rise to peptide isoforms of 121, 145, 165, 189, and 206 amino acids. VEGF exerts its biologic effects
62
Progress in Peritoneal Dialysis
mainly through cell-surface tyrosine kinase receptors VEGFR-2, and - to lesser extent VEGFR-1 (Nagy et al., 2007). Although VEGF isoforms display similar basic activities, their bio-availability may be modulated by proteolytic processing and differences in binding to co-receptors such as heparan sulphate proteoglycans and neuropilins (Olsson et al., 2006). VEGF is an extremely potent and rapid inducer of vascular permeability (Olsson et al., 2006). This effect depends on the production of nitric oxide (NO) by endothelial NO synthase (eNOS). Consequently, targeted deletion of eNOS abrogates VEGF-induced permeability (Fukumura et al., 2001). Other biological effects of VEGF include vasodilation, endothelial cell proliferation, migration and tube formation. It also delays senescence of endothelial cells, promotes their survival, and mobilizes endothelial cell precursors (Nagy et al., 2007; Otrock et al., 2007). Inactivation of a single Vegf allele in mice results in early embryonic lethality caused by impaired development of endothelial cells and blood vessels (Carmeliet et al., 1996; Ferrara et al., 1996). In turn, an increase in VEGF expression is commonly associated with pathological angiogenesis observed in malignancies, inflammation, and wound healing (Nagy et al., 2007). 2.1 VEGF in the peritoneal cavity Given its role in controlling vascular permeability and proliferation, VEGF became an obvious target in research efforts to define the mechanism of peritoneal membrane failure. VEGF was promptly detected in the effluent dialysate (Zweers et al., 1999) in concentrations higher than could be expected on the basis of simple diffusion from the circulation (Selgas et al., 2001; Zweers et al., 1999). This pointed to the local production of VEGF in the peritoneum. Moreover, the rate of VEGF appearance in the dialysate was found to increase with time on PD (Cho et al., 2010) and to be elevated in patients with high peritoneal transport status (Pecoits-Filho et al., 2002; Rodrigues et al., 2007). Further analyses showed that the dialysate appearance of VEGF correlated also with that of cancer antigen 125 (CA125) (Cho et al., 2010; Rodrigues et al., 2004; Rodrigues et al., 2007). CA125 is thought to reflect the mass of peritoneal mesothelial cells (Krediet, 2001), therefore the mesothelium was considered to be the main source of intraperitoneal VEGF. Indeed, immunochemical staining of peritoneal biopsies showed that VEGF expression was confined mainly to the mesothelial monolayer (Aroeira et al., 2005; Combet et al., 2000). The mesothelial origin of peritoneal VEGF was ultimately confirmed in an elegant study, during which various cell types were isolated from the peritoneal lavage and the omentum, and analysed by several techniques for the ability to generate VEGF (Gerber et al., 2006). It transpired that omental mesothelial cells were responsible for the majority of peritoneal VEGF produced. These results were corroborated by the demonstration of constitutive VEGF secretion by mesothelial cells isolated either from the dialysate effluent (Selgas et al., 2000) or from the omentum (Mandl-Weber et al., 2002). Moreover, VEGF released by mesothelial cells was shown to exhibit biologic activity (Boulanger et al., 2007). The formation of capillary tubes by endothelial cells in vitro was found to increase either in the presence of peritoneal mesothelial cells or after the addition of conditioned medium from mesothelial cell cultures. These effects could be abolished by anti-VEGF antibodies (Boulanger et al., 2007).
3. Mesothelial cell VEGF expression during PD The above data have given support to a long held belief that although the mesothelium forms only a single-cell layer over the peritoneum, it may significantly impact on the dialytic
Angiogenic Activity of the Peritoneal Mesothelium: Implications for Peritoneal Dialysis
63
function of the whole peritoneal membrane by producing powerful mediators that act on the peritoneal interstitium and vasculature. Immunochemical analysis of peritoneal biopsies revealed only weak mesothelial expression of VEGF in control subjects, but extensive VEGF staining in patients undergoing PD (Aroeira et al., 2005; Combet et al., 2000). In an interesting experimental model mesothelial cells were isolated from dialysate effluent of PD patients, propagated ex vivo and analysed for the ability to release VEGF (Aroeira et al., 2005). It turned out that mesothelial cells isolated from patients with high peritoneal permeability secreted more VEGF compared to cells from patients with lower peritoneal transport properties. Several factors have been implicated in the pathogenesis of increased peritoneal permeability in PD. They include the state of uraemia, episodes of peritonitis, and chronic exposure to dialysis fluids (Margetts & Churchill, 2002). Increasing evidence indicate that such conditions may modulate the release of VEGF by mesothelial cells. It is therefore essential to delineate mesothelial cell responses to these challenges. 3.1 Peritonitis An increase in vascular permeability is a hallmark of inflammation. As a result, when acute peritonitis occurs during PD, it leads to rapid absorption of instilled glucose and a decrease in osmotic gradient-driven ultrafiltration. Modelling of PD-associated peritonitis in mice revealed significant increases in vascular density, the relative endothelial area, and the diameter of peritoneal vessels (Ni et al., 2003). These alterations were evident several days after bacterial infection and were accompanied by a huge increase in the dialysate VEGF concentration. The inflammatory response is orchestrated by a coordinated release of cytokines with interleukin-1β (IL-1β) and tumour necrosis factor-α (TNFα) acting as crucial promoters of the reaction. The concentrations of IL-1β and TNFα in PD effluent increase very early and dramatically in the course of peritonitis (Brauner et al., 1996; Moutabarrik et al., 1995; Zemel et al., 1994). Transient, adenovirus-mediated over-expression of either IL-1β or TNFα in the rat peritoneum was found to increase the expression of VEGF in the peritoneal tissue and fluid (Margetts et al., 2002). This effect was followed by extensive angiogenesis, increased peritoneal permeability, and impaired ultrafiltration. In keeping with these results, it has been demonstrated that either IL-1β or TNFα were capable of inducing time- and dosedependent VEGF production in mesothelial cells in vitro (Mandl-Weber et al., 2002). Moreover, in vitro exposure of mesothelial cells to dialysate effluent drained during peritonitis resulted in a significantly increased VEGF release compared to when cells were maintained in the non-infected dialysate (Witowski & Jörres, personal observations). 3.2 Exposure to dialysis fluids The observation that the ultrafiltration capacity of the peritoneum decreases with time on PD (Davies et al., 1996; Heimburger et al., 1999) suggested that long-term exposure to bioincompatible PD fluids might have a deleterious impact on the peritoneal membrane. Early experiments pointed to low pH, high concentrations of lactate and glucose, and the presence of glucose degradation products (GDPs) as the elements curtailing biocompatibility of standard PD solutions (Wieslander et al., 1991). In recent years particular attention has been paid to GDPs. They are reactive carbonyl derivatives of glucose (such as formaldehyde, methylglyoxal or 3-deoxyglucosone), which are formed predominantly
64
Progress in Peritoneal Dialysis
during heat sterilization of PD fluids. It has been demonstrated that conventional PD fluids with high GDPs content recruited capillaries and induced vasodilation of mesenteric arteries in the rat peritoneum (Mortier et al., 2002). Moreover, the peritonea of rats injected intraperitoneally for several days with methylglyoxal were found to display increased vascularization (Nakayama et al., 2003) and VEGF expression (Inagi et al., 1999). Subsequent experiments confirmed that extensive peritoneal expression of VEGF in rats receiving methylglyoxal-containing PD fluids was associated with neoangiogenesis and increased permeability (Hirahara et al., 2006). Furthermore, it has been demonstrated that direct in vitro exposure of mesothelial cells to several GDPs (methylglyoxal, 3,4-dideoxy-glucosone3-ene, 2-furaldehyde) resulted in an increased VEGF expression (Inagi et al., 1999; Lai et al., 2004; Leung et al., 2005). The adverse effects of GDPs on the peritoneal membrane can also be mediated through advanced glycation-end products (AGEs). GDPs react with amino groups of proteins to form AGEs and it has been demonstrated that PD fluids with high GDP levels significantly promote the generation of AGEs (Tauer et al., 2001). Animal experiments showed that intraperitoneal infusion of GDP-containing solutions led to the accumulation in the peritoneal membrane of both methylglyoxal and AGEs (Mortier et al., 2004). The presence of AGE deposits was associated with increased expression of VEGF, increased vascular density, and lower ultrafiltration. These observations were in line with earlier data showing that the intensity of peritoneal AGE accumulation in PD patients correlated with changes in peritoneal transport and ultrafiltration (Honda et al., 1999; Nakayama et al., 1997). Moreover, mesothelial cells were found to bear a receptor for AGEs (RAGE) and to upregulate its expression following exposure to GDP in either in vitro (Lai et al., 2004) or in vivo setting (Mortier et al., 2004). In turn, incubation of mesothelial cells with AGEs led to a dose-dependent increase in VEGF production (Boulanger et al., 2007; Mandl-Weber et al., 2002). Interestingly, GDP-induced VEGF release by mesothelial cells could be reduced by aminoguanidine, an inhibitor of AGE formation (Lai et al., 2004). Also, a rise in peritoneal VEGF expression and vascular density that was induced in wild-type mice by chronic exposure to GDP-containing fluids, did not occur in RAGE-deficient animals (Schwenger et al., 2006). Correspondingly, the promoting effect of AGE-treated mesothelial cells on capillary tube formation could be substantially diminished by the blockade of RAGE with specific antibodies (Boulanger et al., 2007). These data indicate that GDPs exert their effect by inducing glycation of proteins that subsequently activate RAGE on mesothelial cells and stimulate them to release angiogenic VEGF (Fig. 1). 3.3 Uraemia After analysing peritoneal specimens from a large cohort of individuals, the Peritoneal Biopsy Study Group concluded that in many patients with uraemia some changes in the peritoneum occurred even before the commencement of PD (Williams et al., 2002). Compared to healthy individuals, such patients often had significant thickening of the submesothelial compact zone and extensive vasculopathy. These changes are generally attributed to the build-up of uraemic toxins, however, their exact nature remains poorly defined. The peritonea of rats made uraemic by subtotal nephrectomy were found to have increased permeability and showed focal areas of vascular proliferation, up-regulation of VEGF and accumulation of AGEs (Combet et al., 2001). Furthermore, there was the evidence of mesothelial cell conversion into myofibroblasts (De Vriese et al., 2006). A more recent
65
Angiogenic Activity of the Peritoneal Mesothelium: Implications for Peritoneal Dialysis
study in humans confirmed the presence of submesothelial thickening, focal fibrosis, and increased vascularization in the uraemic peritoneum (Kihm et al., 2008). These alterations were accompanied by increased peritoneal expression of methylglyoxal-induced AGEs, RAGE, VEGF, as well as of nuclear factor-κB (NF-κB) and interleukin-6 (IL-6). The peritoneal accumulation of AGEs and RAGE in uraemia may be not so surprising, since it is now well recognized that the uraemic state is associated with increased generation of glucose-derived dicarbonyl compounds (such as glyoxal, methylglyoxal, or 3deoxyglucosone), which are strong inducers of AGEs (Miyata et al., 1999; Miyata et al., 2001) (Fig. 1). In turn, binding of AGEs to RAGE on mesothelial cells can activate NF-κB and increase the production of NF-κB-controlled inflammatory cytokines, including IL-6 (Nevado et al., 2005). PD fluidderived carbonyls (GDP)
Proteins
Uraemiaassociated carbonyls
AGE Reactive carbonyls Mesothelial cells
RAGE Proteins AGE RAGE VEGF VEGF Peritoneal vasculature
Fig. 1. Effect of reactive carbonyls and advanced glycation end-products on VEGF release by mesothelial cells.
4. Mesothelial cell phenotype and VEGF expression It is now clear that mesothelial cells may undergo some phenotypic changes both in vitro and in vivo. These changes are related to distinct biological programmes activated by cells exposed to environmental challenges. The exact context at which certain stimuli trigger a given cellular response is not fully understood. Nevertheless, increasing evidence suggest
66
Progress in Peritoneal Dialysis
that such reactions may occur also in the milieu of PD. Interestingly, transforming growth factor-β (TGF-β) has emerged as a mediator being critically involved at several steps of these pathways. 4.1 Epithelial-to-mesenchymal transition During epithelial-to-mesenchymal transition (EMT) epithelial cells adapt a fibroblast-like phenotype. It includes the loss of distinctive apical-basal cell polarity, disassembly of tight intercellular junctions, and the acquirement of ability to migrate and shape extracellular matrix. Mounting evidence indicate that during PD mesothelial cells differentiate into submesothelial fibroblasts and impact on the underlying stroma and vasculature (Aroeira et al., 2007). Mesothelial cells isolated from dialysate effluent of PD patients were found to exhibit phenotypes ranging from the typical epithelial cobblestone-like appearance to the fibroblast spindle-like morphology (Yanez-Mo et al., 2003). The occurrence of fibroblast-like mesothelial cells increased with time on PD (Yanez-Mo et al., 2003) and was greater in patients who exhibited increased peritoneal permeability (Aroeira et al., 2005) or received PD solutions with high GDP concentrations (Aroeira et al., 2009; Bajo et al., 2011). The role of mesothelial cell phenotypic conversion in inducing functional alterations in peritoneal transport could be linked to the augmented VEGF and TGF-β1 release. Mesothelial cells with fibroblast-like morphology were found to release significantly more TGF-β1 and VEGF when propagated ex vivo compared to cells with classic epithelioid appearance (Aroeira et al., 2005; Bajo et al., 2011). A precise study with the use of immunofluorescence-aided laser capture microdissection confirmed that phenotypic changes in rat mesothelial cells occurred after adenoviral over-expression of TGF-β1 in the peritoneum and were associated with increased VEGF expression (Zhang et al., 2008). The process was largely mediated through Smad3, a crucial element of the TGF-β signalling pathway (Patel et al., 2010a). These data indicate that the gradual accumulation of transdifferentiated mesothelial cells in the peritoneum of PD patients may favour the development of excessive peritoneal vascularization and/or permeability. Studies on the molecular mechanisms coordinating EMT identified TGF-β1 and bone morphogenetic protein-7 (BMP-7) as the key mediators (Zavadil & Bottinger, 2005; Zeisberg et al., 2003). As in other cell types, TGF-β1 was shown to induce EMT in mesothelial cells both in vitro (Yang et al., 2003) and in vivo (Margetts et al., 2005; Patel et al., 2010a; Zhang et al., 2008). In contrast, BMP-7 was found to act as an inhibitor of EMT and blocked the mesothelial cell conversion (Loureiro et al., 2010; Vargha et al., 2006; Yu et al., 2009). Interestingly, it has recently been demonstrated that PD fluids with high GDP content induced EMT in mesothelial cells either during short-term direct in vitro exposure or following chronic PD regimen (Bajo et al., 2011). This finding was in line with earlier observations of EMT in the peritoneal membrane of rats treated with chronic intraperitoneal administration of methylglyoxal (Hirahara et al., 2009). The process was associated with increased peritoneal expression of TGF-β and RAGE. Interestingly, in uraemic rats the inhibition of signalling from RAGE decreased the extent of mesothelial EMT and TGF-β expression (De Vriese et al., 2006). Moreover, PD fluid-induced EMT of mesothelial cells in rats could be substantially reduced by peritoneal rest (Yu et al., 2009), which has long been advocated as a means of restoring ultrafiltration in patients with the hyperpermeable peritoneum (de Alvaro et al., 1993; Rodrigues et al., 2002). It has also been demonstrated that PD fluid-induced EMT was associated with increased signalling from Notch receptors in
Angiogenic Activity of the Peritoneal Mesothelium: Implications for Peritoneal Dialysis
67
mesothelial cells and the process was mediated through TGF-β1 (Zhu et al., 2010). Notch receptors are involved in the determination of cell fate, differentiation, and maintenance. The inhibition of Notch signalling resulted in the attenuation of both TGF-β1-induced EMT in vitro and PD fluid-induced EMT and peritoneal fibrosis in vivo (Zhu et al., 2010). Importantly, in both processes, the blockade of Notch led to a decrease in mesothelial cell VEGF expression. In a recent intriguing study (Patel et al., 2010b), platelet derived growth factor B (PDGF-B) was found to induce some, but not all, features of EMT in mesothelial cells. They included, however, increased VEGF expression. 4.2 Cell senescence Gradual senescence of cells, which can easily be seen in vitro, has been believed to reflect the process of organismal aging. Extensive studies over the past decade have revealed, however, that cellular senescence is a more general phenomenon. It appears to be a cellular stress response set off by factors that may put the integrity of the genome in danger (Campisi, 2010). They include DNA breaks, dysfunctional telomeres and mitochondria, oxidative stress, disrupted chromatin, or excessive mitogenic stimulation. The hallmark of cellular senescence is an essentially irreversible growth arrest. As this prevents the transmission of potentially oncogenic mutations to daughter cells, the senescence response is thought to have evolved as a powerful cancer suppression mechanism. Other features of senescence include an enlarged morphology, the expression of senescence-associated βgalactosidase (SA-β-gal), and the up-regulation of p16, a cyclin-dependent cell cycle inhibitor. Human peritoneal mesothelial cells in vitro enter the senescent state relatively quickly (Ksiazek et al., 2006). The process does not result from critical telomere shorthening (Ksiazek et al., 2007c), but is associated with extensive accumulation of DNA double-strand breaks in non-telomeric DNA regions. The damages are most likely caused by oxidative stress (Ksiazek et al., 2008b), which is viewed as one of the main triggers of premature senescence. As increased generation of reactive oxygen species occurs in hyperglycaemia (Bashan et al., 2009), it was logical to examine how glucose impacted on senescence of mesothelial cells. It turned out that chronic exposure to high glucose accelerated the development of senescent features in mesothelial cells, and the effect could be largely prevented by antioxidants (Ksiazek et al., 2007a). Interestingly, a further downstream mediator of the process appeared to be TGF-β1, since some features of the high glucose-induced senescent phenotype could be abolished by anti-TGF-β antibodies or reproduced by exogenous TGF-β1 (Ksiazek et al., 2007b). The presence of senescent mesothelial cells in vivo is only scarcely documented. Cells expressing SA-β-Gal were found in freshly explanted human omenta (Ksiazek et al., 2008b), in mesothelial cell imprints from mice exposed to PD fluids (Gotloib et al., 2003) or in mesothelial cell derived from PD effluents (Gotloib et al., 2007). The detection of senescent cells following in vivo exposure to PD fluids or after in vitro exposure to high glucose rises an interesting question of whether dialysate glucose and/or glucose derivatives promote the senescence of mesothelial cells. Some date indicate that direct exposure to GDP-containing PD fluid may, indeed, result in increased expression of SA-β-Gal in mesothelial cells (Witowski et al., 2008). The potential significance of such a change in the mesothelial cell phenotype is that senescent cells display an altered pattern of secretion of various cytokines, growth factors,
68
Progress in Peritoneal Dialysis
proteases, and matrix components. The senescence-associated secretory phenotype may contribute to tissue dysfunction and pave the way for other pathologies (Coppe et al., 2010). VEGF has been identified as one of the mediators released at increased levels by senescent cells (Coppe et al., 2006). As a matter of fact, senescent mesothelial were also found to release significantly more VEGF than their pre-senescent counterparts (Witowski et al., 2008). Moreover, media obtained from cultures of senescent mesothelial cells promoted endothelial cell growth to a greater degree compared with young cells (Ksiazek et al., 2008a). The increase in VEGF secretion by senescent mesothelial cells could be partly related to the senescence-associated oxidative stress, since the antioxidant precursors of glutathione were found to decrease VEGF release (Witowski et al., 2008). It could also be mediated by the augmented activity of TGF-β1 observed in senescence (Ksiazek et al., 2007b). In this respect TGF-β1 has been shown to induce VEGF in many cell types, including mesothelial cells (Szeto et al., 2005). An interesting aspect of the process delineated above is the involvement of TGF-β1 in both EMT and cellular senescence. Intriguingly enough, TGF-β1 may also act as a mediator of apoptosis (Siegel & Massague, 2003). Indeed, TGF-β1 was found to increase the rate of apoptosis in mesothelial cells, probably by down-regulating the expression of an antiapoptotic gene bcl-2l (Szeto et al., 2006). Therefore, it remains to be elucidated how cells read TGF-β1 signals so that the response proceeds along a given pathway. Furthermore, it is not clear whether there is some relationship between the resulting processes. It has been suggested that the senescence-associated secretory phenotype may promote EMT in neighbouring cells (Coppe et al., 2008).
5. VEGF polymorphism The Vegf gene is a highly polymorphic gene with several variations identified in a 5’promotor region of the gene (Brogan et al., 1999). Such polymorphisms are thought to bear functional significance and may, for example, affect VEGF production by mononuclear leukocytes (Watson et al., 2000) or malignant cells (Schneider et al., 2009). Several known Vegf polymorphisms were analysed in the context of PD. They were found to have no association with baseline permeability of the peritoneal membrane at the start of PD (Gillerot et al., 2005; Maruyama et al., 2007; Szeto et al., 2004). Interestingly, however, patients with the A allele at –2578 position of the Vegf gene had higher mRNA VEGF expression in the sediment of effluent cells compared to the individuals with the C allele (Szeto et al., 2004). Moreover, this genotype was associated with a gradual increase in peritoneal transport over time and with greater patient mortality. The data suggest that certain genotypes may predispose to increased local VEGF release in response to PD environment and thus impact on peritoneal membrane function. Since mesothelial cell EMT or senescence are associated with increased secretion of VEGF, it would be interesting to know whether certain genotypes have an effect on the incidence of such changes in PD patients.
6. Conclusions The mesothelium is the main source of peritoneal VEGF. By secreting VEGF, mesothelial cells impact on peritoneal vasculature. In PD patients the exposure of mesothelial cells to uraemic environment, bioincompatible dialysis fluids, and the bouts of infection may
Angiogenic Activity of the Peritoneal Mesothelium: Implications for Peritoneal Dialysis
69
change the secretory phenotype of mesothelial cells so that they release more VEGF. In some patients (possibly with a certain genetic background), VEGF secretion may become excessive, and mediate pathological angiogenesis. On the other hand, however, VEGFinduced neoangiogenesis cannot be viewed as the sole culprit of the peritoneal membrane dysfunction. Computer simulations suggest that an increase in peritoneal exchange surface area alone will not account for a massive decrease in drained volumes (Rippe et al., 1991). One has to bear in mind, however, there exists a tight link between angiogenesis and fibrosis (Wynn, 2007). In fact, detailed studies of peritoneal biopsies showed that the degree of peritoneal fibrosis correlated with greater vascular density and, conversely, fibrosis occurred infrequently in the absence of vasculopathy (Williams et al., 2002). Thus, the contribution of mesothelial cell-derived VEGF to the peritoneal membrane dysfunction is probably multifactorial, and is related both to a direct increase in peritoneal permeability and the involvement in peritoneal fibrosis (Fig. 2).
PD environment PD fluids
Glucose-derived carbonyls
Uraemia
Peritonitis
Oxidative stress TGF- Cellular senescence
EMT VEGF Permeability
Neoangiogenesis Fibrosis Peritoneal ultrafiltration dysfunction
Fig. 2. Possible impact of PD environment on mesothelial cell VEGF expression and peritoneal membrane dysfunction.
70
Progress in Peritoneal Dialysis
7. References Aroeira, L.S. et al. (2007). Epithelial to mesenchymal transition and peritoneal membrane failure in peritoneal dialysis patients: pathologic significance and potential therapeutic interventions. J.Am.Soc.Nephrol., Vol.18, No.7, pp. 2004-2013. Aroeira, L.S. et al. (2005). Mesenchymal conversion of mesothelial cells as a mechanism responsible for high solute transport rate in peritoneal dialysis: role of vascular endothelial growth factor. Am.J.Kidney Dis., Vol.46, No.5, pp. 938-948. Aroeira, L.S. et al. (2009). Cyclooxygenase-2 mediates dialysate-induced alterations of the peritoneal membrane. J.Am.Soc.Nephrol., Vol.20, No.3, pp. 582-592. Bajo, M.A. et al. (2011). Low-GDP peritoneal dialysis fluid ('balance') has less impact in vitro and ex vivo on epithelial-to-mesenchymal transition (EMT) of mesothelial cells than a standard fluid. Nephrol.Dial.Transplant., Vol.26, No.1, pp. 282-291. Bashan, N. et al. (2009). Positive and negative regulation of insulin signaling by reactive oxygen and nitrogen species. Physiol.Rev., Vol.89, No.1, pp. 27-71. Boulanger, E. et al. (2007). Mesothelial RAGE activation by AGEs enhances VEGF release and potentiates capillary tube formation. Kidney Int., Vol.71, No.2, pp. 126-133. Brauner, A. et al. (1996). Tumor necrosis factor-alpha, interleukin-1 beta, and interleukin-1 receptor antagonist in dialysate and serum from patients on continuous ambulatory peritoneal dialysis. Am.J.Kidney Dis., Vol.27, No.3, pp. 402-408. Brogan, I.J. et al. (1999). Novel polymorphisms in the promoter and 5' UTR regions of the human vascular endothelial growth factor gene. Hum.Immunol., Vol.60, No.12, pp. 1245-1249. Campisi, J. (2011). Cellular senescence: putting the paradoxes in perspective. Curr.Opin.Genet.Dev., Vol.21, No.1, pp.107-112. Carmeliet, P. et al. (1996). Abnormal blood vessel development and lethality in embryos lacking a single VEGF allele. Nature, Vol.380, No.6573, pp. 435-439. Cho, J.H. et al. (2010). Impact of systemic and local peritoneal inflammation on peritoneal solute transport rate in new peritoneal dialysis patients: a 1-year prospective study. Nephrol.Dial.Transplant., Vol.25, No.6, pp. 1964-1973. Combet, S. et al. (2001). Chronic uremia induces permeability changes, increased nitric oxide synthase expression, and structural modifications in the peritoneum. J.Am Soc.Nephrol., Vol.12, No.10, pp. 2146-2157. Combet, S. et al. (2000). Vascular proliferation and enhanced expression of endothelial nitric oxide synthase in human peritoneum exposed to long-term peritoneal dialysis. J.Am Soc.Nephrol., Vol.11, No.4, pp. 717-728. Coppe, J.P. et al. (2006). Secretion of vascular endothelial growth factor by primary human fibroblasts at senescence. J.Biol.Chem., Vol.281, No.40, pp. 29568-29574. Coppe, J.P. et al. (2008). Senescence-associated secretory phenotypes reveal cellnonautonomous functions of oncogenic RAS and the p53 tumor suppressor. PLoS.Biol., Vol.6, No.12, pp. 2853-2868. Coppe, J.P. et al. (2010). The senescence-associated secretory phenotype: the dark side of tumor suppression. Annu.Rev.Pathol., Vol.5, pp. 99-118. Davies, S.J. et al. (1996). Longitudinal changes in peritoneal kinetics: the effects of peritoneal dialysis and peritonitis. Nephrol.Dial.Transplant., Vol.11, No.3, pp. 498-506. de Alvaro, F. et al. (1993). Peritoneal resting is beneficial in peritoneal hyperpermeability and ultrafiltration failure. Adv.Perit.Dial., Vol.9, pp. 56-61.
Angiogenic Activity of the Peritoneal Mesothelium: Implications for Peritoneal Dialysis
71
De Vriese, A.S. et al. (2006). Myofibroblast transdifferentiation of mesothelial cells is mediated by RAGE and contributes to peritoneal fibrosis in uraemia. Nephrol.Dial.Transplant., Vol.21, No.9, pp. 2549-2555. Ferrara, N. et al. (1996). Heterozygous embryonic lethality induced by targeted inactivation of the VEGF gene. Nature, Vol.380, No.6573, pp. 439-442. Fukumura, D. et al. (2001). Predominant role of endothelial nitric oxide synthase in vascular endothelial growth factor-induced angiogenesis and vascular permeability. Proc.Natl.Acad.Sci.U.S.A, Vol.98, No.5, pp. 2604-2609. Gerber, S.A. et al. (2006). Preferential attachment of peritoneal tumor metastases to omental immune aggregates and possible role of a unique vascular microenvironment in metastatic survival and growth. Am.J.Pathol., Vol.169, No.5, pp. 1739-1752. Gillerot, G. et al. (2005). Genetic and clinical factors influence the baseline permeability of the peritoneal membrane. Kidney Int., Vol.67, No.6, pp. 2477-2487. Gotloib, L. et al. (2003). Icodextrin-induced lipid peroxidation disrupts the mesothelial cell cycle engine. Free Radic.Biol.Med., Vol.34, No.4, pp. 419-428. Gotloib, L. et al. (2007). The use of peritoneal mesothelium as a potential source of adult stem cells. Int.J.Artif.Organs, Vol.30, No.6, pp. 501-512. Heimburger, O. et al. (1990). Peritoneal transport in CAPD patients with permanent loss of ultrafiltration capacity. Kidney Int., Vol.38, No.3, pp. 495-506. Heimburger, O. et al. (1999). Alterations in water and solute transport with time on peritoneal dialysis. Perit.Dial.Int., Vol.19 Suppl 2, pp. S83-S90. Hirahara, I. et al. (2006). Peritoneal injury by methylglyoxal in peritoneal dialysis. Perit.Dial.Int., Vol.26, No.3, pp. 380-392. Hirahara, I. et al. (2009). Methylglyoxal induces peritoneal thickening by mesenchymal-like mesothelial cells in rats. Nephrol.Dial.Transplant., Vol.24, No.2, pp. 437-447. Ho-Dac-Pannekeet, M.M. et al. (1997). Analysis of ultrafiltration failure in peritoneal dialysis patients by means of standard peritoneal permeability analysis. Perit.Dial.Int., Vol.17, No.2, pp. 144-150. Honda, K. et al. (1999). Accumulation of advanced glycation end products in the peritoneal vasculature of continuous ambulatory peritoneal dialysis patients with low ultrafiltration. Nephrol.Dial.Transplant., Vol.14, No.6, pp. 1541-1549. Honda, K. et al. (2008). Impact of uremia, diabetes, and peritoneal dialysis itself on the pathogenesis of peritoneal sclerosis: a quantitative study of peritoneal membrane morphology. Clin.J.Am.Soc.Nephrol., Vol.3, No.3, pp. 720-728. Inagi, R. et al. (1999). Glucose degradation product methylglyoxal enhances the production of vascular endothelial growth factor in peritoneal cells: role in the functional and morphological alterations of peritoneal membranes in peritoneal dialysis. FEBS Lett., Vol.463, No.3, pp. 260-264. Kawaguchi, Y. et al. (1997). Issues affecting the longevity of the continuous peritoneal dialysis therapy. Kidney Int.Suppl, Vol.62, pp. S105-S107. Kihm, L.P. et al. (2008). RAGE expression in the human peritoneal membrane. Nephrol.Dial.Transplant., Vol.23, No.10, pp. 3302-3306. Krediet, R.T. (2001). Dialysate cancer antigen 125 concentration as marker of peritoneal membrane status in patients treated with chronic peritoneal dialysis. Perit.Dial.Int., Vol.21, No.6, pp. 560-567. Ksiazek, K. et al. (2006). Early loss of proliferative potential of human peritoneal mesothelial cells in culture: the role of p16INK4a-mediated premature senescence. J.Appl.Physiol, Vol.100, No.3, pp. 988-995.
72
Progress in Peritoneal Dialysis
Ksiazek, K. et al. (2007a). Oxidative stress contributes to accelerated development of the senescent phenotype in human peritoneal mesothelial cells exposed to high glucose. Free Radic.Biol.Med., Vol.42, No.5, pp. 636-641. Ksiazek, K. et al. (2007b). Accelerated senescence of human peritoneal mesothelial cells exposed to high glucose: the role of TGF-beta1. Lab.Invest, Vol.87, No.4, pp. 345356. Ksiazek, K. et al. (2007c). Premature senescence of mesothelial cells is associated with nontelomeric DNA damage. Biochem.Biophys.Res.Commun., Vol.362, No.3, pp. 707711. Ksiazek, K. et al. (2008a). Senescence induces a proangiogenic switch in human peritoneal mesothelial cells. Rejuvenation Res., Vol.11, No.3, pp. 681-683. Ksiazek, K. et al. (2008b). Oxidative stress-mediated early senescence contributes to the short replicative life span of human peritoneal mesothelial cells. Free Radic.Biol.Med., Vol.45, pp. 460-467. Lai, K.N. et al. (2004). Differential expression of receptors for advanced glycation endproducts in peritoneal mesothelial cells exposed to glucose degradation products. Clin.Exp.Immunol., Vol.138, No.3, pp. 466-475. Leung, J.C. et al. (2005). Glucose degradation products downregulate ZO-1 expression in human peritoneal mesothelial cells: the role of VEGF. Nephrol.Dial.Transplant., Vol.20, No.7, pp. 1336-1349. Loureiro, J. et al. (2010). BMP-7 blocks mesenchymal conversion of mesothelial cells and prevents peritoneal damage induced by dialysis fluid exposure. Nephrol.Dial.Transplant., Vol.25, No.4, pp. 1098-1108. Mandl-Weber, S. et al. (2002). Vascular endothelial growth factor production and regulation in human peritoneal mesothelial cells. Kidney Int., Vol.61, No.2, pp. 570-578. Margetts, P.J. & Churchill, D.N. (2002). Acquired ultrafiltration dysfunction in peritoneal dialysis patients. J.Am.Soc.Nephrol., Vol.13, No.11, pp. 2787-2794. Margetts, P.J. et al. (2002). Inflammatory cytokines, angiogenesis, and fibrosis in the rat peritoneum. Am.J.Pathol., Vol.160, No.6, pp. 2285-2294. Margetts, P.J. et al. (2005). Transient overexpression of TGF-{beta}1 induces epithelial mesenchymal transition in the rodent peritoneum. J.Am.Soc.Nephrol., Vol.16, No.2, pp. 425-436. Maruyama, Y. et al. (2007). Relationship between the -374T/A receptor of advanced glycation end products gene polymorphism and peritoneal solute transport status at the initiation of peritoneal dialysis. Ther.Apher.Dial., Vol.11, No.4, pp. 301-305. Mateijsen, M.A. et al. (1999). Vascular and interstitial changes in the peritoneum of CAPD patients with peritoneal sclerosis. Perit.Dial.Int., Vol.19, No.6, pp. 517-525. Miyata, T. et al. (1999). Alterations in nonenzymatic biochemistry in uremia: origin and significance of "carbonyl stress" in long-term uremic complications. Kidney Int., Vol.55, No.2, pp. 389-399. Miyata, T. et al. (2001). Reactive carbonyl compounds related uremic toxicity ("carbonyl stress"). Kidney Int.Suppl, Vol.78, pp. S25-S31. Mortier, S. et al. (2002). Hemodynamic effects of peritoneal dialysis solutions on the rat peritoneal membrane: role of acidity, buffer choice, glucose concentration, and glucose degradation products. J.Am.Soc.Nephrol., Vol.13, No.2, pp. 480-489. Mortier, S. et al. (2004). Long-term exposure to new peritoneal dialysis solutions: Effects on the peritoneal membrane. Kidney Int., Vol.66, No.3, pp. 1257-1265. Moutabarrik, A. et al. (1995). Interleukin-1 and its naturally occurring antagonist in peritoneal dialysis patients. Clin.Nephrol., Vol.43, No.4, pp. 243-248.
Angiogenic Activity of the Peritoneal Mesothelium: Implications for Peritoneal Dialysis
73
Nagy, J.A. et al. (2007). VEGF-A and the induction of pathological angiogenesis. Annu.Rev.Pathol., Vol.2, pp. 251-275. Nakayama, M. et al. (1997). Immunohistochemical detection of advanced glycosylation endproducts in the peritoneum and its possible pathophysiological role in CAPD. Kidney Int., Vol.51, No.1, pp. 182-186. Nakayama, M. et al. (2003). Hyper-vascular change and formation of advanced glycation endproducts in the peritoneum caused by methylglyoxal and the effect of an antioxidant, sodium sulfite. Am.J.Nephrol., Vol.23, No.6, pp. 390-394. Nevado, J. et al. (2005). Amadori adducts activate nuclear factor-kappaB-related proinflammatory genes in cultured human peritoneal mesothelial cells. Br.J.Pharmacol., Vol.146, No.2, pp. 268-279. Ni, J. et al. (2003). Mice that lack endothelial nitric oxide synthase are protected against functional and structural modifications induced by acute peritonitis. J.Am.Soc.Nephrol., Vol.14, No.12, pp. 3205-3216. Olsson, A.K. et al. (2006). VEGF receptor signalling - in control of vascular function. Nat.Rev.Mol.Cell Biol, Vol.7, No.5, pp. 359-371. Otrock, Z.K. et al. (2007). Vascular endothelial growth factor family of ligands and receptors: review. Blood Cells Mol.Dis., Vol.38, No.3, pp. 258-268. Patel, P. et al. (2010a). Smad3-dependent and -independent pathways are involved in peritoneal membrane injury. Kidney Int., Vol.77, No.4, pp. 319-328. Patel, P. et al. (2010b). Platelet derived growth factor B and epithelial mesenchymal transition of peritoneal mesothelial cells. Matrix Biol., Vol.29, No.2, pp. 97-106. Pecoits-Filho, R. et al. (2002). Plasma and dialysate IL-6 and VEGF concentrations are associated with high peritoneal solute transport rate. Nephrol.Dial.Transplant., Vol.17, No.8, pp. 1480-1486. Rippe, B. et al. (1991). Computer simulations of peritoneal fluid transport in CAPD. Kidney Int., Vol.40, No.2, pp. 315-325. Rodrigues, A. et al. (2002). Peritoneal rest may successfully recover ultrafiltration in patients who develop peritoneal hyperpermeability with time on continuous ambulatory peritoneal dialysis. Adv.Perit.Dial., Vol.18, pp. 78-80. Rodrigues, A. et al. (2004). Evaluation of effluent markers cancer antigen 125, vascular endothelial growth factor, and interleukin-6: relationship with peritoneal transport. Adv.Perit.Dial., Vol.20, pp. 8-12. Rodrigues, A. et al. (2007). Evaluation of peritoneal transport and membrane status in peritoneal dialysis: focus on incident fast transporters. Am.J.Nephrol., Vol.27, No.1, pp. 84-91. Schneider, B.P. et al. (2009). The role of vascular endothelial growth factor genetic variability in cancer. Clin.Cancer Res., Vol.15, No.17, pp. 5297-5302. Schwenger, V. et al. (2006). Damage to the peritoneal membrane by glucose degradation products is mediated by the receptor for advanced glycation end-products. J.Am.Soc.Nephrol., Vol.17, No.1, pp. 199-207. Selgas, R. et al. (2000). Spontaneous VEGF production by cultured peritoneal mesothelial cells from patients on peritoneal dialysis. Perit.Dial.Int., Vol.20, No.6, pp. 798-801. Selgas, R. et al. (2001). Vascular endothelial growth factor (VEGF) levels in peritoneal dialysis effluent. J.Nephrol., Vol.14, No.4, pp. 270-274. Siegel, P.M. & Massague, J. (2003). Cytostatic and apoptotic actions of TGF-beta in homeostasis and cancer. Nat.Rev.Cancer, Vol.3, No.11, pp. 807-821. Struijk, D.G. et al. (1994). A prospective study of peritoneal transport in CAPD patients. Kidney Int., Vol.45, No.6, pp. 1739-1744.
74
Progress in Peritoneal Dialysis
Szeto, C.C. et al. (2004). Genetic polymorphism of VEGF: Impact on longitudinal change of peritoneal transport and survival of peritoneal dialysis patients. Kidney Int., Vol.65, No.5, pp. 1947-1955. Szeto, C.C. et al. (2005). Differential effects of transforming growth factor-beta on the synthesis of connective tissue growth factor and vascular endothelial growth factor by peritoneal mesothelial cell. Nephron Exp.Nephrol., Vol.99, No.4, pp. e95-e104. Szeto, C.C. et al. (2006). Connective tissue growth factor is responsible for transforming growth factor-beta-induced peritoneal mesothelial cell apoptosis. Nephron Exp.Nephrol., Vol.103, No.4, pp. e166-e174. Tauer, A. et al. (2001). In vitro formation of N(epsilon)-(carboxymethyl)lysine and imidazolones under conditions similar to continuous ambulatory peritoneal dialysis. Biochem.Biophys.Res.Commun., Vol.280, No.5, pp. 1408-1414. Vargha, R. et al. (2006). Ex vivo reversal of in vivo transdifferentiation in mesothelial cells grown from peritoneal dialysate effluents. Nephrol.Dial.Transplant., Vol.21, No.10, pp. 2943-2947. Watson, C.J. et al. (2000). Identification of polymorphisms within the vascular endothelial growth factor (VEGF) gene: correlation with variation in VEGF protein production. Cytokine, Vol.12, No.8, pp. 1232-1235. Wieslander, A.P. et al. (1991). Toxicity of peritoneal dialysis fluids on cultured fibroblasts, L929. Kidney Int., Vol.40, No.1, pp. 77-79. Williams, J.D. et al. (2002). Morphologic changes in the peritoneal membrane of patients with renal disease. J.Am.Soc.Nephrol., Vol.13, No.2, pp. 470-479. Williams, J.D. et al. (2003). The natural course of peritoneal membrane biology during peritoneal dialysis. Kidney Int.Suppl., No.88, pp. S43-S49. Witowski, J. et al. (2008). Glucose-induced mesothelial cell senescence and peritoneal neoangiogenesis and fibrosis. Perit.Dial.Int., Vol.28 Suppl.5, pp. S34-S37. Wynn, T.A. (2007). Common and unique mechanisms regulate fibrosis in various fibroproliferative diseases. J.Clin.Invest, Vol.117, No.3, pp. 524-529. Yanez-Mo, M. et al. (2003). Peritoneal dialysis and epithelial-to-mesenchymal transition of mesothelial cells. N.Engl.J.Med., Vol.348, No.5, pp. 403-413. Yang, A.H. et al. (2003). Myofibroblastic conversion of mesothelial cells. Kidney Int., Vol.63, No.4, pp. 1530-1539. Yu, M.A. et al. (2009). HGF and BMP-7 ameliorate high glucose-induced epithelial-tomesenchymal transition of peritoneal mesothelium. J.Am.Soc.Nephrol., Vol.20, No.3, pp. 567-581. Zavadil, J. & Bottinger, E.P. (2005). TGF-beta and epithelial-to-mesenchymal transitions. Oncogene, Vol.24, No.37, pp. 5764-5774. Zeisberg, M. et al. (2003). BMP-7 counteracts TGF-beta1-induced epithelial-to-mesenchymal transition and reverses chronic renal injury. Nat.Med., Vol.9, No.7, pp. 964-968. Zemel, D. et al. (1994). Appearance of tumor necrosis factor-alpha and soluble TNFreceptors I and II in peritoneal effluent of CAPD. Kidney Int., Vol.46, No.5, pp. 1422-1430. Zhang, J. et al. (2008). Vascular endothelial growth factor expression in peritoneal mesothelial cells undergoing transdifferentiation. Perit.Dial.Int., Vol.28, No.5, pp. 497-504. Zhu, F. et al. (2010). Preventive effect of Notch signaling inhibition by a gamma-secretase inhibitor on peritoneal dialysis fluid-induced peritoneal fibrosis in rats. Am.J.Pathol., Vol.176, No.2, pp. 650-659. Zweers, M.M. et al. (1999). Growth factors VEGF and TGF-beta1 in peritoneal dialysis. J.Lab.Clin.Med., Vol.134, No.2, pp. 124-132.
5 Matrix Metalloproteinases Cause Peritoneal Injury in Peritoneal Dialysis Ichiro Hirahara, Tetsu Akimoto, Yoshiyuki Morishita, Makoto Inoue, Osamu Saito, Shigeaki Muto and Eiji Kusano
Division of Nephrology, Department of Internal Medicine, Jichi Medical University Japan 1. Introduction Long-term peritoneal dialysis (PD) leads to peritoneal injury with functional decline, such as ultrafiltration loss. Peritoneal injury is often accompanied by histological changes, such as peritoneal fibrosis and sclerosis. These complications involve evident diffuse fibrous thickening and/or edema of the peritoneum, and chronic inflammation (epithelial to mesenchymal transition of mesothelial cells as well as migration and proliferation of polynuclear leucocytes, macrophages, and mesenchymal cells in the peritoneum). At worst, peritoneal injury leads to encapsulating peritoneal sclerosis (EPS), a serious complication of PD [1-6]. At early stage of EPS (preEPS stage), peritoneal effluent with signs of inflammation is often observed [2]. At advanced stages of EPS, the small intestine adheres and is encapsulated within a collagen rich thick peritoneum to form a cocoon-like mass. As a result, EPS is associated with clinical symptoms, such as loss of appetite, nausea, vomiting, and emaciation due to malnutrition, as well as symptoms of intestinal obstruction that include abdominal pain, diarrhea, constipation, or lowered peristaltic bowel sounds. The incidence of EPS is not high: it occurs in about 0.4%–3.3% of patients who undergo PD. However, EPS has a high mortality rate, about half of the patients with EPS die [2-5]. The causes of functional disorders of the peritoneum are believed to be fibrosis, sclerosis, inflammation, angiogenesis, and vasculopathy. Peritoneal injury is probably caused by multiple factors, such as infection with bacteria or fungi resulting in peritonitis [2, 5, 6]; antiseptics [7-11]; exogenous materials like particulates and plasticizers [7]; and continuous exposure to nonphysiological PD solutions having high concentrations of glucose and glucose degradation products (GDPs), low pH, and high osmolarity [2, 12, 13]. Administration of corticosteroids, tamoxifen, immunosuppressive agents, and total parenteral nutrition are effective in the early stage of EPS development [2-4, 6]. However, for advanced EPS, in which bowel adhesions have formed, the only effective therapeutic method is surgical dissection of the encapsulated peritoneum; this must be performed by skilled surgeons using specialized techniques [2-5, 7]. It is important to monitor peritoneal injury, and develop methods for an early diagnosis of EPS. At present, major diagnostic methods for EPS include abdominal palpation (for identification of a mass) and finding clinical symptoms of bowel obstruction, like those found in the ileus [2]. However, these are not objective criteria and it is not rare that no typical symptoms are found even in advanced cases of EPS. Some physicians utilize diagnostic imaging methods for detection of EPS, such
76
Progress in Peritoneal Dialysis
as X-ray, computed tomography, and ultrasonography; however, these methods are not suitable for early diagnosis because they can detect only EPS in an advanced stage [2, 3, 6]. C-reactive protein (CRP) and interleukin-6 (IL-6) are often used as biochemical markers for inflammation [2, 6, 14, 15]. However, since their levels also increase during infectious peritonitis, they are inadequate to be used as definitive diagnostic markers that can differentiate EPS from infectious peritonitis [14]. As mentioned previously, corticosteroids and immunosuppressive agents have been employed as effective initial therapies for EPS [24, 6]; however these drugs, compromise the immune system with the risk of aggravating symptoms when administered to patients with infectious peritonitis. Therefore, a method can differentiate EPS from infectious peritonitis is required for the early diagnosis of EPS. To perform PD safely, it is important to monitor peritoneal injury that may progress to EPS and diagnose EPS at an early stage; it is then necessary to prevent peritoneal injury from developing into severe EPS. During tissue injury, such as sclerosis or fibrosis, tissue destruction and excessive remodeling occur. In such events, matrix metalloproteinases (MMPs) degrade components of the extracellular matrix (ECM) and play significant roles in regulating angiogenesis, epithelial to mesenchymal transition, and migration of cells that promote fibroplasias or inflammation. MMP-1, an interstitial collagenase, degrades types I, II, III, VII, and X collagen. MMP-2, a gelatinase, degrades gelatin, type IV collagen, fibronectin, laminin, proteoglycan, and elastin. MMP-3, a stromelysin, degrades proteoglycan, gelatin, fibronectin, laminin, elastin, and type IV collagen. MMP-9, a gelatinase, degrades gelatin, type IV collagen, proteoglycans, elastin, and entactin. Membrane-type MMP-1 (MT1-MMP) contains a C-terminal transmembrane domain that anchors to the plasma membrane and cleaves proMMP-2 to produce its active form on the cell surface. Tissue inhibitors of MMP (TIMPs) inhibit ECM degradation by MMPs and play important roles in the proteolytic/antiproteolytic balance. TIMP-2 inhibits the activity of MT-MMPs, but TIMP-1 does not. MMP expression is enhanced in various tissues during inflammation, fibrosis and sclerosis. Increased serum levels of MMP-1 and MMP-3 in rheumatoid arthritis [16], MMP-1, MMP-8, and MMP-9 in cystic fibrosis [17], MMP-9 in chronic obstructive pulmonary disease [18], MMP-2, MMP-9, and TIMP-1 in acute coronary syndrome [19], MMP-9 and TIMP-1 in aortic sclerosis [20], MMP-2 in liver cirrhosis [21], MMP-2 and TIMP-1 in hepatic fibrosis [22], and MMP-2 in chronic kidney disease [23, 24] suggest a relationship between MMP levels and pathology of tissue injury.
2. Production of MMP-2 in animal models of peritoneal injury MMP-2 production increases in animal models of peritoneal injury induced by stimuli such as antiseptics, exogenous materials, and GDPs. In rodent models of peritoneal injury, the development of EPS was analyzed by injecting the antiseptic chlorhexidine gluconate into the peritoneal cavity to induce inflammation [7-11]. In this model, MMP-2 levels in the peritoneal effluent and MMP-2 gene expression in the peritoneum correlated with changes in thickness of the peritoneum, inflammation, D/D0 glucose levels, and net ultrafiltration. In another model, peritoneal injury was induced by injecting talc, an exogenous material, into the peritoneal cavity. MMP-2 levels in the peritoneal effluent and MMP-2 gene expression in the peritoneum increased with the development of peritoneal injury [7]. GDPs are generated in PD solutions during heat sterilization and storage, and contribute to the bioincompatibility of conventional PD
Matrix Metalloproteinases Cause Peritoneal Injury in Peritoneal Dialysis
77
solutions. MMP-2 levels in the peritoneal effluent increased in models of peritoneal injury induced by methylglyoxal (MGO) or formaldehyde, both extremely toxic GDPs [12, 13]. In models of peritoneal injury induced by chlorhexidine gluconate and MGO, abdominal cocoons were often formed, while in models induced by talc and formaldehyde, adhesions of the peritoneum were observed [7-9, 11, 12]. In many animal models of peritoneal injury, MMP-2 levels in the peritoneal effluent correlated with changes in inflammation, thickness of the peritoneum, D/D0 glucose levels, and net ultrafiltration. Thus, peritoneal injury is caused by increased MMP-2 induced by various stimuli, such as antiseptics, exogenous materials, and GDPs in the PD solution. Therefore, MMP-2 may play an important role in the development of peritoneal injury leading to EPS.
3. MMPs as peritoneal injury markers in clinical diagnosis Results of the peritoneal equilibration test (PET) performed clinically have shown that MMP-2, -3, and TIMP-1 levels in the peritoneal effluent correlate with peritoneal injury (Figure 1) [25, 26]. PET is the method most frequently used to estimate PD efficiency and peritoneal injury [2, 27]. MMP-3 levels are influenced by gender and etiology of end-stage renal disease [26] and TIMP-1 expression is known to be induced by various factors, such as IL-1, tumor necrosis factor-α, and transforming growth factor-β [23]; however, MMP-2 is usually expressed constitutively. MMP-3 and TIMP-1 may therefore be more easily affected by various factors than MMP-2. The measured D/S ratios of MMP-3 were nearly equal to the predicted D/S ratios when MMP-3 was transported only from the circulation [26]. This result suggests that most MMP-3 in the peritoneal effluent may be transported from the circulation. In contrast, the measured D/S ratios of MMP-2 and TIMP-1 were significantly higher than those predicted [26]. In addition, the correlation coefficient between the drainage levels of MMP-2 and TIMP-1 was higher than that between the drainage levels of MMP-2 and MMP-3 [26]. The difference between the measured D/S ratio and the predicted ratio may be attributable to the local production of MMP-2 and TIMP-1 in the peritoneal tissue along with their transport from the circulation [28]. In addition, MMP-1 and TIMP-2 were not detected in the peritoneal effluent of most patients. Therefore, MMP-1 and TIMP-2 are unsuitable as markers for determining the extent of peritoneal injury. These results suggest that MMP-2 may be a more useful marker of peritoneal injury with increased solute transport than other MMPs or TIMPs. IL-6, hyaluronic acid, and cancer antigen (CA) 125 are often used as markers of peritoneal injury [2, 29]. In the study by Kaku et al., although the sample size was not sufficient for a statistically significant relationship, the correlation coefficient between the peritoneal solute transport rate and MMP-2 levels was higher than that for IL-6, hyaluronic acid, or CA125 [15]. MMP-2 and/or MMP-9 degrade the endothelial basal lamina and increase vascular permeability [30]. Swann et al. have also reported that an increase in the permeability of the blood-brain barrier is associated with an increase in MMP levels, which digests the endothelial basal lamina that forms the barrier [31]. In PD, the microvascular wall and probably the interstitial tissue are the main barriers for peritoneal fluid and solute transport. MMP-2 digests type IV collagen and laminin, which are the main basement membrane components of the microvascular wall and the mesothelial layer. Thus, injury to the basement membrane by MMP-2 may result in fast solute transport rates. Giebel et al. have reported that elevated MMP-2 or MMP-9 expression in the retina may facilitate an increase
78
Progress in Peritoneal Dialysis
in vascular permeability by degrading occludin, the tight junction protein of endothelial or epithelial cells [32]. Osada et al. have reported that MMP-2 was mainly observed around
(A)
(B)
Fig. 1. Relationship between the peritoneal solute transport rate and MMP-2 levels in the peritoneal effluent. The peritoneal solute transport rate was assessed using PET. MMP-2 levels in the peritoneal effluent obtained from PET were analyzed by enzyme-linked immunosorbent assay. (A) D/P creatinine ratios versus MMP-2 levels. (B) D/D0 glucose ratios versus MMP-2 levels. the blood vessels in the peritoneal tissues from long-term PD patients [33]. In PD, destruction of the tight junction of endothelial cells by MMP-2 may result in hyperpermeability of the peritoneum. From these studies, it is apparent that MMP-2 may directly increase the permeability of the peritoneum by destruction of the basement membrane and tight junction of endothelial cells. A multi-center clinical study and a case report revealed markedly increased MMP-2 levels in peritoneal effluents of patients with moderate peritoneal injury with ascites [2, 25, 34]. In addition, EPS was shown to develop in more than half the patients having MMP-2 levels of more than 600 ng/ml, although half of the patients had been treated with steroids [26]. On the other hand, MMP-2 levels in the effluents of patients with EPS tended to be lower than those of patients with moderate peritoneal injury [26]. In advance-stage of EPS, the inflammation is weak and then MMP-2 levels in the effluents may be decreased. These findings suggest that a change in MMP-2 levels may be used as indicator of peritoneal injury or progression to EPS. MMP-9 is hardly detected in the peritoneal effluent of patients without infectious peritonitis. However, in patients with infectious peritonitis, MMP-9 levels in the peritoneal effluent increased markedly with a slight increase in MMP-2 levels [25, 35, 36]. These findings suggest that peritoneal injury that may lead to EPS can be clearly distinguished from infectious peritonitis by analyzing MMP-2 and MMP-9 levels in the peritoneal effluent (Figure 2). Many biomarkers, such as IL-6 and CRP, increase during peritoneal injury and infectious peritonitis. Therefore, MMP-2 may be a useful indicator for peritoneal injury that can differentiate from infectious peritonitis.
Matrix Metalloproteinases Cause Peritoneal Injury in Peritoneal Dialysis
79
Fig. 2. Analysis of the peritoneal effluent with gelatin zymography. Gelatinases in the peritoneal effluent were analyzed by gelatin zymography. Gelatinases were detected as unstained proteolytic bands in gel stained with Coomassie Brilliant Blue. Lane 1: MMP marker (Chemicon International, Inc., Temecula, CA, USA). Lane 2: Control patient. Lane 3: Patient with mild peritoneal injury. Lane 4: Patient with moderate peritoneal injury (preEPS). Lane 5: Patient with severe peritoneal injury (EPS). Lane 6: Patient with bacterial peritonitis. Minami et al. investigated the correlations between β2-microglobulin (β2MG) and peritoneal injury biomarkers (e.g. hyaluronic acid, IL-6, MMP-2) in the peritoneal effluent obtained from a 7.5% icodextrin-based PD solution (ICO effluent) [37]. β2MG, hyaluronic acid, and MMP-2 levels in the ICO effluent were significantly higher than those in the 2.27% glucosebased PD solution effluent. There was a trend toward higher IL-6 levels in the ICO effluent, although no significant differences were seen. There were positive correlations between the levels of various biomarkers and β2MG. Those authors proposed that subclinical injury of the peritoneum by ICO treatment may accelerate peritoneal permeability to increase β2MG in the effluent. Nishina et al. have reported that MMP-2 levels decreased in the peritoneal effluent and peritoneal function improved when conventional solutions (acidic pH and containing high levels of GDPs) were replaced with new PD solutions (neutral pH and containing low levels of GDPs) in high-transporter patients undergoing PD [38]. Thus MMPs are possible markers of peritoneal injury that can differentiate from infectious peritonitis. A diagnostic method using peritoneal effluents enables easy sampling, is noninvasive, and is not painful for patients. An MMP-9 test kit has been developed to diagnose
80
Progress in Peritoneal Dialysis
infectious peritonitis. This kit consists of an anti-MMP-9 antibody conjugated to a colloidal dye designed to detect MMP-9 in a nitrocellulose membrane dipstick assay based on immunochromatography [36, 39]. The diagnosis can be successfully completed within 10 min. If such a test kit were developed for MMP-2, peritoneal injury could be monitored easily and rapidly at home.
4. Production of MMP-2 in the peritoneum MMP-2 in the peritoneal tissue and effluent is considered to be primarily derived from activated cells in the peritoneum. Gene expression analysis and/or immunohistochemistry analysis revealed that MMP-2, MT1-MMP, and TIMP-2 are produced in the peritoneal tissue [7-13, 25]. MMP-2 is produced by peritoneal cells, such as macrophages, mesenchymal cells, endothelial cells, and mesothelial cells (Figures 3 and 4, Table). These peritoneal cells are activated by various stimuli, such as infectious peritonitis; exogenous materials like particulates; antiseptics; advanced glycation products; and GDPs and also the pH of the PD solution. These activated cells produce various cytokines, growth factors, and other mediators that induce peritoneal injury. Macrophages may infiltrate or migrate into the peritoneum while ECM is being degraded by MMP-2 produced by these cells [8, 12]. In cultured human mesothelial cells, the production of MMP-2 is upregulated by transforming growth factor-β and is decreased by thrombin [40-42]. Activated mesothelial cells transform to mesenchymal cells and then the epithelial-to-mesenchymal transition of mesothelial cells subsequently induces MMP-2 production [13, 43]. Transformed mesothelial cells may invade the peritoneum while ECM is being digested by MMP-2 and upregulates the production of vascular endothelial growth factor that enhances angiogenesis, nitric oxide synthesis, and vascular permeability [25, 26].
Fig. 3. MMP-2 production in the peritoneum of rat models of peritoneal injury. MMP-2 production in the parietal peritoneum was immunohistologically analyzed using an anti-MMP-2 antibody. (A) The histological image of the parietal peritoneum of the talctreated rats. Mesenchymal cells, macrophages, and peritoneal mesothelial cells that produce MMP-2 are shown by shaded arrow heads, open arrow heads, and closed arrow heads, respectively. (B) The histological image of the parietal peritoneum of the chlorhexidine gluconate-treated rats. Macrophages and vascular endothelial cells are shown by open arrow heads and shaded arrow heads, respectively.
Matrix Metalloproteinases Cause Peritoneal Injury in Peritoneal Dialysis
MMP-2-producing cells
target of MMP-2
histological change
macrophages mesenchymal cells (fibroblasts) mesothelial cells endothelial cell
ECM ECM ECM, BM ECM, BM
inflammation fibrosis, inflammation EMT angiogenesis
81
ECM: extracellular matrix, BM: basement membrane, EMT: epithelial-to-mesenchymal transition
Table 1. Tissue destruction by MMP-2 in the peritoneum
Fig. 4. Tissue destruction by MMP-2 in the peritoneum. MMP-2 is assumed to destroy peritoneal tissue. Macrophages may infiltrate or migrate into the peritoneum while ECM is being degraded by the MMP-2 produced by these cells. Mesothelial cells may transform to mesenchymal cells (epithelial to mesenchymal transition: EMT) and infiltrate or migrate into the peritoneum, which is being digested by MMP-2. Activated mesenchymal cells synthesize ECM proteins that lead to peritoneal fibrosis or migrate during the disassemble of ECM of the peritoneum by MMP-2. Angiogenesis of capillaries may occur while ECM is being degraded by MMP-2 produced by activated endothelial cells. Del Peso et al. have reported that the transition of mesothelial cells to mesenchymal cells is an early event during PD and is associated with fast peritoneal transport [44], which may explain why drainage levels of MMP-2 reflects the peritoneal transport ratio. Activated mesenchymal cells, such as myofibroblasts or fibroblasts, synthesize ECM proteins or migrate during the disassemble of ECM of the peritoneum by MMP-2 or other proteinases [8-12, 33]. Presence of excessive ECM proteins, such as collagen, leads to peritoneal fibrosis
82
Progress in Peritoneal Dialysis
with peritoneal thickening and promotes the production of MMP-2 by myofibroblasts [9]. In addition, neomicrovascularization may occur while ECM is being degraded by MMP-2 produced by activated endothelial cells in the microvasculature [10, 12, 33]. According to the results of D/S ratio analysis, most MMP-2 in the peritoneal effluent is not transported from the circulation [26]. The measured D/S ratios of MMP-2 were higher than those predicted when MMP-2 was transported from the circulation only by diffusion. In summary, MMP-2 is produced by various peritoneal cells activated by a variety of stimuli. Because MMP-2 is produced primarily in the peritoneum, its drainage levels may indicate the condition of peritoneal injury.
5. Protection from peritoneal injury by inhibition of MMP-2 Peritoneal injury may be avoided by drugs that inhibit MMP-2 activity. Ro et al. have reported that the MMP inhibitor ONO-4817 controlled angiogenesis, infiltration of macrophage, and peritoneal fibrosis in rat models of peritoneal sclerosis [10], which suggests the possibility of protection from peritoneal injury by inhibition of MMP-2 activities. Angiotensin-converting enzyme (ACE) inhibitors have been shown to have inhibitory effects on MMP-2 activity [45, 46]. Yamamoto et al. have proposed a mechanism for the inhibitory specificity of ACE inhibitors against MMP-2 using three-dimensional models of the MMP-2-ACE inhibitor complex. Furthermore, these authors showed that ACE inhibitors directly inhibited MMP-2 activity in the peritoneal effluent from patients on PD [47]. In experimental animal models, use of ACE inhibitors protected the animals from peritoneal injury with fibrosis thickening and functional decline, such as increased solute transport [4850]. Sampimon et al. have reported the clinical possibility of a protective effect of ACE inhibitors on the development of EPS although it did not achieve statistical significance [51]. Thus, randomized controlled trials are needed to determine the level of protection gained against peritoneal injury using drugs, such as ACE inhibitors, that have an inhibitory effect on MMP-2 activity.
6. Conclusions MMPs play critical roles in peritoneal injury. To perform PD safely, it is important to clarify the mechanisms by which MMPs cause peritoneal injury. MMP levels in the peritoneal effluent may be used as markers of peritoneal injury that can differentiate early EPS from infectious peritonitis. In addition, patients undergoing PD may be protected against peritoneal injury by controlling MMP activities. Future studies should examine the changes in MMP-2 levels with regard to progression of peritoneal injury to EPS and confirm the effects of MMPs inhibitors in controlling peritoneal injury
7. References [1] Gandhi VC, Humayun HM, Ing TS, Daugirdas JT, Geis WP, Hano JE. Sclerotic thickening of the peritoneal membrane in maintenance peritoneal dialysis patients. Arch Intern Med 1980; 140: 1201-1203. [2] Kawanishi H, Moriishi M, Ide K, Dohi K. Recommendation of the surgical option for treatment of encapsulating peritoneal sclerosis. Perit Dial Int 2008; 28 Suppl 3: S205210.
Matrix Metalloproteinases Cause Peritoneal Injury in Peritoneal Dialysis
83
[3] Balasubramaniam G, Brown EA, Davenport A, Cairns H, Cooper B, Fan SL, Farrington K, Gallagher H, Harnett P, Krausze S, Steddon S. The Pan-Thames EPS study: treatment and outcomes of encapsulating peritoneal sclerosis. Nephrol Dial Transplant 2009; 24, 3209-3215. [4] Brown MC, Simpson K, Kerssens JJ, Mactier RA; Scottish Renal Registry. Encapsulating peritoneal sclerosis in the new millennium: a national cohort study. Clin J Am Soc Nephrol 2009; 4:1222-1229. [5] Johnson DW, Cho Y, Livingston BE, Hawley CM, McDonald SP, Brown FG, Rosman JB, Bannister KM, Wiggins KJ. Encapsulating peritoneal sclerosis: incidence, predictors, and outcomes. Kidney Int 2010; 77: 904-912. [6] Brown EA, Van Biesen W, Finkelstein FO, Hurst H, Johnson DW, Kawanishi H, PecoitsFilho R, Woodrow G; ISPD Working Party. Length of time on peritoneal dialysis and encapsulating peritoneal sclerosis: position paper for ISPD. Perit Dial Int 2009; 29: 595-600. [7] Hirahara I, Umeyama K, Urakami K, Kusano E, Masunaga Y, Asano Y. Serial analysis of matrix metalloproteinase-2 in dialysate of rat sclerosing peritonitis models. Clin Exp Nephrol 2001; 5:103-108. [8] Hirahara I, Umeyama K, Shofuda K, Kusano E, Masunaga Y, Honma S, Asano Y. Increase of matrix metalloproteinase-2 in dialysate of rat sclerosing encapsulating peritonitis model. Nephrology 2002; 7: 161-169. [9] Hirahara I, Ogawa Y, Kusano E, Asano Y. Activation of matrix metalloproteinase-2 causes peritoneal injury during peritoneal dialysis in rats. Nephrol Dial Transplant 2004; 19: 1732-1741. [10] Ro Y, Hamada C, Inaba M, Io H, Kaneko K, Tomino Y. Inhibitory effects of matrix metalloproteinase inhibitor ONO-4817 on morphological alterations in chlorhexidine gluconate-induced peritoneal sclerosis rats. Nephrol Dial Transplant 2007; 22: 2838-2848. [11] Kurata K, Maruyama S, Kato S, Sato W, Yamamoto J, Ozaki T, Nitta A, Nabeshima T, Morita Y, Mizuno M, Ito Y, Yuzawa Y, Matsuo S. Tissue-type plasminogen activator deficiency attenuates peritoneal fibrosis in mice. Am J Physiol Renal Physiol 2009; 297: F1510-1517. [12] Hirahara I, Kusano E, Yanagiba S, Miyata Y, Ando Y, Muto S, Asano Y. Peritoneal injury by methylglyoxal in peritoneal dialysis. Perit Dial Int 2006; 26: 380-392. [13] Hirahara I, Ishibashi Y, Kaname S, Kusano E, Fujita T. Methylglyoxal induces peritoneal thickening by mesenchymal-like mesothelial cells in rats. Nephrol Dial Transplant 2009; 24: 437-447. [14] Hind CR, Thomson SP, Winearls CG, Pepys MB. Serum C-reactive protein concentration in the management of infection in patients treated by continuous ambulatory peritoneal dialysis. J Clin Pathol 1985; 38: 459-463. [15] Kaku Y, Nohara K, Tsutsumi Y, Kanemitsu S, Hara T, Yoshimura H, Hirahara I, Kusano E. The relationship among the markers of peritoneal function such as PET, MMP-2, IL-6 etc, in pediatric and adolescent PD patients. Jin To Touseki 2004; 57 (Suppl): 296-298. [16] Green MJ, Gough AK, Devlin J, et al. Serum MMP-3 and MMP-1 and progression of joint damage in early rheumatoid arthritis. Rheumatology 2003; 42: 83-88.
84
Progress in Peritoneal Dialysis
[17] Roderfeld M, Rath T, Schulz R, Seeger W, Tschuschner A, Graf J, Roeb E. Serum matrix metalloproteinases in adult CF patients: Relation to pulmonary exacerbation. J Cyst Fibros 2009; 8: 338-347. [18] Brajer B, Batura-Gabryel H, Nowicka A, Kuznar-Kaminska B, Szczepanik A. Concentration of matrix metalloproteinase-9 in serum of patients with chronic obstructive pulmonary disease and a degree of airway obstruction and disease progression. J Physiol Pharmacol 2008; 59 Suppl 6: 145-152. [19] Tziakas DN, Chalikias GK, Parissis JT, Hatzinikolaou EI, Papadopoulos ED, Tripsiannis GA, Papadopoulou EG, Tentes IK, Karas SM, Chatseras DI. Serum profiles of matrix metalloproteinases and their tissue inhibitor in patients with acute coronary syndromes. The effects of short-term atorvastatin administration. Int J Cardiol 2004; 94: 269-277. [20] Rugina M, Caras I, Jurcut R, Jurcut C, Serbanescu F, Salageanu A, Apetrei E. Systemic inflammatory markers in patients with aortic sclerosis. Roum Arch Microbiol Immunol 2007; 66: 10-16. [21] Murawaki Y, Yamada S, Ikuta Y, Kawasaki H. Clinical usefulness of serum matrix metalloproteinase-2 concentration in patients with chronic viral liver disease. J Hepatol 1999; 30: 1090-1098. [22] Kasahara A, Hayashi N, Mochizuki K, Oshita M, Katayama K, Kato M, Masuzawa M, Yoshihara H, Naito M, Miyamoto T, Inoue A, Asai A, Hijioka T, Fusamoto H, Kamada T. Circulating matrix metalloproteinase-2 and tissue inhibitor of metalloproteinase-1 as serum markers of fibrosis in patients with chronic hepatitis C. Relationship to interferon response. J Hepatol 1997; 26: 574-583. [23] Jones CL. Matrix degradation in renal disease. Nephrology 1996; 2: 13-23. [24] Nagano M, Fukami K, Yamagishi S, Ueda S, Kaida Y, Matsumoto T, Yoshimura J, Hazama T, Takamiya Y, Kusumoto T, Gohara S, Tanaka H, Adachi H, Okuda S. Circulating matrix metalloproteinase-2 is an independent correlate of proteinuria in patients with chronic kidney disease. Am J Nephrol 2009; 29: 109-115. [25] Hirahara I, Inoue M, Okuda K, Ando Y, Muto S, Kusano E. The potential of matrix metalloproteinase-2 as a marker of peritoneal injury, increased solute transport, or progression to encapsulating peritoneal sclerosis during peritoneal dialysis--a multicentre study in Japan. Nephrol Dial Transplant 2007; 22: 560-567. [26] Hirahara I, Inoue M, Umino T, Saito O, Muto S, Kusano E. Matrix metalloproteinase levels in the drained dialysate reflect the peritoneal solute transport rate: A multicenter study in Japan. Nephrol Dial Transplant 2011; 26: 1695-1701. [27] Twardowski ZJ, Nolph KD, Khanna R, et al. Peritoneal equilibration test. Perit Dial Bull 1987; 7: 138-147. [28] Zweers MM, de Waart DR, Smit W, Struijk DG, Krediet RT. Growth factors VEGF and TGF-beta1 in peritoneal dialysis. J Lab Clin Med 1999; 134: 124-132. [29] Coester AM, Smit W, Struijk DG, Krediet RT. Peritoneal function in clinical practice: the importance of follow-up and its measurement in patients. Recommendations for patient information and measurement of peritoneal function. Nephrol Dial Transplant Plus 2009; 2: 104-110. [30] Soccal PM, Gasche Y, Pache JC, et al. Matrix metalloproteinases correlate with alveolarcapillary permeability alteration in lung ischemia-reperfusion injury. Transplantation 2000; 70: 998-1005.
Matrix Metalloproteinases Cause Peritoneal Injury in Peritoneal Dialysis
85
[31] Swann K, Berger J, Sprague SM, et al. Peripheral thermal injury causes blood-brain barrier dysfunction and matrix metalloproteinase (MMP) expression in rat. Brain Res 2007; 1129: 26-33. [32] Giebel SJ, Menicucci G, McGuire PG, Das A. Matrix metalloproteinases in early diabetic retinopathy and their role in alteration of the blood-retinal barrier. Lab Invest 2005; 85: 597-607. [33] Osada S, Hamada C, Shimaoka T, Kaneko K, Horikoshi S, Tomino Y. Alterations in proteoglycan components and histopathology of the peritoneum in uraemic and peritoneal dialysis (PD) patients. Nephrol Dial Transplant 2009; 24: 3504-3512. [34] Masunaga Y, Hirahara I, Shimano Y, Kurosu M, Iimura O, Miyata Y, Amemiya M, Homma S, Kusano E, Asano Y. A case of encapsulating peritoneal sclerosis at the clinical early stage with high concentration of matrix metalloproteinase-2 in peritoneal effluent. Clin Exp Nephrol 2005; 9: 85-89. [35] Fukudome K, Fujimoto S, Sato Y, Hisanaga S, Eto T. Peritonitis increases MMP-9 activity in peritoneal effluent from CAPD patients. Nephron 2001; 87: 35-41. [36] Ro Y, Hamada C, Io H, Hayashi K, Hirahara I, Tomino Y. Rapid, simple, and reliable method for the diagnosis of CAPD peritonitis using the new MMP-9 test kit. J Clin Lab Anal 2004; 18: 224-230. [37] Minami S, Hora K, Kamijo Y, Higuchi M. Relationship between effluent levels of beta(2)-microglobulin and peritoneal injury markers in 7.5% icodextrin-based peritoneal dialysis solution. Ther Apher Dial 2007; 11: 296-300. [38] Nishina M, Endoh M, Suzuki D, et al. Neutral-pH peritoneal dialysis solution improves peritoneal function and decreases matrix metalloproteinase-2 (MMP-2) in patients undergoing continuous ambulatory peritoneal dialysis (CAPD). Clin Exp Nephrol 2004; 8: 339-343. [39] Ro Y, Hamada C, Io H, Hayashi K, Inoue S, Hirahara I, Tomino Y. Early diagnosis of CAPD peritonitis using a new test kit for detection of matrix metalloproteinase (MMP)-9. Perit Dial Int 2004; 24: 90-91. [40] Martin J, Yung S, Robson RL, Steadman R, Davies M. Production and regulation of matrix metalloproteinases and their inhibitors by human peritoneal mesothelial cells. Perit Dial Int 2000; 20: 524-533. [41] Naiki Y, Matsuo K, Matsuoka T, Maeda Y. Possible role of hepatocyte growth factor in regeneration of human peritoneal mesothelial cells. Int J Artif Organs 2005; 28: 141149. [42] Haslinger B, Mandl-Weber S, Sitter T. Thrombin suppresses matrix metalloproteinase 2 activity and increases tissue inhibitor of metalloproteinase 1 synthesis in cultured human peritoneal mesothelial cells. Perit Dial Int 2000; 20: 778-783. [43] Margetts PJ, Bonniaud P, Liu L, et al. Transient overexpression of TGF-{beta}1 induces epithelial mesenchymal transition in the rodent peritoneum. J Am Soc Nephrol 2005; 16: 425-436. [44] Del Peso G, Jiménez-Heffernan JA, Bajo MA, et al. Epithelial-to-mesenchymal transition of mesothelial cells is an early event during peritoneal dialysis and is associated with high peritoneal transport. Kidney Int 2008; 108 (Suppl): S26-33. [45] Lods N, Ferrari P, Frey FJ, Kappeler A, Berthier C, Vogt B, Marti HP. Angiotensinconverting enzyme inhibition but not angiotensin II receptor blockade regulates
86
[46]
[47]
[48]
[49]
[50]
[51]
Progress in Peritoneal Dialysis
matrix metalloproteinase activity in patients with glomerulonephritis. J Am Soc Nephrol 2003; 14: 2861-2872. Williams RN, Parsons SL, Morris TM, Rowlands BJ, Watson SA. Inhibition of matrix metalloproteinase activity and growth of gastric adenocarcinoma cells by an angiotensin converting enzyme inhibitor in in vitro and murine models. Eur J Surg Oncol 2005; 31: 1042-1050. Yamamoto D, Takai S, Hirahara I, Kusano E. Captopril directly inhibits matrix metalloproteinase-2 activity in continuous ambulatory peritoneal dialysis therapy. Clin Chim Acta 2010; 411: 762-764. Imai H, Nakamoto H, Ishida Y, Yamanouchi Y, Inoue T, Okada H, Suzuki H. Reninangiotensin system plays an important role in the regulation of water transport in the peritoneum. Adv Perit Dial 2001; 17: 20-24. Sawada T, Ishii Y, Tojimbara T, Nakajima I, Fuchinoue S, Teraoka S. The ACE inhibitor, quinapril, ameliorates peritoneal fibrosis in an encapsulating peritoneal sclerosis model in mice. Pharmacol Res 2002; 46: 505-510. Duman S, Wieczorowska-Tobis K, Styszynski A, Kwiatkowska B, Breborowicz A, Oreopoulos DG. Intraperitoneal enalapril ameliorates morphologic changes induced by hypertonic peritoneal dialysis solutions in rat peritoneum. Adv Perit Dial 2004; 20: 31-36. Sampimon DE, Kolesnyk I, Korte MR, Fieren MW, Struijk DG, Krediet RT. Use of angiotensin ii inhibitors in patients that develop encapsulating peritoneal sclerosis. Perit Dial Int 2010; 30: 656-659.
6 Proteomics in Peritoneal Dialysis Hsien-Yi Wang1,2, Hsin-Yi Wu3 and Shih-Bin Su4,5
2Department
1Department of Nephrology, Chi-Mei Medical Center, Tainan of Sports Management, College of Leisure and Recreation Management, Chia Nan University of Pharmacy and Science, Tainan 3Institute of Chemistry, Academia Sinica, Taipei 4Department of Family Medicine, Chi-Mei Medical Center, Tainan 5Department of Biotechnology, Southern Taiwan University, Tainan Taiwan
1. Introduction Relatively little is known about proteins in peritoneal effluent, that are lost or changed during peritoneal dialysis(PD) and in different diseases, leaving various unclear questions. Biomarkers that can indicate damages caused by peritoneal dialysis, like cancer antigen 125 and interleukin-6 are some exemples. Therefore, tools such as proteomic approaches that can globally identify, characterize, and quantify a set of proteins and their changes in peritoneal dialysate, could shed light to the mechanisms of peritonitis and membrane damage. The availability of fluid from dialysis for study and the potential importance of specific protein change during peritoneal dialysis making this a potentially fruitful area for further observation. Since the renal community is embracing proteomic technologies at an increasing rate, growing numbers of studies that would be carried out through this process can be envisaged. In this chapter we intend to introduce basic proteomic tools and highlight important advances in peritoneal dialysis using proteomic approaches as well as the future perspective that proteomic tools can contribute in the field of peritoneal dialysis
2. Proteomic tools In recent years, proteomic analyses of particular biological samples or clinical samples have drawn much interest and provided much information. Proteomic tools such as two dimensional gel electrophoresis (2DE) and mass spectrometry analysis have been widely applied in the study of body fluids, e.g. cerebrospinal fluid, pleural and pericardial effusions (Liu et al. 2008; Tyan et al. 2005a; Tyan et al. 2005b), and urine (Bennett et al. 2008; Tan et al. 2008). For peritoneal dialysis, several issues have been addressed as described in the following sections. . The advantages and disadvantages of the various techniques have been reviewed previously (Fliser et al. 2007; Mischak et al. 2007). 2.1 Two dimensional gel electrophoresis (2DE) Proteins are separated by isoelectric point and size. The protein spot can be visualized by gel staining. It is widely available and the posttranslational modification of the protein can be
88
Progress in Peritoneal Dialysis
revealed by separation of charge forms. However, low-abundance, large, and hydrophobic proteins are difficult to be detected. 2DE is technically demanding and time-consuming. The low number of independent datasets and the high variability of the gel make the definition of biomarkers difficult or even impossible. 2DE with fluorescent labeling of proteins before separation in gel (DIGE) has been proposed to improve reproducibility. Additional expense for fluorescent dyes and three color imaging system is required. 2.2 Liquid chromatography-tandem mass spectrometry (LC-MS/MS) Proteins are digested before separation by liquid chromatography coupled to MS instruments. MS detection is more sensitive than 2DE. It is easily automated, allowing analyzing a serious of samples. Drawback in comparison to 2DE is that information on the molecular mass of the actual biomarker as well as on any posttranslational modifications (PTM) is generally lost. This requires additional tools. 2.3 Surface-enhanced laser desorption ionization (SELDI) Proteins are bound to affinity surface on a MALDI chip. Samples can be enriched for specific low-abundance proteins. Bound proteins are detected in a mass spectrometer. The SELDI technology draws a lot of interest because of its ease of use and its high throughput for biomarker discovery. However, the low-resolution of the mass spectrometer, the large amount of variability between labs, and its lack of reproducibility, hamper its potential clinical application (McLerran et al. 2008). 2.4 Capillary electrophoresis coupled to mass spectrometry (CE-MS) Proteins were separated by elution time in CE and by size in MS. High reproducibility, robustness, high resolution and sensitivity make it a potential technique for biomarker discovery. Its limitation is that proteins can’t be identified without additional steps and only proteins/peptides