Hydrology Days 2003, 117-128
Preliminary Analysis Of Sediment Transport Capacity In The Colorado Plateau Robert T. Milhous Fort Collins Science Center. U.S. Geological Survey.1 Abstract: Previous investigators (Hereford et al, 2002) have postulated there have been three climate regimes in the Colorado Plateau during the 20th Century: 1905-1941, 1942-1977, and 1978-1998. Changes in the ability of four rivers in the Colorado Plateau (USA) to transport sediment were investigated using the time series of an index (STCI) of the ability of the river to transport sediment. The four rivers are the Rio Puerco near Bernardo, NM; Paria River at Lees Ferry, AZ; Sevier River at Hatch, UT; and the Little Colorado at Woodruff, AZ. The index is calibrated to measured sediment concentrations. The Sediment Transport Capacity Index (STCI) time series graphs suggest there was a change in the climate about 1941 and there is a high probability a change in the climate also occurred in 1923. The situation for the postulated change in 1977 is not clear. There does appear to be changes between the dry 1942-1977 period and the wet 1978-1998 period but these are not the same in each of the four rivers. The STCI time series for the Sevier River had the expected pattern because the STCI increased nearly to the pre-1942 values from lower 1942-1977 values. The average STCI for the Little Colorado River increased but not nearly as much as suggested by the change in precipitation. The STCI for the Paria River essentially did not change. The real difference between expected change based on the change in precipitation, and the changes in the other three rivers, is the change in the time series of STCI for the Rio Puerco. The STCI of the Rio Puerco decreased significantly between the 1942-1997 period and the 1978-1998 period.
1.
Introduction
Hereford et al (2002) investigated the variation of precipitation in the Colorado Plateau (USA) during the 20th Century. Their investigation showed there were three periods with similar climate. These periods are: 1) a wet period from 1905-1941 with an annual precipitation on the plateau of about 14.5 inches, 2) a dry period from 1941-1977 with an average precipitation of about 12.5 inches, and 3) another wet period when the average precipitation was about 15 inches (all these were read from the graph in the paper). This paper investigates the changes in sediment transport capacity of four rivers in the Colorado Plateau using an index to the sediment transport capacity. The objective is to determine if changes in the sediment transport capacity reflect the changes in precipitation identified by Hereford et al. The working assumption is that the overall pattern of change in the sediment transport capacity of the four streams should match the change in precipitation. In other words, a change in the climate (precipitation) of the plateau region should cause a change in the sediment transport capacity of rivers in the region. The results presented herein are preliminary with a focus on the analytical approach with less focus on the results obtained from the 1
Fort Collins Science Center. U.S. Geological Survey. 2150 Centre Avenue, Building C. Fort Collins, Colorado. 80526. email:
[email protected]
Hydrology Days 2003
Milhous
analysis. The objective, not completely meet in this paper, is to illustrate how the index can be used to improve understanding of the movement of sediment in the riverine environment when there may be changes in the climate. Information about the ability of a river to move sediment may help in understanding and explaining changes in rivers caused by changes in the climate and construction of reservoirs. One form of the sediment transport capacity index (stci) for a day is: stci = ((Qd-Qcrt)/Qref)
b
where Qd is the daily discharge, Qcrt is a critical discharge determined from characteristics of the substrate or from a sediment load versus streamflow function, b is the slope of the discharge versus sediment load function; and Qref is an arbitrary reference discharge. Other forms of the index will be presented in the following section. An annual value of the index is the sum of daily values. In a previous paper three rivers were studied using the sediment transport capacity index to illustrate the importance of using river sediment size in the analysis of impacts of reservoirs on the river substrate (Milhous, 1997). In another paper, Milhous (1999), the index was applied to the Green River below Flaming Gorge Dam and showed significant changes in the ability of the Green River to transport sediment and in the sediment loads in the river. The four rivers considered in this paper are listed in Table 1. The gauging station on the Rio Puerco near Bernardo, NM is just outside the Colorado Plateau. Table 1. The drainage areas and water discharge of four Colorado Plateau rivers investigated for changes in sediment transport capacity.
Location Rio Puerco near Bernardo, NM Paria River at Lees Ferry, AZ Sevier River at Hatch, UT Little Colorado at Woodruff, AZ
2.
Drainage 2 Area (mi ) 7,350 1,410 340 8,072
Annual Discharge 3 -1 (ft s ) 41.1 28.5 121.0 48.9
The Sediment Transport Capacity Index
The first task is demonstrate the usefulness of the Sediment Transport Capacity Index (STCI) for riverine analysis. The equations are presented first followed by a demonstration of how well the STCI relates to Paria River sediment loads. In this paper STCI means the sum of individual values of stci.
Hydrology Days 2003
118
Sediment Transport Capacity in the Colorado Plateau 2.1.
The equations
A reduction in the streamflows in a river can cause a reduction in the capacity of a river to transport sediment. A series of small runoff events are expected to carry less sediment than one large event with the same volume of water. This logic leads to a sediment transport capacity index (STCI) for a time period of n days of the form: STCI =
∑ Q(i)
b
/ Qref b
i =1, n
where Q(i) is the discharge in day i, Qref an arbitrary reference discharge, b is the exponent in the power relation between sediment load and discharge. The summation is over the number of days (n) in the period. The presentation herein uses annual values of the STCI, this means the summation is over the 365 or 366 days of a water year (stci is the index calculated for one day). The time period used for the discharge is days in this paper; monthly discharges have been used for some applications of the STCI. For small rivers the time period should be less than a day if the data are available. The sediment transport capacity index presented above is useful when considering the transport of sand and fines. For a reach with significant gravel substrate the index should be written as: STCI =
∑ Q(i) ((Q(i) - Qcrt)
b -1
)/ Qref b
i =1, n
where the terms are as above except Qcrt is a critical discharge associated with the size of the gravel. The value of b selected is often in the region of 2 unless the analyst has a reason to select some other value. The use of 2.0 is based on review of a number of the discharge versus sediment load relations. The range in the power term b is considerable depending on the characteristics of the sediment load used its determination. If the total suspended sediment concentration the value of b will be different from the b determined using the suspended sand load. If a discharge versus sediment load function is available, the b from that relation could be used. The assumptions supporting use of a sediment transport capacity index are 1) a change in the index can help an analyst better understand the possibility of change in the sediment regime, and 2) the sediment transport capacity index a better predictor of sediment yield then either annual discharge or peak annual discharge. 2.2
Application to Paria River
Hydrology Days 2003
119
Milhous
Data for the Paria River in Arizona and Utah was used to test the sediment capacity transport index concept (Milhous, 1992). The Paria River, described in Graf et al (1991), is a relatively undeveloped river. Streamflow data are available for the 1924-2002 period and sediment data available for 1950-1976. Milhous (1992) showed the use of annual flows did not lead one to suspect a change in the sediment regime may have occurred. The relation between the peak annual discharge and the sediment load is weaker between the annual discharge and the sediment load.
Measured Load (tons/day)
40000 30000 20000
1968 1967 1973
10000 0 0
100
200
300
400
500
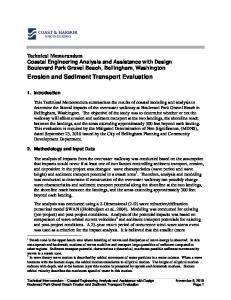
Sediment Transport Capacity Index Figure 1: Relation between measured sediment load and the sediment transport capacity index for the Paria River at Lees Ferry, Arizona. Data are for Water Years 1949 - 1976. The reference discharge was 100 cfs and the power term, b, 1.5.
The 1992 presentation used an assumed a value 2.0 for the power term, b. The measured data contained in the USGS water quality file for the station was used to calibrate the STCI equation to the river. The data in the water quality file is much less than the daily values of suspended sediment load used in determining the annual load. The power term, b, was found to be 1.5 based on the total load and 2.32 based on the sand load. The annual sediment transport capacity index is compared to the measured annual sediment yield in Figure 1. There is scatter in the points but less than shown in Milhous (1992) for the relation between annual flows and sediment load. There are three outliers on Figure 1, the three points for water years 1967, 1968 and 1973. The point most outside the general trend is for 1973. Water year 1973 followed a year with relatively high streamflows that may have Hydrology Days 2003
120
Sediment Transport Capacity in the Colorado Plateau removed enough sediment from the watershed that the even higher flows of 1973 did not have a ready source of sediment to transport. A possible explanation of the 1967 and 1968 pair is that the storm with the highest sediment transport capacity in 1967 was at the very end of the year (23-25 Sept) and the streamflows dropped quickly following the storm. The result may have been storage of sediment in the channels that was easily transported by the modest flows of 1968 (a point based on an average of the two years fits the trend line well).
3. Annual Variation Of The Sediment Transport Capacity Index The time series of the annual Sediment Transport Capacity Index (STCI) for the four rivers are presented in this section. The relation between the STCI and the sediment load is also presented for the Rio Puerco. If the data are available, the average sediment transport capacity and annual discharges for each of the periods used by Hereford et al (2002) are calculated and presented in the following discussions for each of the four rivers. 3.1
Paria River
The annual values of the Sediment Transport Capacity Index (STCI) for the Paria River in Arizona are presented in Figure 2. The power term (2.3) was developed from the relation between sand load and discharge. Graf et al (1991) showed that a decrease in the magnitude and frequency of floods has resulted in considerable storage of sediment in the river by formation of a floodplain. Prior to 1940 a significant floodplain did not exist. Beginning about 1940, a floodplain has been constructed by the river by depositing sediment. After 1980 the deposition ceased because the floods have not been above bank full for the new channel. Two points are apparent from Figure 2. The first is the reduction in sediment transport capacity after 1940; and the second is the almost negligible sediment transport capacity for the 10 years following 1980. The reduction after 1940 is apparent because 25 percent of the annual STCI for the period prior to 1940 are significantly higher then any of the indices for the period from 1940 to the present. The average STCI and annual discharge for the three periods in Hereford et al are presented in Table 2.
Hydrology Days 2003
121
Milhous
Sediment Transport Capacity Index
25000
20000
15000
10000
5000
0 1924
1934 1944
1954
1964
1974 1984
1994
Water Year Figure 2. The annual sediment transport capacity index of the Paria River between 1924 and 2002. The equation used was stci = (Qd/100.0)**2.32; Qd is the daily discharge. Table 2. The average Sediment Transport Capacity Index of the Paria River based on the streamflow record available for the three wet and dry periods from Hereford et al (2002).
Period 1924-41 1942-77 1977-98
STCI 307 117 115
Annual Discharge (cfs) 36.4 25.5 28.3
Note that the annual discharge increased between the second and third periods; in contrast, the STCI decreased slightly. 3.2
Rio Puerco
The Rio Puerco transports considerable fine sediment. The median size of the bed material is 0.06 mm. The relation between STCI and the suspended load in the Rio Puerco is presented in Figure 3. The sediment load for a given sediment transport capacity index appears to have decreased with time and have three periods (1948-1960, 1961-1973, and 1974-1993)with a similar relation between STCI and load. Hydrologic and geomorphologic events have reduced the sediment loads in Colorado Plateau rivers (Gellis et al, 1991).
Hydrology Days 2003
122
Sediment Transport Capacity in the Colorado Plateau The change in the sediment transported at a given STCI in the Rio Puerco may be due to flood plain storage of sediment. The reduction in the STCI is a hydrologic change. Figure 3 was presented in Milhous (1997) which looked at the impact of tributary sediment on the downstream section of a larger river.
Suspended Sediment Load (1000 tonnes)
20000
16000
12000
8000
4000
0 0
100
200
300
400
500
600
700
800
Sediment Transport Capacity Index 1948-1960
1961-1973
1974-1993
Figure 3. The suspended sediment load compared to the sediment transport capacity index (STCI) in the Rio Puerco near Bernardo, New Mexico. The reference discharge was 100 cfs and power term (b) was 1.2.
The annual values of the Sediment Transport Capacity Index (STCI) for the Rio Puerco in New Mexico are presented in Figure 4. The power term (1.2) was developed from the relation between total load and discharge. The reduction in sediment load expected from a given value of the STCI can be interpreted two ways. First, the change in the precipitation process that leads to a reduction of reduction of the STCI can also lead to a reduction of the yield of sediment to the river; and second, more of the sediment is being stored in the floodplain when the STCI is reduced.
Hydrology Days 2003
123
Milhous
Sediment Transport Capacity Index
1000 800 600 400 200 0 1940
1950
1960
1970
1980
1990
2000
Water year Figure 4. The annual sediment transport capacity index of the Rio Puerco between 1940 and 2002. The equation used was stci = (Qd/100.0)**1.20. The solid lines are the average STCI for 1940-1960, 1961-1973, and 19742002.
The average STCI and annual discharge for the three periods in Hereford et al (2002) are presented in Table 3. Table 3. The average Sediment Transport Index of the and annual streamflows of the Rio Puerco based on the streamflow record available for the three wet and dry periods from Hereford, et al (2002).
Annual STCI Discharge (cfs) insufficient data 254 45.3 139 31.4
Period 1905-41 1942-77 1978-98
Note that both the STCI and annual discharge decrease between the periods based on Hereford et al we would expect both to increase.
3.3
Sevier River
The annual STCI time series for the Sevier River at Hatch in Utah is presented in Figure 5. Streamflow data for 1929 - 1939 were not available for the gauge at Hatch. The STCI for this period was estimated using data for the next downstream gauge. The power coefficient (b) was determined using the total load.
Hydrology Days 2003
124
Sediment Transport Capacity in the Colorado Plateau
Sediment Transport Capacity Index
4000
3000
2000
1000
0 1915 1925 1935 1945 1955 1965 1975 1985 1995 Water Year Figure 5. The annual sediment transport capacity of the Sevier River at Hatch between 1915 and 2000. The equation used was stci = (Qd/ 100.0)**1.67. The solid lines are the average STCI for 1915-1940 and 1941-2000.
The average STCI and annual discharge for the three periods in Hereford et al are presented in Table 4. The 1915 period has also been sub-divided based on analysis of the STCI in the Green River (see discussion section). Table 4. The average Sediment Transport Capacity Index and average annual streamflows of the Sevier River based on the streamflow record available for the three wet and dry periods from Hereford, et al (2002). Values are also shown for sub-divisions of the pre-1941 period based on analysis of the STCI in the Green River.
Period 1915-41 1942-77 1978-98 1915-23 1924-41
STCI 971 555 904 1745 584
Annual Discharge (cfs) 140 99 127 204 108
Note that both the STCI and annual discharge behave as expected based on the climate regimes in Hereford et al.
3.4
Little Colorado River
The annual STCI time series for the Little Colorado River is give in Figure 6. Hydrology Days 2003
125
Sediment Transport Capacity Index
Milhous
25000 20000 15000 10000 5000 0 1905 1932 1942 1952 1962 1972 1982 1992 2002 Water Year Figure 6. Time series of the annual sediment transport capacity index for the Little Colorado River at Woodruff, AZ. Data are missing for 1905, 19071929, and 1934-35. The equation use was stci = (Qd/100.0)**2.0.
The average STCI and annual discharge for the three periods in Hereford et al (2002) are presented in Table 5. Table 5. The average Sediment Transport Index of the and annual streamflows of the Little Colorado River based on the streamflow record available for the three wet and dry periods from Hereford, et al (2002).
Period 1930-41 1942-77 1978-98
STCI 3550 1839 2148
Annual Discharge (cfs) 76.1 41.0 48.7
Note that both the STCI and annual discharge behave as expected in Hereford et al except that the increase was not as great as expected.
4.
Discussion
Milhous, (1999) used three periods were used in the calculation of average values of the annual STCI on the Green River. The first two are sub-divisions of the period prior to storage in Flaming Gorge reservoir and the third is the period following storage. Thompson (1984) showed by double-mass curve analysis that a change in sediment yield occurred in the Green River basin about 1944; this is similar to the beginning of floodplain storage in the Paria River (Graf et al, 1991) and to the change in precipitation postulated by Hydrology Days 2003
126
Sediment Transport Capacity in the Colorado Plateau Hereford et al. These observations suggests there was may have a change in climate in the Colorado Plateau area in the early 1940's.
Table 6. The average Sediment Transport Capacity Index in each of the four rivers based on the streamflow record available for the three wet and dry periods from Hereford, et al (2002).
Period * pre-1942 1942-1977 1977-1998
Sediment Transport Capacity Index Little Paria Rio Puerco Sevier Colorado 307 -----971 3550 117 254 555 1839 115 139 904 2148
*The pre-1942 period of record used in the analysis was 1924-1941 for the Paria River, 1915-41 for the Sevier River, and 1930-41 for the Little Colorado River. There was too little data to define an average STCI for the Rio Puerco in the pre-1942 period. The Green River analysis (Milhous, 1999) showed a change in the 192329 period where the STCI, on average, was much less that for the 23 previous years. There may have been climate change in the Rocky Mountains to the north and east of the Colorado Plateau because the Green River receives most of its water from this mountain area. The STCI time series for the Sevier River can be used obtain some idea of possible changes in the Colorado Plateau. The data for 1915-1923 compared to 1924-1941 in Table 4 clearly show there may have been a change in 1923 in the parts of the Colorado Plateau. The period of record for the other three rivers is not long enough to determine of there was a similar change in these rivers. The Green River paper showed that a change in climate occurred in the 1923-29 period followed by a climate that, on average, had less ability to move sediment than the previous period. There were periods that had relatively high capacity to transport sediment (1947-52 and 1983-86). The last year used in the paper was 1997. The STCI time series for the Sevier River does show an increase in the sediment transport capacity in the early 1980's period. There was also a small blip in the Paria River values. Taken as a whole, it is reasonably clear from Table 5 and the various individual STCI time series that there was a change in the climate about 1941 as postulated by Hereford et al (2002). The Green River and Sevier analysis also show there is a high probability a change in the climate also occurred in 1923. The situation for the change in 1977 is not clear. There seem to be changes between the dry 1942-1977 and the wet 1978-1998 period but they are not relatively the same in each of the four basins. The Sevier River had the expected pattern because the STCI increased to just about the pre-1942 values. The STCI for the Little Colorado River did increased but not nearly as
Hydrology Days 2003
127
Milhous
much as was expected based on the change in precipitation. The STCI for the Paria River essentially did not change. The real difference between change expected based on the change in precipitation was the change in the Rio Puerco. Both the STCI and annual discharge of the Rio Puerco decreased between the 1942-1997 period and the 1978-1998 period. It could be argued that the variation in the changes among the other three rivers was a regional variation in the response of the streams to changes in precipitation. The decrease in both annual discharge and the STCI is significantly different from the change in the other three rivers. This change is worth investigating. Possible causes range from changes in upland vegetation, floodplain vegetation, the pattern of rainfall, and many others. It is too soon to speculated as to the reason; hence the 'preliminary' in the title of this paper.
5.
Limitations
The impacts of changes in water use have not been included in the time series analysis. This is probably most important in regards to the analysis of the Little Colorado River. This paper is provisional and many of the conclusions may change with further investigation.
6.
References
Gellis, Allen, R. Hereford, S.A. Schumm, and B.R. Hayes. 1991. Channel evolution and hydrologic variations in the Colorado River Basin: factors influencing sediment and salt loads. Journal of Hydrology. v.124. pp 317-344. Graf, J.B., R.H. Webb, and R. Hereford. 1991. Relation of Sediment Load and Flood-plain Formation to Climatic Variability, Paria River Drainage Basin, Utah and Arizona. Geological Society of America Bulletin. v.103, p1405-1415. Hereford, R., R.H. Webb, and S. Graham. 2002. Precipitation History of the Colorado Plateau Region, 1900-2000. USGS Fact Sheet 119-02. Milhous, R.T. 1992. Water and sediment in the middle Rio Grande Valley, New Mexico: use of a sediment transport capacity index. in H.J. Morel-Seytoux, editor. Proceedings: 1992 Front Range Hydrology Days. pp 67-80. Milhous, R.T. 1997. Sediment yields from three western American rivers and their ecosystem impacts. in Matjaz Mikos, editor. LOC Proceedings of Oral Presentations, FRIEND'97, Postjona, Slovenia. Acta hydrotechnica 15/18 (1997). University of Ljubljana. Ljubljana, Slovenia. Milhous, R.T. 1999. Sediment transport capacity: Green River case study. in H.J. MorelSeytoux, editor. Proceedings of the Nineteenth Annual American Geophysical Union Hydrology Days. Hydrology Days Publications. Atherton, CA. pp 273-282. Thompson, K.R. 1984. Annual Suspended-Sediment Loads in the Green River at Green River, Utah. Water-resources Investigation Report 84-416. U.S. Geological Survey. Salt Lake City, Utah. p 17.
Hydrology Days 2003
128