PREDICTION OF TEAK BONITA (SITE INDEX) IN CENTRAL JAVA, INDONESIA, BASED ON SOIL PROPERTIES Chairil Anwar1 ABSTRACT The objective of this study was to determine the most correlated soil and physiographic factor with the site index of teak. Tree height and stand age were recorded from seventy-three plots located in Central Java, Indonesia, to determine site index. Size of each plot was 0.1 ha. Measured site properties measured were percent slope, elevation, slope position, slope length, dominant topographic form, aspect, and thickness of A horizon. Soil samples from A and B horizon were analyzed for soil color, soil texture, available phosphorous, total nitrogen, and organic matter content. Analysis indicated that the site index of teak was positively correlated with thickness of A horizon and westerly aspects, and negatively correlated with clay content of A horizon and elevation. A multiple regression using these variables produced an R2 of 0.55. Keywords: Teak, bonita, site index, Indonesia, Java, silviculture
I.
INTRODUCTION
Estimation of site index (“bonita” or site quality of teak in Java) based on tree height and age often has limitations such as difficulties in determining exact age of measuring dominant tree height accurately (Spur, 1952; Davis, 1966). It is also impossible to collect these data where no trees are present. This kind of situation exists for teak (Tectona grandis L.f.) in Indonesia. Its productivity cannot be adequately predicted based on previous site situation of natural teak forest nor from the area of barren lands that might be suitable for teak plantations. It is desirable, therefore, to use soil/site properties of land suitable for teak plantation to evaluate their potential productivity. The site quality class of teak called “bonita” is based on a growth and yield table for Java teak plantations which was prepared by Von Wulfing (1932). In this table he divided site into six site classes. While bonita is also determined through upper height and age indicated by Roman numerals, site index is upper height base age indicated by numerals. An extract of the teak bonita curves are provided in Figure 1, respectively. Teak is one of the most important commercial timber species in Indonesia due to its decorative and mechanical properties. In Indonesia, especially in Java, teak is planted primarily by Perum Perhutani, the State Forest Company. The silvicultural system applied is clear-cutting followed by artificial regeneration with a rotation of 60 to 80 years (Direktorat Jenderal Kehutanan [Indonesian Ministry of Agriculture, Directorate General of Forestry], 1976). While almost one of three million hectares of plantation forest in Indonesia is teak plantations, it is projected that an additional three million hectares of plantations will be established on 21 watershed areas (based on forest and land rehabilitation 1
Forest and Nature Conservation Research and Development Center, Bogor
9
Journal of Forestry Research Vol. 4 No. 1, March 2007: 9 - 18
need between the year 2003 and 2007, Ministry of Forestry, 2003). It is reported that teak plantations in Java is about 604.000 ha (Sadardjo, 1999). Teak is a promising species for further development in Indonesia; however, the information of site quality classes is limited, especially on new locations.
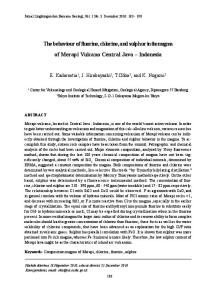
Figure 1. The bonita site classes from Von Wulfing (1932). The teak site index curves base age 80 are presented with the corresponding bonita site classes. Site index values, base age 80, are listed above each curve Previous investigators have found that soil and physiographic properties are significantly correlated to site index. Carmean (1954) found that soil depth, gravel content, compaction, precipitation, and elevation are related to the site index of Douglas-fir (Pseudotsuga menziesii [Mirb.] Franco) in the northwestern USA. Klinka and Carter (1990) using the same species found that soil moisture regimes and soil nutrient regimes were strongly correlated with site index. Doolittle (1957) working with scarlet oak (Quercus coccinea Muenchh.) and black oaks (Q. velutina Lam.) in the southeastern USA found that soil depth and textures are correlated to the site index. Zahner (1958) found that soil textures are correlated to the site index of loblolly pine (Pinus taeda L.) and shortleaf pine (P. echinata Mill.) in the southern USA. Steinbrenner (1976) working with western hemlock (Tsuga heterrophylla [Rafn.] Sarg.) found that site index can be predicted by using depth of A horizon, silt and clay content, elevation, and slope position. Site index of singleleaf pinyon (Pinus monophylla Torr. and Frem.) and Utah juniper (Juniperus osteosperma (Torr.) Little) in Nevada can also be estimated by using soil depth, slope gradient, and aspect (Meeuwig and Cooper, 1981). In Indonesia, Purnama (1977) found that the depth of A horizon significantly related to the height of rasamala (Altingia excelsa Noronhae). He also reported no relationship between site index and total N and C, available K and Ca, or soil acidity. Nurkin (1989) also found that teak site index (base age 40) significantly related to the soil depth, bulk density and available K. 10
Prediction of teak bonita ...... C. Anwar
The objectives of this study were: (1) to determine the site most correlated factors with the site index of teak, and (2) to find the best predictive model for the site index of teak based on soil and physiographic factors for estimating of teak bonita classes. II. METHODS Study Sites The study was conducted in teak plantations covering two forest districts, i.e. Pati and Cepu, in Java Island, Indonesia (Figure 2). More than 50% of the forest areas in these regions are occupied by teak plantations. The climate of these areas is largely controlled by the monsoon (Sukamto, 1969; Oldeman, 1975). The average annual rainfall is between 1,900 mm to 3,380 mm, which falls during a 7 - to 9 - month-wet season, and is followed by 0 a dry season (Schmidt and Ferguson, 1952). The average daily temperature is between 32 C 0 (maximum) and 22 C (minimum). Grumusols, Latosols, Mediterranean, and Alluvial are the soil Great Groups supporting these teak lands (Supraptohardjo et al., 1966); these Great Groups are equivalent to Vertisols, Oxisols, Alfisols, and Entisols, respectively, in modern Soil Taxonomy (Soil Survey Staff, 1990; Buol et al., 1995). Data Collection A total of seventy-three of 0.1 ha circular-plots were established in four site classes: SI80 21-26 m, SI80 27-32 m, SI80 33-38 m, and SI80 39-44 m, and in three age classes: 20-39 yr, 40-55 yr, and > 56 yr. For site index determination, height from ten dominant trees per plot was measured to the nearest 0.1 m, and stand age was obtained from the forest inventory unit record. Measured physiographic factors were: percent slope; position of slope indexed between 1 (upper) and 5 (lower); slope length indexed as 1 ( < 25 m), 2 (25-75 m), and 3 (> 75 m); dominant topographic form indexed as 1 (upland), 2 (medium-upper), 3 (low-upper), 4 (terrace), 5 (bottomland); elevation (in m); and aspect and major aspect (in degrees azimuth). The data on aspect and major aspect were divided into eight segments of 450 of each and indexed as 1 (E [e.g., 67.50 to 112.50]), 2 (NE and SE), 3 (N and S), 4 (NW and SW), and 5 (W); this classification was based on preliminary analyses of simple correlations between site index and aspect. A soil pit in the center of each plot was excavated to a maximum depth of 1 m. Profile horizons were delineated and recorded for thickness of A horizon (± 0.001 m), and soil color of both A and B horizons determined with Munsell color charts. Soil samples for each plot were collected from both A and B horizons and analyzed for soil texture, total nitrogen, available phosphorous, and organic matter content
11
Journal of Forestry Research Vol. 4 No. 1, March 2007: 9 - 18
Key :
Φ ▲ _ Ө
: : : :
Teak plantation areas Plot locations Forest district boundaries Map reference point
Figure 2. Study site location map Statistical Analyses Site quality class curves by Von Wulfing (1932) are still used as a basic reference for predicting “bonita”, or site quality class, of teak in Java. Height-age relationships from this reference were used to develop site index estimation equations. The analyses was started by formulating Von Wulfing's tabular relationships between tree height and age using the following linear form of a standard height-age function: Ln HT = b0 + b1 æç
1 ö ÷ ………………………….. è AGE ø Where, HT = total tree height (m) AGE = total tree age (years) b0, b1 = regression coefficient 3
(1)
The slope coefficient (b1) for the regression was -3.180603 (the intercept coefficient varied by bonita). From equation (1), a site index function (base age 80) was derived into: æ
Ln SI(80) = Ln DOMHT + 3.180603 ç è
or, 12
3
1 AGE
3
1 ö ÷ ….. (2) 80 ø
Prediction of teak bonita ...... C. Anwar
æ
SI(80) = (DOMHT) e where :
3.180603
è
ç
3
1 AGE -
3
1 ö ÷ 80 ø
..…………….
(3)
SI(80) = site index of each base age 80 plot DOMHT = dominant tree height for each plot
Equation (3) was employed to estimate site index for each study plot. Plot site index was used as a dependent variable in multiple regression analyses (Steel and Torrie, 1980; Myers, 1986) with physiographic and soil variables as independent variables, III. RESULTS AND DISCUSSION Using a single-variable model, only four of the thirty independent variables were significantly (p < 0.05) correlated with site index. They were thickness of A horizon, percent slope, major topographical aspect, and clay content to the A horizon, (Table 1). Of these, thickness of the A horizon had the strongest correlation with site index (Figure 3). Numerous previous investigators found thickness of A horizon correlated with site index (Doollitle, 1957; Zahner, 1958; and Steinbrener, 1976). In contrast, Nurkin (1989), working with teak plantations in eastern Java, Indonesia, found that A horizon thickness was not significantly correlated to the site index of teak (r = + 0.07). He found that the depth to a restricting layer was the dominant variable affecting site index of teak (r = + 0.73). However, Nurkin used plots in relatively flat areas with percent slope varying from 0 to 4%, while in the present study, that plots varied from 0 to 18%. Data analysis of this study found that when plots with percent slope more than 4% were removed, thickness of A horizon was not significantly correlated to the site index of teak (R2 = 0.04; Prob. > F = 0.206). This refers that positive influence of A horizon thickness on site index interacts with the influence of topography and it has big effect on sloping sites rather than flat sites. Even though there was not a high correlation between site index and topsoil texture, clay content of A horizon correlated a significantly with site index (r = - 0.37, Table 1). Nurkin (1989) also reported the negative correlation between clay content in A horizon and the site index (r = - 0.30). This may be explained by a fact that clay soils are generally poorly drained and have poor aeration. Previous studies on teak plantations in Java indicated that soil with good aeration provided a better site for teak growth than those with poor aeration (Buemee – Nieuwland, 1922; Becking, 1928). The negative relationship between soil bulk density and site index (r = - 0.36) reported by Nurkin (1988) may further corroborate this point. The dependence of teak on deeply aerated soils (Perum Perhutani, 1974) is further supported by reports of low hypoxia tolerance on which teak can survive in a hypoxic environment for only ten days (Sukotjo, 1977).
13
Journal of Forestry Research Vol. 4 No. 1, March 2007: 9 - 18
Table 1. Summary of environmental variables sampled from 73 teak stands and their simple linier correlations between each variable and site index (base age 80 yrs, m). Statistical significance of correlation is indicated as follows: *** p< 0.01, ** p< 0.05, * p< 0.15, no symbol indicates p>0.15.
Abbrevia tion
DOMHT AGE ATHICK LP MTP SLPST SLGHT ELEV ASP MASP HUEA HUEB CHRA CHRB VALA VALB ASAND ASILT ACLAY ASTCL BSAND BSILT BCLAY BSTCL AP BP AN BN AC BC
14
Variable
Dominant height (m) Stand age (years) A thickness (cm) Percent slope (%) Major topographic feature (1 to 5) Slope position (1 to 3) Slope length (1 to 3) Elevation (m) Aspect (1 to 5) Major aspect (1 to 5) Hue : A Horizon (2.5 to 10) Hue : B Horizon (2.5 to 10) Chroma : A Horizon (0 to 8) Chroma : B Horizon (0 to 8) Value : A Horizon (0 to 10) Value : B Horizon (0 to 10) Sand content : A Horizon (%) Silt content : A Horizon (%) Clay content : A Horizon (%) Silt + Clay content : A Horizon (%) Sand content : B Horizon (%) Silt content : B Horizon (%) Clay content : B Horizon (%) Silt + Clay content : B Horizon (%) Available Phosphorous : A Horizon (ppm) Available Phosphorous : B Horizon (ppm) Total Nitrogen : A Horizon (%) Total Nitrogen : B Horizon (%) Organic matter content : A Horizon (%) Organic matter content : B Horizon (%)
Min
Max
17.6 23 3.4 1.0 4 4 2 0 1 1 2.5 2.5 0 1 2 2.5 21.8 9.9 8.6 20.6 3.4 7.8 6.2 14.0 6.4 6.0 0.11 0.08 0.12 0.19
41.9 81 33.2 17.4 5 5 30.4 162 5 5 10 10 6 6 4 5 79.4 51.4 60.4 78.2 86.0 52.1 78.9 96.6 65.2 60.4 0.46 0.33 7.62 4.99
Correlation Coefficient
----0.65*** - 0.35*** 0.31*** 0.10 0.07 - 0.20* 0.06 0.22* 0.20* 0.04 0.05 - 0.09 - 0.10 - 0.17 0.22* 0.16 - 0.37*** - 0.22* 0.03 0.16 - 0.13 - 0.03 - 0.06 0.05 0.09 0.20* 0.10 0.20
Prediction of teak bonita ...... C. Anwar
Figure 3. Relationship between thickness of A horizon (cm) and site index of teak. The line was fit to the data with the following linier regression equation: SI (80) = 23.65 + 0.61 ATHICK; R2 = 0.427 The multiple regression analysis supported the independent importance of thickness and clay content of the A horizon. However, there were two variables significantly correlated with site index: percent slope and major topographical feature (Table 1). They were also correlated with A thickness (SLP VS ATHICK r = - 0.43; MTP VS ATHICK r = 0.43) and hence, they were included in the multiple regression analysis. Two independent methods of variable selection employed in this study (best subset and stepwise regression using only those variables with significant simple correlations) resulted the same variables: A horizon thickness, clay content of the A horizon, major topographical aspect, and elevation. It showed also that nearly 60% of variation in site index were explained by these variables (Table 2). Table 2. Multiple regression analysis of site index (base age 80 yrs, m) and independent environmental variables of A horizon thickness (ATHICK, cm), clay content of A horizon (ACLAY, %), major aspect (coded from 1(0)5, 5 = due west), and elevation (ELEV, m). Statistics as per Steel and Torrie (1980). Variables
Regression Coefficient
Intercept ATHICK ACLAY MASP ELEV R2 Root MSE
= =
27.945 0.515 - 0.156 0.844 - 0.018 0.554 3.642
Standard Error
Prob.>T
2.491 0.079 0.045 0.337 0.010
< 0.001 0.001 0.001 0.015 0.057
15
Journal of Forestry Research Vol. 4 No. 1, March 2007: 9 - 18
The significance correlations between thickness of A horizon and clay content, and site index have been described above, and the negative correlation between site index and elevation may be explained by orographic factor such as decreasing temperature or excessive precipitation with increasing elevation. However, correlation between major aspect and site index revealed an unusual pattern. Although the simple correlation was small (r = 0.22), there was a tendency for eastern aspects to have a negative rather than a positive influence on site index (cf. Carmean, 1967). This interpretation is the result of selecting the strongest continuous influence of major aspect on site index (see Methods). When azimuth classes were grouped without reference to a continuous change in compass direction (data are not presented), it was found that the highest site indices were found in stands with either westfacing or northeast-facing major aspects. It would appear that positive microclimatic effect of northeastern aspects has some effect on site index in the present study, but there is some positive influence associated with a west-facing slope. This may be due to the position of Java Island and the prevailing westerly winds. Western aspects may receive more moisture than eastern aspects. This is supported by the fact that the eastern part of Java Island has more pronounced dry season than the western part (Sukamto, 1969; Oldeman, 1975). As shown in the results of soil analyses (Table 1), there were large differences in nutrient content among teak stands. However, correlations between nutrient contents and site index were weak and none of the variables were included after multiple regression analyses. Only total nitrogen of the B horizon showed a significant correlation to site index (r = + 0.20). Nurkin (1988) also reported that organic matter content, available phosphorous, total nitrogen, potassium, and magnesium were not related to the site index of teak. He found that calcium content was the only soil nutrient having a significant but negative correlation to site index (r = - 0.34). The lack of response of site index to soil chemical variables indicates that availability of these nutrients did not strongly limit the growth of teak. Historical literature supports this conclusion: Buemee-Nieuwland (1922) reported that site quality classes of teak on Java Island were more determined by soil physical properties than by chemical properties. In summary, site index of teak was found to be positively correlated with thickness of the A horizon and negatively correlated with clay content of the A horizon. These two variables accounted for nearly 50% of the variation observed in site index. The other variables found to have an additional and independent influence on site index revealed subtle but important influences of elevation and aspect. The model provides means of assessing potential teak productivity using only soil and environmental variables. All needed variables can be easily measured. Thickness of A horizon, major aspect, and elevation are very easily measured in the field, and clay content needs only a routine laboratory analysis for its determination. The weaknesses of the model are that it leaves 40% of the variation in teak site index unexplained and it can only be applied to Java, Indonesia. Despite the geographic limitations of model application, it may provide a useful starting point for site quality evaluation for teak in other parts of the world.
16
Prediction of teak bonita ...... C. Anwar
IV. CONCLUSIONS The best soil-site model developed revealed thickness of A horizon, clay content, major aspect and elevation as the major site properties closely related to the site index of teak in Java. This model can be developed for estimating the teak bonita classes, especially on new location. Regarding the practical value of the model in site prediction, the strength of the model is in the ease with which the variables can be measured. The weakness of the model is that the model obtained still needs validation before it is applied in the field. REFERENCES Becking, J. H. 1982. De djaticultuur op Java. Korte Med. Bosch., No. 22., Buitenzorg, Java, 38 pp. Beumee-Nieuwland, N. 1922. Onderzoekingen and djatiboschgroden op Java. Korte Med. Bosch., No. 8 Buitenzorg, Java, 23 pp. rd
Buol. S.W., F.D. Hole, and R.J. McCracken. 1995. Soil Genesis and Classification. 3 Edition. Iowa State University Press, Ames. 446 pp.
Carmean, W. H. 1954. Site quality for douglas-fir in southwestern Washington and its relationships to precipitation, elevation, and physical soil properties. Soil Science Society America Proceedings 18:330-334. Carmean, W. H. 1967. Soil survey refinements for predicting black oak site quality in southeastern Ohio. Soil Science Society America Proceedings 31: 805-810. nd
Davis, K. P. 1966. Forest Management: Regulation and Valuation, 2 Edition. McGraw-Hill Book Company, New York. 519 pp. Direktorat Jenderal Kehutanan. 1979. Vademicum Kehutanan Indonesia. Depertemen Pertanian, Jakarta. 226 pp. Doolittle, W. T. 1957. Site index of scarlet and black oaks in relation to southern Appalachian soil and topography. Forest Science 3 : 144-124. Klinka, K. and R. E. Carter. 1990. Relationships between site index and synoptic environmental factors in immature coastal douglas-fir stands. Forest Science 36: 815-830. Meeuwig, R. O. and S. V. Cooper. 1981. Site quality and growth of pinyon-juniper stands in Nevada. Forest Science 27: 593-601. Ministry of Forestry. 2003. Gerakan Nasional Rehabilitasi Hutan dan Lahan di 21 DAS Prioritas Tahun 2003. Departemen Kehutanan, Jakarta. 55 pp.
17
Journal of Forestry Research Vol. 4 No. 1, March 2007: 9 - 18
Myers, R. H. 1986. Classical and Modern Regressions with Applications. 2nd Edition. The Duxbury Advanced Series in Statistics and Decision Sciences, PWS-KENT Publishing Company, Boston. 359 pp. Nurkin, B. 1989. Soil factors related to teak plantation site quality in the Madiun forest region of eastern Java, Indonesia. PhD Dissertation, University of Idaho. 102 pp. Oldeman, L. R. 1975. An Agroclimate Map of Java. Central Research Institute for Agriculture, Bogor, Indonesia. 22 pp. Perum Perhutani. 1974. Pedoman Pembuatan Tanaman Jati, LHT. 8: Seri Produksi 7. Jakarta. 24 pp. Purnama. B. M. 1977. Hubungan bonita dengan sifat tanah hutan rasamala (Altingia exelca Noronhae) di KPH Bandung Selatan. Unpublished Thesis, Institut Pertanian Bogor, Indonesia. 52 pp Sadhardjo, S. 1999. Teak plantation productivity in Indonesia. Unpublished. Regional Seminar on Site Technology and Productivity of Teak Plantations, Chiang Mai, Thailand. Schmidt, F. H. and J. H. A. Ferguson. 1951. Rainfall types based on wet and dry period ratios for Indonesia with western New Guinee, Verhandelingen, No. 42. Kementrian Perhubungan, Jakarta. 74 pp. Soepraptohardjo, M., Suwardjo, and R. Dudal. 1966. Peta Tanah Tinjau Propinsi Jawa Tengah. Lembaga Penelitian Tanah, Bogor, Indonesia. Soil Survey Staff. 1960. Soil Classification: A Comprehensive System, 7th Approximation. USDA. 265 pp. Spurr, S. H. 1952. Forest Inventory. The Ronald Press Company, New York. 571 pp. Steel, R. G. H. and J. H. Torrie. 1980. Principles and Procedures of Statistics: A Biometrical Approach. 2nd Edition McGraw-Hill Publishing Company, N. Y. 633 pp. Steinbrenner, E. C. 1976. Factors that influence the productivity of western hemlock. Proceedings XVI IUFRO World Congress, Norway. Divisio 1: 167-185. Sukamto, M. 1969. Climate in Indonesia. In: H. Arakawa (Editor). World Survey of Climatology. Vol. 8:215-229. Elsevier Publishing Company, Amsterdam. Sukotjo, W. 1977. Silvika. Unpublished, Institut Pertanian Bogor, Bogor. 73 pp. Von Wulfing, H. E. W. 1932. Opstandstafels voor djatiplantsoenen (Tectona grandis L.f.) bewerkt naar gelijknamige tafels van 1932. Korte Mededeelingen van het Bocschbouwproefstation, No. 63, Buitenzorg, Java. 19 pp. Zahner, R. 1958. Site quality relationships of pine forest in southern Arkansas and northern Louisiana. Forest Science 8: 162-176. 18