© 2002 Oxford University Press
Nucleic Acids Research, 2002, Vol. 30, No. 2
419–428
Polyamine–nucleic acid interactions and the effects on structure in oriented DNA fibers Lorens van Dam, Nikolay Korolev and Lars Nordenskiöld* Physical Chemistry, Arrhenius Laboratory, Stockholm University, S-106 91 Stockholm, Sweden Received as resubmission October 18, 2001; Revised and Accepted November 19, 2001
ABSTRACT Fibrous oriented calf thymus DNA containing the natural polyamines spermidine (Spd) and putrescine (Put), and the degradation polyamines cadaverine (Cad) and 1,3-diaminopropane (DAP), have been investigated at different water contents using nuclear magnetic resonance (NMR) methods, fiber X-ray diffraction and gravimetric measurements. When judged by X-ray only the DAP and Spd samples seem to undergo a B–A-form transition at reduced water activity. Solid-state two-dimensional rotorsynchronized magic angle spinning (2D-syncMAS) 31P-NMR, however, shows the A-form to be present also in the Put sample, and it appears that the separation between the amine units of diamines is correlated with the amount of A-form present. In addition, the solid-state NMR data show the polyamine-bound DNA samples to have a significant deviation from the ordinary B-form DNA structure, displaying similar amounts of BI and BII nucleotide conformations. The low water content of the samples suggest that the polyamines themselves act as hydrators of DNA. Water 2H-NMR results are in agreement with this observation. The quadrupolar splittings of the polyamine 2H signals for samples at low water content indicate some preferential spatial orientations of the polyamines in the ordered DNA environment. The polyamines show relatively fast macroscopic diffusion as detected by NMR self-diffusion measurements. INTRODUCTION Polyamines are present in high (mM) concentration in virtually all cells and are essential for the normal progression of cell cycles (1–3). The composition of polyamines varies between organisms, with spermine (Spn) (N,N′-bis[3-aminopropyl]1,4-diaminobutane), spermidine (Spd) (N-[3-aminopropyl]1,4-diaminobutane) and putrescine (Put) (1,4-diaminobutane) being abundant in mammals (1) and therefore henceforth collectively termed ‘natural polyamines’. Polyamines have been shown to have an important role in cell division and their amount increases dramatically under conditions of high cell division as e.g. tumor growth, cystic fibrosis and pregnancy (4). Polyamines have also been seen both to enhance and to
repress enzyme activity, and in particular to activate the κB nuclear transcription factor (5). Ornithine decarboxylase, which in mammals is the sole enzyme that produces Put—precursor of the higher polyamines—has one of the highest turnover rates known (6), suggesting the importance of a rapid response of polyamine levels in the living cell. The precise molecular role of the polyamines is, despite numerous studies, not clearly understood. The polyamines have been seen to interact with a variety of cellular components and may have multiple functions in the cell (1). As the polyamines carry multiple positive charges in vivo due to protonation of the amine groups, they will interact with the negatively charged polynucleic acids and it has been estimated that a large amount of the polyamines present in the cell are associated to DNA or RNA (7). Polyamines have been shown to induce DNA condensation and to stabilize compact forms of DNA (8–10). In biological systems, DNA often occurs in compact forms, e.g. in chromatin of eukaryotes and in sperm and phage heads, and thus it is possible that polyamines are largely responsible for the stabilization of these compact DNA phases. Several studies have shown the association of polyamines to DNA to be non-specific and primarily electrostatic in origin and, as a result, can be described by polyelectrolyte theory (11–13). Experiments have so far shown that the polyamine binding to DNA exhibits no, or possibly very weak, base sequence dependence (14,15) and it is believed that the primary targets for polyamine binding are the charged DNA phosphates (15). It has been shown that polyamines are able to induce secondary structural transitions of DNA with the B–Z transition of alternating purine/pyrimidine oligonucleotides in solution being particularly enhanced by polyamines (11,12,16,17). Of the diamines, 1,3-diaminopropane (DAP) and diaminoethane are similarly effective in this B–Z conversion, both being slightly more effective than Put and more effective than cadaverine (Cad) (16). Also, the B–A transition is facilitated by the presence of polyamines under conditions of low water activity (18) and possibly the C-form can be stabilized by Spn (19). Polyamine binding constants and mobility show dependence on the nucleic acid secondary structure (7,13). This effect cannot be accounted for by changes in the DNA polyelectrolyte nature alone, indicating some specificity in the polyamine binding to DNA. It was observed in 1964 that the distance between the charged entities of the natural polyamines correspond well to the distances between phosphate groups in DNA (20). Suggestions on the structure of polyamine–DNA complexes have been made
*To whom correspondence should be addressed. Tel: +46 816 2375; Fax: +46 815 2187; Email:
[email protected]
420
Nucleic Acids Research, 2002, Vol. 30, No. 2
on the basis of this observation and additional experiments on fibrous DNA (19–21). High concentrations of Spn are often used in the solution from which oligonucleotides are crystallized for X-ray analysis (22). Interestingly, the polyamine is rarely found in the X-ray studies of the B-form DNA crystal structures, with the exemption of the first successful crystallization of the B-form DNA (23) [the self-complementary Drew–Dickerson dodecamer d(GCGCAATTCGCG)2] and the hexamer d(CGGTGG)·d(GCCACC) (24). In neither of these cases have the models of the B-form DNA–polyamine complex been confirmed. A recent molecular dynamics simulation from this laboratory has shown that Spn is not regularly distributed at any particular binding sites in B-form DNA, which could explain the ‘disappearance’ of it in B-form DNA crystals analyzed by X-ray diffraction (25). In A-form DNA crystals, however, polyamines have been more frequently found and have been seen to occupy various places in the lattice (26). Spn has also been located in Z-form oligonucleotide crystals on several occasions (27–29). Recently, two Raman studies on the structure and structural specificity of the interaction of polyamines with genomic DNA have been published. The first of these demonstrated that Spn and Spd bind primarily to the DNA phosphates and that they exhibit no major effect on B-form DNA structure (15). This is in contrast to a recent nuclear magnetic resonance (NMR) and circular dichroism (CD) study that suggests that Spn can promote the B–A transition in oligonucleotide solutions (30). The second Raman study observed different binding modes for Put, Spd and Spn on DNA, with amine group contacts not only to DNA phosphates, but also to the DNA bases, suggesting that Put and Spd bind in the DNA minor groove, while Spn binds in the major groove (31). A recent simulated annealing study suggests that Spn, Spd, Cad and Put should all stabilize the DNA A-form, in contrast to experimental data (32). Furthermore, it was seen that the diamines preferred backbone binding, while the tri- and tetra-amines occupied more varied binding sites. In yet another study (33), a combination of molecular modeling and radiochemical methods have been used to show that preferential Spn binding in the region of the B-form DNA minor groove explains an observed increase in DNA radiolytic stability in the presence of Spn. In the present study, we focus on the effect of polyamines on the hydration and secondary structure of oriented salmon testes DNA fibers, and on the mobility of the polyamines, using different NMR methods, X-ray fiber diffraction and gravimetric measurements. We have used the solid-state two-dimensional rotor-synchronized magic angle spinning (2D-syncMAS) 31P-NMR method, which is new to the study of polyamine–DNA interactions and gives information complementary to previous work obtained with other methods. In particular, we show that with this method it is possible to quantitatively detect the simultaneous presence of A- and B-form DNA. We investigate the natural polyamines spermidine (Spd3+) and putrescine (Put2+), the polyamine degradation product 1,3-diaminopropane (DAP2+), and the lysine degradation product cadaverine (1,5-diaminopentane; Cad2+). The chemical structures of these four polyamines are shown in Figure 1. Although similar in structure, these polyamines show distinct differences in their behavior with, and impact on, the properties of ordered DNA.
Figure 1. The polyamines used in this investigation. From top to bottom: 1,3-diaminopropane (DAP2+), putrescine (Put2+), cadaverine (Cad2+) and spermidine (Spd3+).
MATERIALS AND METHODS Chemicals Highly polymeric salmon testes DNA was purchased from Fluka and used without further purification. Polyamine hydrochlorides were purchased from Sigma-Aldrich (Sweden) and used without further purification. Polyamine purity was checked using 1H-NMR spectra. Fully N-methylated Put iodide, Me6PutI2, was synthesized from Put free base (Sigma-Aldrich) using the method of Sommer et al. (34) and re-crystalized from water/methanol. Purity was checked by 1H-NMR. Control of the humidity In order to control the water content in the DNA systems we have made use of the fact that saturated solutions of different inorganic salts give rise to different vapor pressures of water, and thus different relative humidities (RH). Saturated solutions of the salts KCl (85% RH) and Na2SO3 (95% RH) (35,36) were prepared and put in desiccators where the DNA samples were equilibrated. In the preparation of DNA samples for the X-ray and solid-state NMR measurements, ordinary H2O was used as the solvent in the salt solutions. For the 2H measurements, 95% D2O was used. Preparation of the samples Highly oriented films of salmon testes Na-DNA were prepared using the wet-spinning method (37). The spun films were bathed in solutions containing 65% ethanol and with polyamine corresponding to 8 mM in charge concentration (i.e. 8 mM polyamine amine-groups): Spd3+, 2.7 mM; Put2+, 4.0 mM; DAP2+, 4.0 mM; Cad2+, 4.0 mM. The bathing solutions were changed three times during the course of 10 days. The bathing procedure did replace all sodium ions, as verified by atomic absorption measurements of sodium, which showed a [Na]/[P] ratio less than 0.05 ([P] designates DNA phosphate concentration, i.e. nucleotide concentration). This, together with the low polyamine concentrations used in the bathing procedure, implies that the amine/phosphate ratio is close to 1 in all samples. After bathing, the films were dried and equilibrated at 75% RH for several weeks over saturated NaCl (35,36). A piece of each of the DNA films was cut off and used for X-ray measurements. The rest of the films were folded into cubes of approximate dimensions 6 × 5 × 4 mm for NMR diffusion measurements and 2.5 × 2.5 × 12 mm for solid-state NMR measurements,
Nucleic Acids Research, 2002, Vol. 30, No. 2
with the fibers of all layers parallel to each other. These samples were then equilibrated for extended time at the relevant RH (85 or 95% RH) before measurement. Two sets of samples were used, one for diffusion and one for solid-state NMR. The samples were wrapped in foil (Freshcling) to retain humidity while performing the NMR measurements. Both sets of samples produced the same X-ray patterns and water contents for a given polyamine and RH. X-ray diffraction X-ray diffraction pictures were taken using Cu Kα rays (1.542 Å wavelength). The sample was kept in an atmosphere of the right humidity throughout the exposure time, which was typically 4 h. The specimen-to-film distance was 50 mm. Measurement of the water content Three pieces of the polyamine samples used for the NMR and X-ray measurements, and a Na-DNA reference sample, were taken out and weighed after equilibration at a certain RH, 85 or 95%. Subsequently, they were dried over phosphorous anhydride. The samples were taken out and weighed several times during the drying, and it was seen that the weight of the samples reached constant values after ∼10 days. The difference in weight between the humidified and the dried samples was translated to water content Γ (water molecules per nucleotide). All samples were simultaneously prepared and measured in this way in order to minimize varying environmental effects. The error in these measurements is estimated to be around ±10%, based on repeated measurements (the water content at this high level of RH is sensitive to temperature effects on the vapor pressure of water above the salt solution; 38). We assumed full charge-neutralization of DNA by the polyamine in the calculations. NMR experiments 2H
spectra and the two-state model. 2H-NMR spectra were acquired using a single 90° pulse. A Varian Infinity spectrometer system equipped with a 4.7 Tesla superconducting magnet was used, with a standard Bruker high-power probe. Deuterium (2H) is a quadrupolar nucleus with spin quantum number 1. This means that in an anisotropic environment, the NMR spectrum of 2H will consist of two peaks, separated by a quadrupolar splitting, ∆v. In the present case of oriented DNA fibers, it is convenient to cast the expression for the quadrupolar splitting in the following form (39): 3 ∆v = --- χ S(3cos β DL – 1) 4
1
Here χ = e2qQ/h is the quadrupolar coupling constant (in Hz), with eq the largest component of the electric field-gradient tensor and eQ the quadrupole moment of the nucleus. The angle βDL specifies the relative orientation of the fiber director frame relative to the laboratory frame L defined by the static magnetic field. The order parameter (the residual quadrupolar anisotropy) S, is a measure of the effective degree of anisotropy experienced by the 2H nucleus in the system. For 2H in water, the electric field-gradient tensor is not axially symmetric (a non-zero value of the asymmetry parameter η). The general expression for the order parameter is then rather involved. In the present work we only consider the quadrupolar splittings in a qualitative sense and, therefore, it suffices to note that the
421
value of S is confined to the range –1 to 1, with the value 0 for an average over isotropic motion. A common model applied to interpret water and ion binding to DNA is the two-state model (40). In this model a molecular species can exchange between a bound state and a free state. The bound state gives rise to a quadrupolar splitting ∆vb, and the free state gives zero quadrupolar splitting due to fast isotropic motional averaging, ∆vf = 0. For fast exchange (if the residence time in the bound state is much less than 1/∆vb) averaging will occur, and the resulting quadrupolar splitting is: ∆vobs = p b∆v b
2
where pb is the (molar) fraction of species in the bound state. It may be noted that in the present systems, where the water content is generally low, a major part of water molecules may be considered as residing in an anisotropic environment with pb thus being close to 1. It should also be pointed out that the definition of one bound site is operational and in reality the quadrupolar splitting may be the average of different binding environments sampled during the motion of the molecule around the DNA helix axis. The quadrupolar coupling constant and order parameter may then be considered as average values over the different binding sites. In this presentation we will discuss the trends in the observed 2H quadrupolar splittings on a qualitative basis. Solid-state 2D-syncMAS experiments The 2D-syncMAS experiment (41) is able to extract the preferential orientations of phosphate groups with respect to the DNA helix axis in oriented fibers (42–44). The principle behind this is the orientation dependence of the chemical shift anisotropy (CSA) tensor of the 31P atom. The pulse-sequence is a simple cross-polarization from 1H to 31P, followed by acquisition of the 31P signal under 1H decoupling, with the start of the sequence synchronized with the rotor spinning and stepped in 16 steps (embracing one rotor period), in this way giving a 2D-experiment. The method and data analysis have been described in detail elsewhere (43–46). A standard 6 mm Varian Apex II MAS probe was employed for the measurements with a Varian Infinity spectrometer system operating at 4.7 Tesla. The director of the DNA fibers, which is the mean orientation of the helix axes of the DNA molecules in the fibers, was mounted to be perpendicular to the MAS axis, and the MAS speed was 2000 ± 1 Hz. The samples were wrapped in polyethene foil to retain humidity, and the remaining space between sample and rotor walls was filled with Al2O3 powder for fixation of the sample position and mechanical stability while spinning. The analysis of the 2D-syncMAS data requires the 31P-CSA principal values to be known and, therefore, parts of the polyamine samples were fine-cut and used to extract the principal values of the 31P-CSA tensor. At 85% RH, the CSA, ωaniso = ÷ωzz – ωiso÷ and the asymmetry parameter η showed the values (ωaniso/2π; η ) = (7580; 0.70), (6940; 0.74), (7200; 0.72) and (7270; 0.72) for Spd–, Cad–, Put– and DAP–DNA, respectively. At 95% RH the values where somewhat lower, as expected from the higher water contents: (ωaniso/2π; η) = (6640; 0.72), (6080; 0.74), (5890; 0.74) and (6000; 0.73) for Spd–, Cad–, Put– and DAP–DNA, respectively. In the analysis of the 2D-syncMAS data from a particular sample, we used the corresponding CSA principal values, as just reported, for that sample.
422
Nucleic Acids Research, 2002, Vol. 30, No. 2
The estimated error, originating from differences in precise water content of the fibers due to laboratory temperature variations and from limited NMR signal-to-noise ratios, is ∼400 Hz in ωaniso; η and 0.02 in η, based on repeated measurements. NMR diffusion experiments NMR diffusion measurements on polyamine–DNA samples were performed on a Bruker DMX system equipped with a 4.7 Tesla superconducting magnet, using a Bruker 10 mm gradient probe (960 Gauss/cm). The resonance frequency of 1H was –200.13 MHz (see ref. 47 for the negative sign). Samples were placed in hydrogen-free KEL-F sample-holders and positioned into ordinary 10 mm NMR tubes. No field/frequency lock was used. The ambient temperature was ∼20°C. The diffusion data were acquired using the gradient-modified stimulated echo sequence. The diffusion experiments were performed by keeping ∆ (∼200 ms) and the gradient duration δ (1 ms) constant, while varying the gradient strength G (0.02–1.0 T/m). The 90° pulse duration was ∼10 µs. Data were fitted in a non-linear fashion to the single- (i = 1) or twocomponent (i = 1, 2) Stejskal–Tanner equation (48): A =
åA i
0 i
δ 2 2 2 exp – γ G δ æ ∆ – --- ö D i è 3ø
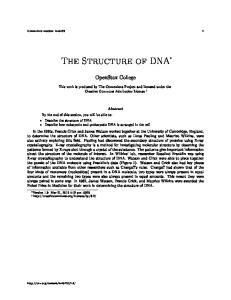
Figure 2. X-ray diffraction images of the polyamine-containing DNA samples at 95% (top row) and 85% RH (bottom row). From left to right: spermidine, cadaverine, putrescine and 1,3-diaminopropane.
3
Here G is the gradient strength, γ is the gyromagnetic ratio of the studied nucleus (26.752 × 10⁷ rad T–1s–1 for 1H), δ is the gradient duration, ∆ is the diffusion time and Di is the diffusion coefficient of the molecule i, which is to be extracted. As a result of overlapping spectral peaks, fitting of the extracted data was done in the following way. (i) Part of a polyamine peak, where the overlap with the water peak was as small as possible, was integrated and the data fitted to a singlecomponent Stejskal–Tanner decay: this gave, in general, good fits. (ii) The entire region of spectral intensity was integrated and fitted to a two-component (water + polyamine) Stejskal–Tanner decay. (iii) The diffusion coefficients of the polyamine extracted from the methods (i) and (ii) were compared and, if the values did not differ by >5%, were regarded as accurately measured. The reported diffusion coefficients in Table 2 for the polyamines and water was taken from method (ii). The diffusion coefficients of the polyamines in aqueous solution were acquired on a Varian CMX Infinity (Chemagnetics) system at a field of 4.7 Tesla. A custom-built 10 mm gradient probe (Cryomagnetics Systems) was used with a home-built gradientdriver system. The temperature was 25°C. The gradient strengths were calibrated against a 2.1 M LiCl solution at 25°C, for which D(Li) = 9.14 × 10⁻¹⁰ m2/s (49) and was found to be ∼0.4 T/m. The pulsed field-gradient spin-echo sequence (48) was used. RESULTS AND DISCUSSION The DNA conformation—X-ray versus NMR The X-ray diffraction patterns of the polyamine–DNA samples at 95 and 85% RH are displayed in Figure 2. At 95% RH, the X-ray pictures show DNA to be in amorphous B-form, regardless of the particular polyamine present. This is an expected result, as DNA is generally found to be in the B-form at high water activity with non-intercalating counterions (50). At lowered water activity, corresponding to 85% RH, the Cad and Put samples also show a disordered B-form X-ray pattern, whereas
Figure 3. Orientational distribution functions of 31P-CSA tensor orientations obtained from 31P 2D-syncMAS NMR measurements on oriented DNA fibers at 95% (top row) and 85% RH (bottom row). From left to right: spermidine, cadaverine, putrescine and 1,3-diaminopropane. αPD and βPD are the Euler angles relating the phosphorus CSA tensor to the DNA fiber director (for details see text and 44).
the X-ray patterns of the Spd and DAP samples are characteristic of DNA in the A-form. The B–A transition usually occurs in alkali ion and alkali metal ion salts of DNA fibers at reduced water activity, and is believed to be due to the formation of a network of water molecules in the A-form major groove, enabling phosphate groups to share water molecules in an efficient way (50,51). The exceptions to this general behavior are Li+ and Mg2+, which both are ions of high naked ion charge density. DNA with these two counterions undergoes a transition to the C-form, as water activity is lowered (50). Recently, van Dam and Levitt (44), using the 2D-syncMAS method, showed the C-form to consist of a mixture of BI and BII nucleotides (52). Analysis of the 2D-syncMAS measurements presents us with the Euler angles αPD and βPD, describing the relative orientation between the 31P-CSA tensor principal axis frame (P) and the DNA fiber director frame (D). This information can be directly translated to the Euler angles describing the relative orientation of the phosphate group relative to the DNA helix frame (43,44). However, in the present work it is not necessary to perform this analysis, as we limit our discussion to the conformational state of DNA in the system. The interested
Nucleic Acids Research, 2002, Vol. 30, No. 2
reader is referred to the previous publications from our laboratory (43,44). Figure 3 shows the result of analysis of the 2D-syncMAS measurements, displaying contour plots of the 31P-CSA principal axis frame orientations, relative to the DNA fiber director. The bright areas in these orientational distribution functions indicate orientations of high occupancy. At 95% RH, two highly populated orientations are found for all samples. One orientation is centered at (αPD; βPD) ≈ (0°; 60°) and one at (αPD; βPD) ≈ (0°; 20°). Previous investigations from this laboratory have consistently shown that when DNA is in the B- or C-form, the orientational distribution function for the Euler angles αPD and βPD displays two maxima at (αPD; βPD) ≈ (0°; 60°) and (αPD; βPD) ≈ (0°; 20°) (43,44). These maxima have been ascribed to representing the BI and BII nucleotide conformations, respectively (44). The BI conformation is the nucleotide conformation in the classical B-form of DNA, while the BII nucleotide conformation is a frequently found structural alteration in B-form DNA (52–55). It has recently been suggested by van Dam and Levitt (44) that the B- and C-forms of DNA in fibers are only distinguished by the ratio of BII/BI nucleotides, the C-form having a higher ratio than the B-form. The orientational distribution function of the polyamine–DNA systems at 95% RH is consistent with the X-ray diffraction results, also showing DNA to be in a B-like form at this high water content. At the lower water content, 85% RH, the Spd, Put and DAP samples show an additional peak in the orientational distribution function centered at (αPD; βPD) ≈ (70°; 75°). This particular orientation of the 31P-CSA is consistent with the occurrence of nucleotides in the A conformation, which is the conformation that makes up A-form DNA, as our previous studies have shown (43,44). For the Spd and DAP samples, both X-ray and NMR thus show the A-form of DNA to be present. It is of special interest that the NMR method is also able to show the occurrence of A-form DNA in the Put sample, which completely escapes detection in the X-ray method. Furthermore, the occurrence of B-form DNA in the Spd and DAP samples at 85% RH, as evidenced by NMR, also does not show up in the X-ray patterns. This is due to X-rays being biased by the need of high crystallinity and therefore favoring detection of the A-form of DNA. Integration of the peaks in the normalized orientational distribution functions in Figure 3 gives the relative amounts of the A, BI and BII nucleotide conformations present in the sample. The integration limits were chosen to be max min max {α min PD , α PD ; β PD , β PD } = {40°, 90°; 50°, 90°} for the A-type, {0°, 50°; 0°, 90°} for the BI-type and {0°, 80°; 0°, 45°} for the BII-type of nucleotide conformation, and the results are given in Table 1. This procedure shows that at 85% RH, the Spd–DNA and DAP–DNA samples have 51 and 56% of their DNA in the A-form, respectively. For the Put–DNA sample at 85% RH, where X-ray shows a diffuse B-form pattern, the amount of A-form is 27%, while for Cad–DNA the amount of A-form DNA is negligible (4%, which is within the error limit). It is also worth noting that the Spd and DAP samples that, as judged by X-ray, have DNA in the A-form, actually have ∼50% of their DNA in the B-like form. The amount of A-form DNA in the DAP and Put samples is thus not so dramatically different as X-ray indicates. The 2D-syncMAS method clearly shows that the B–A transition is not an all-or-nothing phenomenon at the sample level. The
423
Table 1. The percentage of A, BI and BII nucleotides and the BII/BI ratio in the polyamine–DNA samples at 85 and 95% RH from integration of the orientational distribution functions in Figure 3 85% RH
95% RH
%A
%BI
%BII
BII/BI
%A
%BI
%BII
BII/BI
Spd–DNA
51
27
20
0.74
0 (–5)
60
45
0.75
Cad–DNA
0 (4)
48
49
1.0
0 (4)
50
41
0.82
Put–DNA
27
38
37
1.0
0 (5)
47
39
0.83
DAP–DNA
56
24
24
1.0
0 (–1)
57
41
0.72
The error limit is ∼5%, and intensities below this number are set to zero but given in parenthesis.
presence of the highly crystalline A-form of DNA, as X-rays show for DAP–DNA and Spd–DNA, together with the solidstate NMR data, reveal that domains of A-form and B-like form DNA must exist in the samples. Another interesting feature from the above integration procedure is that in all samples the BII/BI ratio is high as compared with the typical B-form DNA fibers we have investigated previously using this method. Especially noticeable is the BII/BI ratio, in the range 0.74–1.0, for all polyamine–DNA samples at 85% RH. The value of 1.0 is the highest BII/BI ratio that we have observed in our investigations of this type thus far. The observation indicates a disruption of the ordinary B-form DNA, which has its nucleotides in the BI conformation, towards a C-form like conformation, where some nucleotides adopt the BII conformation, as shown in a recent publication from this laboratory (44). In that investigation, a BII/BI ratio of 0.9 was found for C-form Li-DNA, which is the commonly used ‘standard’ preparation of C-form DNA (50). Another indication of a DNA structure resembling the C-form in the polyamine–DNA samples is that the polyamine–DNA samples where DNA is in the B-like form display low crystallinity, something typical for the C-form of DNA. It seems that the conversion of BI nucleotides into BII nucleotides gives a low crystallinity, suggesting that the occurrence of BII nucleotides is much randomized. For comparison, the 2D-syncMAS orientational distribution function of a Na-DNA sample at low NaCl-content (data not shown), showing a weak A-form DNA X-ray pattern (data not shown), was integrated in the same way as the polyamine– DNA orientational distribution functions. At 85% RH, 44% of the Na-DNA is in the A-form, the rest being in a B-like form with approximately equal amounts of BI and BII nucleotides. When the RH is lowered to 52%, all of the DNA in this NaDNA sample is in the A-form. Comparing the ratio of A-form in the Na-DNA sample to those of the polyamine-containing samples, we can note that DAP and Spd enhance the stability of the A-form of DNA, while Put, and especially Cad, repress its formation. This is in line with the findings of Minyat et al. (18) who saw the same trend with DNA fibers in ethanol/water solutions. Minyat et al. (18) suggested that the presence of the trimethylene separation between the amine charges, present in DAP, Spd and in Spn, which also stabilizes the A-form, is the crucial structural element that makes the A-form thermodynamically more stable than the B-form. This idea is based on the early
424
Nucleic Acids Research, 2002, Vol. 30, No. 2
Table 2. Water content Γ (water molecules per nucleotide) of the polyamine–DNA samples and a Na-DNA sample Spd–DNA
Cad–DNA
Put–DNA
DAP–DNA
85% RH
8.0
6.9
7.2
6.5
95% RH
13.6
11.0
12.5
13.8
aData
Na–DNA
≈13a 22 (≈22a)
taken from ref. 38.
models of the DNA–polyamine complex, where the DAP moieties of Spn lie along one DNA backbone strand each, making amine contacts with adjacent phosphates of the strand, while the central tetramethylene strand of Spn bridges either of the grooves (19–21). The argument for the stabilization of the DNA A-form relative to the B-form is that the intrastrand phosphate-to-phosphate distance in the A-form better fits the amine-to-amine distance of the trimethylene separation of the polyamine. However, Minyat et al. (18) also observed that the polyamine diaminoethane is even more effective in promoting the A-form than DAP. Our results, as well as those of Minyat et al. on the relative stability of the A-form in Na-DNA and polyamine–DNA is: DAP > Spd > Na > Put >> Cad, with DAP stabilizing the A-form most. By noting that the charge density of the polyamines follows the order DAP > Put > Spd > Cad, we may conclude that not only the overall electrostatics but also the structural details of the polyamine are of importance for the enhancement or blocking of the B–A-form transition of DNA. This implies that the B–A transition, at least in part, is affected by direct intermolecular interaction between the polyamine and DNA, and it seems to be the case that the trimethylene distance between amine charges promotes the B–A transition for structural reasons. The water content—origin and consequences The water content Γ (water molecules per nucleotide) of the polyamine samples at 85 and 95% RH is given in Table 2. At the lower RH, 85%, polyamine-containing samples show values of Γ = 6.5–8. At 95% RH, the water content of all polyamine–DNA samples is in the range Γ = 12–14. We also measured the water content for a reference sample of Na-DNA at 95% RH, resulting in Γ = 22, a value in good agreement with that found by others (38), which assures the accuracy of our method. The error in these measurements is estimated to be around ±10%, based on repeated measurements (the water content at this high level of RH is sensitive to temperature effects on the vapor pressure of water above the salt solution) (38), and thus we cannot certify the differences in Γ observed for the different samples as reported in Table 2. Within the accuracy of the measurements, the water contents of the polyamine–DNA samples at 85 and 95% RH, display relatively small differences depending on which polyamine is present. However, it is clear that the water content is rather low as compared with that of Na-DNA. In this context it should be pointed out that the water chemical potential is identical for any sample at a given RH, irrespective of counterion type. This is true as all samples have been equilibrated at the same RH and at thermodynamic equilibrium the water chemical potential of the equilibrating atmosphere will determine the water activity of any sample. To a first approximation we may ignore osmotic effects, i.e. assume the same volume per DNA
Figure 4. 2H-NMR spectra for the polyamine–DNA samples at 95% (top row) and 85% RH (bottom row). Intensities of spectra recorded at 85% RH were multiplied by a factor of two as compared with the spectra obtained at 95% RH. From left to right: spermidine, cadaverine, putrescine and 1,3-diaminopropane.
in the different polyamine samples. This means that the activity of water is the same in all systems, e.g. in the Na-DNA system at 95% RH with an absolute content of 22 water molecules per nucleotide, as in the polyamine samples where the water content is ∼50% of that. This observation shows that the general effect of the polyamines is to increase water activity of the remaining water that becomes more bulk-like. This is most probably due to polyamines substituting water in the inner hydration layer of DNA. This effect can be caused both by association to phosphates, where the amine groups of the polyamines can hydrate the charged phosphates, and by the presence of polyamines in the grooves. In addition, the hydrophobicity of the polyamine methylene chain may affect the water activity. Although the different polyamines have a varying hydrophobicity due to the different number of methylene moieties between the charged amino-groups, it is difficult to assess this contribution as the number of such methylene groups may also affect the binding to DNA. The general hydrophobic effect should, however, be that a more hydrophobic polyamine will decrease water activity, thus resulting in larger water content in order to obtain thermodynamic equilibrium. This is not observed, and thus the effect of difference in hydrophobicity seems to be of minor importance in determination of the water content in the polyamine–DNA systems at hand. Order and mobility of water 2H
quadrupolar splittings provide a way to obtain information on the binding properties and the orientational order of water of hydration (2H2O) in the systems under study (56,57). Figure 4 shows the 2H-NMR spectra from the polyamine-containing samples with the fiber director parallel to the static magnetic field, (βDL = 0° in equation 1, Materials and Methods). All spectra show one pair of intense lines with a separation (quadrupolar splitting) in the range 675–2030 Hz (values given in Fig. 4), originating from the water in the samples. The diamine samples show additional 2H spectral lines, suggesting them to be signals from the amino protons of the polyamines themselves. We will discuss the information that can be
Nucleic Acids Research, 2002, Vol. 30, No. 2
obtained from the polyamine 2H signals below, concentrating first on the water. At 95% RH, where the DNA in all the samples is in a disordered B-form, the water quadrupolar splitting is in the range 675–880 Hz for all the polyamine–DNA samples. The water quadrupolar splittings are generally smaller compared with that observed by Brandes et al. (56) for Li-DNA in the B-form at the same water content, which showed a splitting of ∼1200 Hz. This supports the idea that the polyamines can hydrate DNA. When the polyamines hydrate DNA, water is displaced to a more bulk-like environment and a smaller fraction of water is bound to DNA, compared with the situation for the Li-DNA system with the same amount of water. Within the two-state model (equation 2) this results in a smaller value of the quadrupolar splitting. It can be noted that the splittings are smaller for those samples (Spd and DAP) that have larger water contents, also being consistent with a smaller fraction of bound water. At the lower water content, 85% RH, all polyamine samples display larger water quadrupolar splittings than those observed at 95% RH. This is a natural consequence of the decrease in water content, giving rise to a larger fraction of bound water. The water quadrupolar splitting seems to correlate with the amount of A-form present in the sample, and the smaller splitting for larger amounts of A-form DNA is in line with the notion that water is released into the bulk upon the B–A transition. The effect is, however, small as compared with that observed in the B–A transition of Na-DNA, where a more substantial decrease in water quadrupolar splitting was seen (56). This is probably due to the low water content in the polyamine samples before the transition takes place. The few water molecules that hydrate the B-form DNA before the transition are also needed for the hydration of the A-form DNA after the transition. The diffusion coefficient of water in these polyamine-containing samples at 85% (water content of six to eight water molecules per nucleotide) RH is 1.8 × 10⁻¹⁰ m2/s with the divalent polyamines DAP and Put, while for the trivalent Spd it is lower; 1.1 × 10⁻¹⁰ m2/s. At the higher RH of 95% (water content of 11–14 water molecules per nucleotide), this difference is less pronounced, the diffusion coefficients now reading 3.3 × 10⁻¹⁰, 3.6 × 10⁻¹⁰ and 3.0 × 10⁻¹⁰ m2/s for the Put–, DAP– and Spd–DNA samples. Previous investigations from our group (48) showed that the water diffusion in Cs-DNA at comparable water contents was of a similar magnitude as the above values for the Spd system. Thus, the water diffusion in the diamine systems is somewhat faster than the corresponding Cs-DNA system. The water diffusion coefficient in Li-DNA was, however, much lower than those for the polyamine- and Cs-DNA samples, which is believed to be an effect of the high charge density, and hence strong attraction of water to Li+ (48). The diffusion of the Cs+ ion in salt-free Cs-DNA is substantially faster than that of the polyamines (48) (see below), but the water diffusion coefficients are similar or even slightly larger for the diamines. This is an indication that the polyamines displace water that then becomes more bulk-like. As a last point before we proceed with the polyamines themselves, it is of interest to note that the 2H spectra display only a single set of lines from water, despite the presence of both A- and B-form DNA in three of the samples at 85% RH. The most likely explanation is that the domain size of the two different structural forms in the samples is relatively small.
425
Water diffusion will then result in averaging over the different quadrupolar splittings experienced by 2H nuclei in A- and B-form environments. Order and mobility of the polyamines As already mentioned, the 2H spectra of the polyamine–DNA samples show peaks not only from the water but also from the amine groups of the polyamine. The appearance of the amine signal indicates that the amine hydrogen exchange with water deuterons is of the order of ∼1 ms (1/∆v), or slower. At 95% RH, the 2H spectra display a single additional minor peak for Cad and Put, while the DAP sample shows a broad pair of peaks that is barely resolved. In contrast, the Spd-containing sample shows no additional features apart from the water peaks (we believe that the small distortion of the water peak to the left is due to sample imperfection). At 85% RH these peaks are broadened for the diamines, and a splitting is now evident also for the Cad and Put samples. The Spd sample shows no additional features. Analysis of the relative intensities of the water peak compared with the peaks for the diamines shows that the intensity of the minor peaks are in good agreement with the relative proportions of water and polyamine in the samples, as given in Table 1. At 95% RH we expect the fractional intensity of polyamine in the 2H spectra to be 12, 11 and 10% for Cad, Put and DAP, respectively. From a fitting of the experimental spectra, the numbers read 12, 13 and ∼20%, respectively. The same analysis at 85% RH shows the relative intensities to be ∼15 and 20% for Cad and Put, respectively. The expected numbers are 18 and 17%, based on the water content in Table 1. The minor intensity in the DAP spectrum is too broad to use for fitting to a reasonable accuracy. It should be noted that the deconvolution was done using Lorentzian line shapes, which clearly is an approximation. Further evidence for the interpretation that these signals derive from the polyamines comes from measurements on a fully N-methylated sample of Put (Me6Put) prepared in the same way as the other polyamine–DNA samples, where this 2H signal is absent. The Cad- and Put-containing samples can be directly compared at both levels of hydration, as for these systems the majority of the DNA has the same B-form secondary structure. At the higher level of hydration both these diamines display a single 2H line, indicating that they experience an isotropic environment during the motional averaging of the quadrupolar interaction. At 85% RH the quadrupolar splittings for Put and Cad are 990 and 260 Hz, respectively. This shows Put to experience a larger anisotropy than Cad, with a difference in interaction with DNA. The comparatively broad 2H signals from the amine deuterons of DAP and Spd, the latter not even visible in the spectrum, indicate a pronounced interaction with DNA. This is seen already at the higher RH of 95%, where all samples display DNA in the B-form. Furthermore, the presence of a quadrupolar splitting for DAP at 95% RH shows some restriction in the motional averaging of the quadrupolar interaction, not being present for the diamines Put and Cad at the same RH. This is indicative of a difference in the interaction with DNA that imposes this anisotropy. There thus seems to be a distinct difference in interaction when a diamine moiety separated by three methylene groups is at hand, in accordance with the findings of Minyat et al. described above (18). The diffusion coefficients of the polyamines Spd, Put and DAP are displayed in Table 3. In order to obtain a diffusion
426
Nucleic Acids Research, 2002, Vol. 30, No. 2
Table 3. Diffusion coefficients for polyamines and water in polyamine-DNA samples (D × 1010 m2/s) 85% RH
95% RH
Polyamine
Water
D||
D⊥
Spd–DNA
0.017
n.m.a
Put–DNA
0.084
0.081
DAP–DNA
0.055
0.049
D ||/D0
Polyamine
Water
D||
D⊥
D||
D⊥
D||/D0
D||
D⊥
0.0035
1.05
n.m.a
0.18
0.17
0.037
2.99
2.48
0.015
1.79
1.03
0.52
0.46
0.090
3.27
3.37
0.0077
1.82
1.26
0.65
0.50
0.091
3.55
3.12
D|| and D⊥ are the diffusion coefficients parallel and perpendicular to the fiber director, respectively, and D 0 is the diffusion coefficient in dilute aqueous solution. aNot measured.
value independent of the polyamines size, the polyamine diffusion coefficients in aqueous solutions free of DNA, D 0, were also recorded. This resulted in the values 7.14 × 10⁻¹⁰, 5.76 × 10⁻¹⁰ and 4.90 × 10⁻¹⁰ m2/s for DAP (200 mM solution), Put (200 mM solution) and Spd (150 mM solution), respectively. The normalized diffusion quotients, D||/D0, have consequently also been reported in Table 3 (D|| is the component of the anisotropic diffusion in the direction parallel to the DNA fiber axis). It is evident that the diamines DAP and Put show no pronounced difference in diffusion at 95% RH. The diffusion coefficients perpendicular to the DNA axis are about the same as those parallel to the DNA axis, with a slight anisotropy for Put and DAP. The value of D/D0 (Table 2) is about 0.09 for the diamines Put and DAP at the higher RH, 95%, where the number of water molecules is about 12 per nucleotide. At approximately the same number of water molecules, corresponding to 85% RH (38), Cs+ shows a D/D0 of ~0.14, while for Li+, which was found to exhibit very slow diffusion, this number is 0.03 (48). The value of D/D0 for Spd at 95% RH is 0.03, which is similar to the effect on the Li+ ion at the same water content. This shows, as expected, that the trivalent Spd molecule is more strongly associated with DNA than the divalent polyamines are. This D/D0 value of 0.03 for Spd may be compared with the value 0.3, observed in dilute isotropic DNA solution under similar conditions of DNA phosphate to polyamine concentration (58). The retardation of the polyamine diffusion in the presence of DNA in these dense fibers is thus not dramatic, considering the fact that the system is semi-solid, consisting of closely packed DNA molecules at a very low water content (compared with a dilute isotropic DNA solution). At 85% RH, the relation between the Spd and the Put diffusion quotients is the same as it is at 95% RH where both systems are in the B-form. This shows that the higher net charge of the trivalent Spd molecule is the dominating factor determining the diffusion of this species. It is of interest to note that for DAP at 85% RH, with 50% DNA in the A-form, the diffusion quotient is a factor of two smaller than that of Put (with 15% A-form), in contrast to the result at 95% RH where these values are the same. This seems to be an effect of a stronger association of this polyamine to the A-form of DNA. To some extent this can be ascribed to the higher linear charge density of A-form DNA as compared with B-form DNA, but the effect is so large that it indicates some preferential binding of DAP to A-form DNA.
CONCLUSIONS The major result of this work is that we have shown how polyamines of varying charge and structure affect the relative proportions of the A- and B-type structures formed for fibrous DNA at different water activities. We have shown that quantitative detection of the simultaneous presence of A- and B-forms of fibrous DNA can be achieved by the use of the solid-state 2D-syncMAS 31P-NMR method, which is crucial for obtaining these results. This is in contrast with the result of X-ray measurements, for which the presence of the highly crystalline A-form obscures the diffraction pattern of the more amorphous B-form DNA. At 95% RH, corresponding to a water content of 11–14 water molecules per nucleotide, all polyamine samples with DNA are in a B-like form as deduced from both X-ray fiber patterns and the NMR measurements. On the other hand, at 85% RH, corresponding to a water content of six to eight water molecules per nucleotide, the NMR data show that the polyamine systems contain varying amounts of A-form DNA. The amount of A-form is 51, 56, 27 and 0% for the polyamines Spd3+, DAP2+, Put2+ and Cad2+, respectively. Compared with the relative amount of A-form in a Na-DNA sample at the same water content, which reads 44%, the polyamines Spd3+ and DAP 2+ promote the stabilization of the A-form, while Put2+ and Cad2+ repress its formation. Thus, DAP and Spd enhance the B–A transition, while Put and Cad repress it, indicating that the trimethylene separation between polyamine charges is of importance in this DNA structural conversion. This observation implies that direct intermolecular interaction between the polyamine and DNA plays a role in the B–A transition. The B-like form of DNA present in all samples all display phosphate orientations characteristic of BII and BI type nucleotides, as shown by the 2D-syncMAS NMR data. The high ratio of BII/BI in all of the polyamine-containing samples, in fact (close to) one at the lower RH, indicates a strong disruption of phosphate orientations of the type found in C-form DNA (44). This shows the polyamine–DNA samples to have significant deviation from the native B-form DNA structure. In a recent study by Deng et al. (15) it was stated that polyamine-bound genomic DNA maintains the native B-form secondary structure upon precipitation (condensation). This does not seem to be the case in our oriented fibers of polyamine DNA. It should, however, be noted that the Raman studies of Deng et al. were performed on condensed DNA which usually precipitates as toroids and not as oriented fibers (59). It is also not clear to us
Nucleic Acids Research, 2002, Vol. 30, No. 2
if the Raman measurements would detect differences between BI and BII nucleotides. Analysis of the water content in the different systems showed that, for a given RH, the water content is reasonably similar for the different polyamine samples but considerably lower than that of a corresponding Na-DNA system. The polyamines thus displace water from hydration sites on DNA and can perform the function of solvating the DNA by hydrogen bonding with the amine groups. Given the fact that polyamines can condense DNA in solution, this is not an unexpected result. As a result of this displacement, the water molecules of polyamine samples equilibrated at high RH are more bulk-like than those in the corresponding Na-DNA samples. Measurements of water 2H-NMR spectra of the systems, which display quadrupolar splittings, confirm the picture that polyamines displace water that hydrates the DNA molecule. This follows from comparison with previously published 2H-NMR data for Na-DNA at similar water contents, where the quadrupolar splittings are considerably larger. 2H-NMR spectra of the amine groups of the polyamines show that the diamine DAP behaves differently compared with the other diamines, displaying broader 2H-NMR lines and experiencing a larger anisotropy at 95% RH, leading to quadrupolar splitting of the amine deuteron spins, absent for the other diamines at this RH. A difference in behavior is probably also true for the triamine Spd, as no 2H-NMR signal is seen for this polyamine, which is most probably due to severely broadened lines that escape detection in the NMR measurements. The differences seen for these two polyamines, both the stabilization of the A-form observed by 2D-syncMAS 31P-NMR and the results from 2H-NMR, are indicative of a more pronounced interaction with DNA. This effect is likely to be related to the presence of the trimethylene moiety, separating the charged amine groups in DAP and one of the pairs of amines in Spd. This connection has been suggested previously (18) on the basis of early models of polyamine–DNA binding (20,21,60). Polyamine diffusion at the higher water content (95% RH) is not dramatically retarded compared with diffusion in an isotropic DNA solution. This is an interesting observation as it shows that in spite of the fact that this is a solid fibrous system, with densely packed DNA at a quite low absolute water content, the diffusion of the trivalent Spd molecule is not reduced more than an order of magnitude. The observation shows that the root mean square displacement is not reduced more than about a factor of three compared with the situation in an isotropic solution. The tetravalent polyamine Spn is usually not detected in single crystal X-ray structure determinations of B-form oligonucleotides. On the basis of a recent molecular dynamics simulation of the DNA/H2O/Na/Spn system, we suggested that this is due to the absence of specific binding sites for this polyamine to B-form DNA (25). The present observation of relatively fast macroscopic diffusion of polyamines in oriented DNA fibers confirms this picture. At the lower water content (85% RH) the diffusion of DAP which has a large amount of A-form DNA, shows slower diffusion compared with the other divalent polyamine Put, indicating a different interaction between A- and B-form DNA. The magnitude of the water diffusion coefficients also confirms the above-mentioned picture of water that is relatively free in motional behavior.
427
ACKNOWLEDGEMENTS We are grateful to Dr Istvan Furo at the Physical Chemistry Department, Royal Institute of Technology, Stockholm, for performing some of the gradient NMR measurements and to Prof. Malcolm Levitt for stimulating discussions. Nikolay Korolev acknowledges support from the Swedish Institute and from the foundation Wenner-Grenska samfundet. REFERENCES 1. Cohen,S.S. (1998). A Guide to the Polyamines. Oxford University Press, NY. 2. Davis,R.H., Morris,D.R. and Coffino,P. (1992) Sequestered end products and enzyme regulation: the case of ornithine decarboxylase. Microbiol. Rev., 56, 280–290. 3. Tabor,C.W. and Tabor,H. (1984) Polyamines. Annu. Rev. Biochem., 53, 749–790. 4. Russel,D.H. and Durie,B.G.M. (1978) Polyamines in various pathological states. Prog. Cancer Res. Ther., 8, 157–165. 5. Shah,N., Thomas,T., Shirahata,A., Sigal,L.H. and Thomas,T.J. (1999) Activation of nuclear factor κB by polyamines in breast cancer cells. Biochemistry, 38, 14763–14774. 6. Pegg,A.E. (1986) Recent advances in the biochemistry of polyamines in eucaryotes. Biochem. J., 234, 249–262. 7. Watanabe,S., Kusama-Eguchi,K., Kobayashi,H. and Igarashi,K. (1991) Estimation of polyamine binding to macromolecules and ATP in bovine lymphocytes and rat liver. J. Biol. Chem., 266, 20803–20809. 8. Bloomfield,V.A. (1991) Condensation of DNA by multivalent cations – considerations on mechanism. Biopolymers, 31, 1471–1481. 9. Gosule,L.C. and Schellman,J.A. (1976) Compact form of DNA induced by spermidine. Nature, 259, 333–335. 10. Raspaud,E., Chaperon,I., Leforestier,A. and Livolant,F. (1999) Spermine-induced aggregation of DNA, nucleosome and chromatine. Biophys. J., 77, 1547–1555. 11. Wemmer,D.E., Srivenugopal,K.S., Reid,B.R. and Morris,D.R. (1985) Nuclear magnetic resonance studies of polyamine binding to a defined DNA sequence. J. Mol. Biol., 185, 457–459. 12. Banville,D.L., Feuerstein,B.G. and Shafer,R.H. (1991) 1H and 31P nuclear magnetic resonance studies of spermine binding to the Z-DNA form of d(m5CGm5CGm5CG)2: evidence for decreased spermine mobility. J. Mol. Biol., 219, 585–590. 13. van Dam,L. and Nordenskiöld,L. (1999) Interactions of polyamines with the DNA-octamers d(m5CG)4 and d(GGAATTCC). A 1H-NMR investigation. Biopolymers, 49, 41–53. 14. Andreasson,B., Nordenskiöld,L. and Braunlin,W.H. (1996) An NMR self-diffusion study of the interactions between spermidine and oligonucleotides. Biopolymers, 38, 505–513. 15. Deng,H., Bloomfield,V.A., Benevides,J.M. and Thomas,G.J.,Jr (2000) Structural basis of polyamine-DNA recognition: spermidine and spermine interactions with genomic B-DNAs of different GC content probed by Raman spectroscopy. Nucleic Acids Res., 28, 3379–3385. 16. Behe,M. and Felsenfeld,G. (1981) Effects of methylation on a synthetic polynucleotide: the B-Z transition in poly(dG-m5dC)*poly(dG-m5dC). Proc. Natl Acad. Sci. USA, 78, 1619–1623. 17. Vertino,P.M., Bergeron,R.J., Cavanaugh,P.F.,Jr and Porter,C.W. (1987) Structural determinants of spermidine-DNA interactions. Biopolymers, 26, 691–703. 18. Minyat,E.E., Ivanov,V.I., Kritzyn,A.M., Minchenkova,L.E. and Schyolkina,A.K. (1978) Spermine and spermidine-induced B to A transition of DNA in solution. J. Mol. Biol., 128, 397–409. 19. Suwalsky,M., Traub,W., Shmueli,U. and Subirana,J.A. (1969) An X-ray study of the interaction of DNA with spermine. J. Mol. Biol., 42, 363–373. 20. Tsuboi,M. (1964) On the melting temperature of nucleic acids in solution. Bull. Chem. Soc. Jpn, 37, 1514. 21. Liquori,A.M., Constantino,L., Crescenzi,V., Elia,V., Giglio,E., Puliti,R., De Santis Savino,M. and Vitagliano,V. (1967) Complexes between DNA and polyamines: a molecular model. J. Mol. Biol., 24, 113–122. 22. Timsit,Y. and Moras,D. (1992) Crystallization of DNA. Methods Enzymol., 211, 409–429. 23. Drew,H.R., Wing,R.M., Takano,T., Broka,C., Tanaka,S., Itakura,K. and Dickerson,R.E. (1981) Structure of a B-DNA dodecamer. Conformation and dynamics. Proc. Natl Acad. Sci. USA, 78, 2179–2183.
428
Nucleic Acids Research, 2002, Vol. 30, No. 2
24. Tari,L.W. and Secco,A.S. (1995) Base-pair opening and spermine binding–B-DNA features displayed in the crystal structure of a gal operon fragment: implications for protein–DNA recognition. Nucleic Acids Res., 23, 2065–2073. 25. Korolev,N., Lyubartsev,A.P., Nordenskiöld,L. and Laaksonen,A. (2001) Spermine: an ‘invisible’ component in the crystals of B-DNA. A grand-canonical Monte Carlo and molecular dynamics simulation study. J. Mol. Biol., 308, 907–917. 26. Wahl,M.C. and Sundralingam,M. (1997) Crystal structures of A-DNA duplexes. Biopolymers, 44, 45–63. 27. Gessner,R.V., Frederick,C.A., Quigley,G.J., Rich,A. and Wang,A.H.J. (1989) The molecular structure of the left-handed Z-DNA double helix at 1.0-Å atomic resolution. J. Biol. Chem., 264, 7921–7935. 28. Egli,M., Williams,L.D., Gao,Q. and Rich,A. (1991) Structure of the pure-spermine form of Z-DNA (magnesium free) at 1-Å resolution. Biochemistry, 30, 11388–11402. 29. Bancroft,D., Williams,L.D., Rich,A. and Egli,M. (1994) The low-temperature crystal structure of the pure-spermine form of Z-DNA reveals binding of a spermine molecule in the minor groove. Biochemistry, 33, 1073–1086. 30. Robinson,H. and Wang,A.H.J. (1996) Neomycin, spermine and hexaaminecobalt(III) share common structural motifs in converting B- to A-DNA. Nucleic Acids Res., 24, 676–682. 31. Ruiz-Chica,J., Medina,M.A., Sánchez-Jiménez,F. and Ramírez,F.J. (2001) Fourier transform Raman study of the structural specificities on the interaction between DNA and biogenic polyamines. Biophys. J., 80, 443–454. 32. Bryson,K. and Greenall,R.J. (2000) Binding sites of the polyamines putrescine, cadaverine, spermidine and spermine on A- and B-DNA located by simulated annealing. J. Biomol. Struct. Dyn., 18, 393–412. 33. Sy,D., Hugot,S., Savoye,C., Ruiz,S., Charlier,M. and SpotheimMaurizot,M. (1999) Radioprotection of DNA by spermine: a molecular modelling approach. Int. J. Rad. Biol., 75, 953–961. 34. Sommer,H.Z., Lipp,H.I. and Jackson,L.L. (1971) Alkylation of amines. A general exhaustive alkylation method for the synthesis of quarternary ammonium compounds. J. Org. Chem., 36, 824–828. 35. O’Brien,F.E.M. (1948) The control of humidity by saturated salt solutions. J. Sci. Instrum., 25, 73–76. 36. Spencer,H.M. (1926) Laboratory methods for maintaining constant humidity. In Washburn,E.W. (ed.), International Critical Tables of Numerical Data, Physics, Chemistry and Technology by the National Research Council of the United states of America. McGraw-Hill, New York, NY, Vol. 1, pp. 67–68. 37. Rupprecht,A. (1970) A wet-spinning apparatus and auxiliary equipment suitable for preparing samples of oriented DNA. Biotechnol. Bioeng., 12, 93–121. 38. Lee,S.A., Lindsay,S.M., Powell,J.W., Weidlich,T., Tao,N.J., Lewen,G.D. and Rupprecht,A. (1987) A Brillouin scattering study of the hydration of Li- and Na-DNA films. Biopolymers, 26, 1637–1665. 39. Halle,B. and Wennerström,H. (1981) Interpretation of magnetic resonance data from water nuclei in heterogeneous systems. J. Chem. Phys., 75, 1928– 1943. 40. Anderson,C.F., Record,M.T.J. and Hart,P.A. (1978) Sodium-23 NMR studies of cation-DNA interactions. Biophys. Chem., 7, 301–316. 41. Harbison,G.S. and Spiess,H.W. (1986) Two-dimensional magic-angle-spinning NMR of partially ordered systems. Chem. Phys. Lett., 124, 128–134. 42. Tang,P., Santos,R.A. and Harbison,G.S. (1989) Two-dimensional solid-state nuclear magnetic resonance studies of the conformation of oriented DNA. Adv. Magn. Reson., 13, 225–255.
43. Song,Z., Antzutkin,O.G., Lee,Y.K., Shekar,S.C., Rupprecht,A. and Levitt,M.H. (1997) Conformational transitions of the phophodiester backbone in native DNA: two-dimensional magic-angle-spinning 31P-NMR of DNA fibers. Biophys. J., 73, 1539–1552. 44. van Dam,L. and Levitt,M.H. (2000) BII nucleotides in the B and C-forms of natural-sequence polymeric DNA: a new model for the C-form of DNA. J. Mol. Biol., 304, 541–561. 45. Harbison,G.S., Vogt,V.-D. and Spiess,H.W. (1987) Structure and order in partially oriented solids: characterization by 2D-magic-angle-spinning NMR. J. Chem. Phys., 86, 1206–1218. 46. van Dam,L. (2000) NMR Studies of DNA Structure and Counterion Behaviour. Doctoral thesis. Physical Chemistry, Stockholm University, Sweden. 47. Levitt,M.H. (1997) The signs of frequencies and phases in NMR. J. Magn. Res., 126, 164–182. 48. van Dam,L., Lyubartsev,A.P., Laaksonen,A. and Nordenskiöld,L. (1998) Self-diffusion and association of Li+, Cs+ and H 2O in oriented DNA fibers. An NMR and MD simulation study. J. Phys. Chem. B, 102, 10636–10642. 49. Tanaka,K. and Nomura,M.J. (1987) Measurements of tracer diffusion coefficients of lithium ions, chloride ions and water in aqueous lithium chloride solutions. J. Chem. Soc. Faraday Trans. 1, 83, 1779–1782. 50. Saenger,W. (1984) Polymorphism of DNA versus structural conservatism of RNA. In Cantor,C.R. (ed.), Principles of Nucleic Acid Structure. Springer-Verlag, New York, NY, pp. 220–241. 51. Saenger,W., Hunter,W.N. and Kennard,O. (1986) DNA conformation is determined by economics in the hydration of phosphate groups. Nature, 324, 385–388. 52. Grzeskowiak,K., Yanagi,K., Privé,G.G. and Dickerson,R.E. (1991) The structure of B-helical CGATCGATCG and comparison with CCAACGTTGG. The effect of base-pair reversals. J. Biol. Chem., 266, 8861–8883. 53. Schneider,B., Neidle,S. and Berman,H.M. (1997) Conformations of the sugar-phosphate backbone in helical DNA crystal structures. Biopolymers, 42, 113–124. 54. Tisné,C., Hantz,E., Hartmann,B. and Delepierre,M. (1998) Solution structure of a non-palindromic 16 base-pair DNA related to the HIV-1 κB Site. Evidence for BI-BII equilibrium inducing a global curvature of the duplex. J. Mol. Biol., 279, 127–142. 55. Pichler,A., Rüdisser,S., Mitterbock,M., Huber,C.G., Winger,R.H., Liedl,K.R., Hallbrucker,A. and Mayer,E. (1999) Unexpected BII conformer substate population in unoriented hydrated films of the d(CGCGAATTCGCG)2 dodecamer and of native B-DNA from salmon testes. Biophys. J., 77, 398–409. 56. Brandes,R., Rupprecht,A. and Kearns,D.R. (1989) Interaction of water with oriented DNA in the A- and B-form conformations. Biophys. J., 56, 683–691. 57. Brandes,R., Kearns,D.R. and Rupprecht,A. (1988) A 2H-NMR study of the DNA hydration water in solid Li-DNA assemblies. Biopolymers, 27, 717–732. 58. Andreasson,B., Nordenskiöld,L. and Schultz,J. (1996) Interactions of spermidine and methylspermidine with DNA studied by nuclear magnetic resonance self-diffusion measurements. Biophys. J., 70, 2847–2856. 59. Rupprecht,A. and Piskur,J. (1983) A simple mechanochemical method for studying structure and dynamics of bipolymer fibers in various media. Acta Chem. Scand., B37, 863–864. 60. Trohalaki,S., Frisch,H.L. and Lerman,L.S. (1991) The effects of lithium, rubidium, cesium and magnesium ions on the close packing of persistence length DNA fragments. Biophys. Chem., 40, 197–205.