PHYSICS 101 - LECTURE 2 The art of physics: Finding patterns in numbers - Playing with Mathematical Models Finding patterns in observations In the first lecture of this course I claimed that numbers were the essence of physics; that physics was a method for studying natural phenomenon in which the numbers that came from measurements were substituted for intuitive impressions about things. However, physics does not stop there. Getting the numbers is only the start. As in all other human activity, we try to detect patterns in our observations, in the case of physics we look for patterns in the numbers. One of the greatest abilities of humans, much greater than that of other animals, is the ability to detect patterns in observations. This was the basis of our early success in hunting; we could detect the patterns of behaviour of animals and adjust our movements to make use of these patterns. We discerned patterns in the days of the seasons and used these patterns to form an agricultural society. In the first lecture I already commented on the remarkable ability of humans to detect patterns in a human face that indicate the attitude and probable behaviour of the person behind the face. In fact we are so good at discerning patterns that we can easily see them when they do not, in fact, exist, a common example I already mentioned being the man in the Moon. Other example were the illusions I quoted from the book “How We Know What Isn’t So” by Gilovich, specifically the illusions of the HotHand in basketball and the fertility of previously infertile couples that adopt. In physics, and indeed in science in general, we try to avoid such false impressions by being very careful in counting the observations, i.e. in making the measurements. And then, once we have what we think are reliable numbers, with the correct number of significant digits (see textbook chapter one, or pay attention in your chemistry class) we try to find some relationship between the numbers. The simplest pattern - none The simplest type of relationship to look for is that between two sets of numbers. For example, in the case of the Hot Hand, you would
take the average number of baskets per game for players that had succeeded in their first shot compared to the average score for players that were unsuccessful in their first shot. Gilovich showed that, to within the expected statistical variation, there was no difference. In fact, the average for the players who were unsuccessful was a little higher. That leads to the natural tendency to theorize about reasons for this, such as a player “warming up” to the game. However, a true scientist will not do any such theorizing, nor accept any theories by anybody else, unless the numbers are statistically significant. Thus scientists commonly have the reputation of being wet blankets. Actually, one of the greatest peeves of scientists is the misuse of statistics by people who should know better. It is also a peeve of most intelligent people, as expressed in the wellknown sentiment “There are lies. There are Damn Lies. And then there’s Statistics.” However, when properly applied, statistics show that there is no pattern in the basketball baskets and the success at the first shot. While this might be a disappointment to people who really want to believe in the Hot Hand, such a null result is very common in science, and is often a very valuable result just because it is a null. For example, one of the most important results of modern physics is that the velocity of light in a vacuum, again to within expected statistical variation in all the measurements that have been made, is the same for all observers anywhere in the Universe. In other words, there is no pattern to the numbers of the measurements. This “null” result is the foundation of Einstein’s theory of Special Relativity, a theory that led directly to his famous equation E = mc 2 which in turn led ultimately to the discovery of nuclear energy. To see the possible attraction of such a null result, consider ancient measurements of the number of days in a year. This was a very important matter to primitive societies, particularly
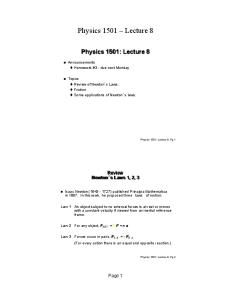
Physics 101A - Physics for the life sciences once agriculture had been established. Elaborate and magnificent creations, such as Stonehenge in England, were erected for this purpose. They were erected to observe the position of the rising Sun on the horizon. The day when this position ceased to move Southward and started to progress Northward, the "solstice", was the first day of the New Year. Tabulated below is what would have been a typical result over a 12 year span.
2
380 ?
370 Solstice day
?
360 350 340 0
1
2
3
4
5
6
7
8
9
10 11 12 13
Year
Year
Day at which soltice came -
0 1 2
365
3
365
4
366?
5
365
6 7
365
8
365
9
365
10 11
365
12
366?
365
366?
365
Imagine the concern, after observing 365 days for three consecutive years in a row, of observing 366 days! Did they make a mistake? (It was very difficult to make the observations accurately, even with a device as large as Stonehenge.) Or was it the act of a capricious God who could have added as many days of winter as He wished, thereby wiping out the agriculture on which humans had come to depend. This question could only be answered definitively by repeating the measurements over many years. The relationship between the number of days and the number of years could then have been shown by the modern technique, if the ancients had had it, of plotting the numbers on an “x-y” graph. That would have given the result shown below.
This graph shows that the data over many years is best fitted by a straight horizontal line that represents 365 1/4 days. But what had these ancients discovered? They had discovered that while the number of days in a year was not exactly 365 it was still a constant, i.e. 365 1/4 days. This was no doubt reassuring. The length of the year was not the act of a capricious God. The seasons would come back, regularly. Life would start again with each spring. The comfort this concept brings is similar to a child’s comfort with the principle that Mother doesn't cease to exist when she leaves the room. There are constants in this Universe which can be depended on. At a higher level, modern physicists take the same sort of comfort in the constancy of the velocity of light in a vacuum. While the birth of the New Year and the seasons it would bring were very important for the planning of crops, the time available during a day was also important, particularly in travel and the commerce associated with it. Imagine observations of the length of the days with the newly invented water clock. A typical set of results might have been: Day
Water dumps between sunrise & sunset -
0 1 2
55
3
52
4
60
Day
Water dumps between sunrise & sunset
7
57
8
59
9
55 53
54
10 11
5
58
12
55
6
54
57
Plotting this data gives the graph shown below.
Lecture 2 - The art of physics: Finding patterns in numbers – Playing with Mathematical Models of a day is not constant but varies in a cyclic fashion.
70
57 Dumps
Is there really a sloping trend to this data?
60 Water dumps
3
70
50
60 Water dumps
40 30
50 40
0
1
2
3
4
5 6 Day
7
8
9
10
11 12
13 30 0
At first it might appear that, to within statistical variation, we have another constant; the number of water dumps per day. The scatter of the points about a line drawn through them could be just due to the inaccuracy of measuring the length of a day by a crude water clock. (They did get much more accurate about 4000 years later at the hands of the Greeks.) However, close inspection seems to indicate that the scattered points are best approximated by a line that slopes a little downward to the right. Imagine then a sequence of observations (measurements) made over many more days, covering more than a year. The data for observation made every month might have looked something like this: Month 0 1 2 3 4 5 6 7 8 9 10 11 12 13 14 15 16 17 18
Water dumps between sunrises 51 43 46 42 47 50 54 66 66 69 66 65 56 52 43 40 44 45
Plotting this data gives a graph as shown below. It is clear from this graph that the length
1
2 3
4 5
6
7
8
9 10 11 12 13 14 15 16 17 18
Month
Of course, this cyclic variation would have been no surprise to the Babylonians. Everyone knew that the length of the days varied with the seasons. Such a cyclic relationship between sets of numbers was believed to show the basic nature of the World, that all things were cyclic, that history repeated itself. Other than a strict constancy, this was the most comforting sort of variation there could be. What is perhaps intriguing is that oscillations are also the most basic form of variation in modern physics. Modern string theory relates the fundamental particles of the Universe to oscillations in multidimensional space. Other patterns: the invention of geometry The investigation of general patterns between sets of numbers seems to have been first taken up seriously by the Egyptians, although there ii evidence that they got at least some of their ideas from the Babylonians, or from civilizations farther East into modern day India. The principle practitioners of this art were the Egyptian surveyors, who were very important in the Ancient Egyptian culture because of the annual flooding of the Nile. They were needed to resurvey the land after the covering of fresh soil brought down by the Nile from central Africa each spring. (It was the natural irrigation provided by this flooding that made Egypt so prosperous and hence so powerful in Ancient times. The unnatural irrigation that had previously made the "fertile crescent" so powerful finally resulted in the soil being so salty that the whole region turned into a dessert; the first case in recorded history of man's destruction of his environment.) Anyway, the ancient Egyptian surveyors became the world's first experts on the triangle. One of the rules they discovered about triangles
Physics 101A - Physics for the life sciences is called the law of proportional sides. To make this concept concrete, imagine an Egyptian surveyor walking East in the direction of the early morning Sun. To his left is a path leading straight to a pyramid. He notes the distance this path moves away from him as he walks toward the Sun.
4 is a straight line. The mathematical short hand for such a relationship is d∝x where d is the symbolic representation of the distance of the surveyor from the path to the pyramid and x is the distance he has walked toward the Sun. This form is now most often written as
Distance from path to pyramid
d = ax Direction of Sun 0
100 Cubits 200 Cubits 300 Cubits 400 Cubits 500 Cubits
Typical data for this distance would be: Distance walked (Cubits)
Distance from path to pyramid (Cubits)
0
0
100
30
200
55
300
82
400
111
500
132
where a is called the "proportionality constant". This can be determined by the common technique of calculating the "rise over run", which was used by the ancient Egyptians to calculate the slope of an incline. Here, taking the "rise" to be 130 cubits on a "run" of 500 cubits gives a value of a to be 0.26. The Egyptian surveyors were practical people who generally concerned themselves about laying out the land on the banks of the Nile using triangles. However, it seems that they were fascinated by a relationship that showed up in the most powerful geometrical form known since antiquity; the circle. By laying down different lengths of rope in perfect circles (the Egyptian word for surveyor meant "rope carrier" since ropes was the principle tools of their trade) they would find a typical set of data shown below: Rope wound in a perfect circle
A graph of this data would look like this: Diameter of circle
100 Distance from path to pyramid (Cubits)
Length of rope cubits
0 0
100
200
300
400 500
Distance walked (Cubits)
This sort of relationship was called "proportional". In modern terms it is also called "linear" because the graph that represents the data
Diameter ofcircle cubits
0
0
1
0.32
2
0.64
3
0.95
4
1.27
Again using the modern technique of plotting the data you would get:
Length of rope
cubits
Lecture 2 - The art of physics: Finding patterns in numbers – Playing with Mathematical Models the experiment yourself on an unknown liquid using modern units of measure for weight and volume, you would get a typical set of data as shown.
4 1
3
Slope = 3.14... ?
2
Volume
Weight
ml
grams
3.14
1 0 0
5
1 0.5 Diameter of circle cubits
The remarkable thing about this experiment is that it always gave the same proportionality constant, i.e. about 3.14. However, this number did not seem to have any relationship to any other set of known numbers. It was very close to the fraction 22/7, but not quite. What was this magic number, really? It seems that the Egyptians didn't worry to much about it but just went right on surveying. Incidentally, the value given in the Egyptian Rhind Papyrus of about 1650 BC for “π” (it was not actually called Pi until about the 18th century in Europe) was 256/81 or, in modern decimal notation, 3.1605. The modern value of π is 3.1416..., meaning that the Ancient Egyptians were only off by + 0.6%. It was the Greeks, particularly the class of Greek that had lots of time to lie around thinking and discussing, apparently aided by liberal amounts of wine while the slaves and women did the work, who thought about this number and finally discovered a geometrical method by which it could be calculated. However, they found that all they could get was an approximation to its real value. Its real value did not seem to be any fraction that could be expressed by whole numbers. Since they believed that the circle was devine, i.e. a creation of the Gods, they regarded this number as devine. Again incidentally, the Greeks calculated π to be about 211875/67441, which turns out to be just 15 ppm greater than its value as calculated with modern computers. The Greeks did remarkable things with the geometry they picked up from the Egyptians. One of them, Archimedes, showed that there is a proportional relationship between the weight of water and its volume (a result that was confirmed by Newton about 1700 years later). If you did
0
0
100
83.1
200
161.1
300
239.1
400
315.3
Again, plotting this data you get 400 400
300
Slope = 0.8 g/ml (= Specific gravity)
Weight grams 200
320
100 0 0
100 200 300 Volume - ml
400
The slope of this graph, which is seen to be about 0.8 g/ml, is referred to as the "density" of the liquid being studied. (Note that the modern SI units of density are kilogram per cubic meter.) In symbolic form this becomes m = ρV where m is the internationally agreed upon symbol for mass, ρ the internationally agreed upon symbol for density and V the internationally agreed upon symbol for volume. It was here that the Greeks made the first steps that could be called an approach to physics.
Physics 101A - Physics for the life sciences
6
They asked, and finally answered, the question "Why?". The why of the proportional relationship The early studies of the Ancient Greeks was of the geometry they picked up from the Egyptian surveyors. The Egyptians had already developed "theorems" showing the why of this geometry. One of the simplest to understand was that of the proportions of the sides of triangles. This could be easily demonstrated by constructing a number of identical triangles as shown below.
Simply by counting the triangles involved you can prove that the distance of the path from the surveyor is proportional to the distance he has walked. A similar argument was used to explain the proportional relationship between the weight of water and its volume. "Matter can not be created nor destroyed". Therefore each unit volume of water placed in the container remains a unit and the total weight is the sum of the weights of these units. However, the greatest triumphs of the Greeks came with their studies of relationships beyond the simple linear. The quadratic relationship The greatest concern of the Egyptian surveyors was actually the area of land. This again was an obvious consequence of the flooding of the Nile. When the land was parceled out again each spring, people, not least of all the Pharaoh, needed to know how much land they had. In other words they needed to know the area of each piece. For this the surveyors used a square grid, since the area of a square is easily determined, particularly if it is one cubit on each side. It is simply a "square cubit". With a square cubit grid you can therefore just count up the squares on a person's land and find out how many square cubits he had. For a rectangular plot of land this is very simple;
square cubit
You could count all the squares in such an array but it would be much faster to just count the number of rows and the number of columns and multiply them together. In mathematical form the area of a rectangle is its base times its height. The Egyptians knew this, as do even modern medical students. The Egyptians also knew how to calculate the area of a triangle. It is one-half its base times its height. This could easily be shown by dividing the triangle as shown below, duplicating its parts to make twice the area of the triangle and then rearranging the parts to form a rectangle of the same width and height of the original triangle. DUPLICATE OF PART 1
DUPLICATE OF PART 2
HEIGHT =h
PART 1
PART 2
BASE =b AREA OF TRIANGLE = HALF AREA OF RECTANGLE = HALF BASE TIMES HEIGHT
A =
1 bh 2
However, simple tricks like this failed with the area of that very fascinating geometrical shape; the circle. One was stuck either trying to approximate the circle with a jumble of thin triangles or simply with counting up the squares, trying to estimate the sum total of all the bits of squares that the circle cut through by approximating them as little triangles.
Lecture 2 - The art of physics: Finding patterns in numbers – Playing with Mathematical Models
Grid for determining area (square cubits)
7
Clearly this is not a linear relationship. However, notice what happens when you plot the area against the square of the diameter of the circle: 500 500
400
Area of circle square cubits
Diameter of circle
Slope = 0.784
300
=
3.142 4 392
200 100
A typical set of results of measurements made in this way would be:
0
5
20
10
78
15
178
20
314
25
490
500
Area of circle square cubits
400 300 200 100 0 10 20 Diameter of circle cubits
100 200 300 400 500 600 700
Now we get a linear graph. The slope of this linear graph is about 0.784... A calculator quickly shows that this number is close to π divided by 4. Thus the area of a circle is one quarter of π times its diameter squared. Noting that the radius of a circle is half its diameter, this can be expressed more simply as π times the radius squared or, in symbolic form:
Plotting these results gives the graph shown below.
0
0
Square of Diameter of circle square cubits
Diameter ofcircle Area of circle cubits square cubits 0
0
30
A = πr 2 Thus the magic number π returns, giving even more mystery to the circle. Eventually the Greeks found a geometrical proof that if the ratio of the circumference of a circle to its diameter is π then the area of a circle must be π times its radius squared. This just confirmed their opinion that mathematics was the language of the Gods. However, the greatest triumphs of the Greeks came with their study of a curious trick used by the Egyptian surveyors, seemingly picked up from ancient India but still kept secret to preserve the value of the surveyors to their employers. Included in the toolbox of an Egyptian surveyor were three pieces of rope, in the ratio of lengths of 3 to 4 to 5, such as 30 cubits, 40 cubits and 50 cubits. When laid out in a triangle on the sand, the three formed a right-angled triangle :
Physics 101A - Physics for the life sciences
8
s
bit
u 5c
3 cubits Right Angle
4 cubits
This was, in fact, how the Egyptian surveyors laid out their square grids. The Egyptians, and the earlier Babylonians and Indians before them, no doubt noticed the mathematical relationship between these numbers: the square of the larger number is the sum of the squares of the two smaller ones. They also knew of a larger set that had the same relationship, but this one was not as practical for surveying:
13
its
cub
5 cubits Right Angle
Furthermore, by measuring the area of such squares for any right angled triangles it was known more than a thousand years before the Greeks got around to considering it, that this seemed to be a general rule, not just the case for special triangles such as 3:4:5 or 5:12:13. The contribution of the Ancient Greeks to the study of this phenomenon, represents perhaps the clearest example of their philosophy concerning the World. The genius Pythagoras developed a geometrical construction that proved that the relationship was true for any right-angle triangle. In this way he answered the question "Why?" concerning such triangles and by so doing carried out one of the earliest examples of what we now call physics. Essentially, he used the logic of mathematics to study the structure of the imaginary perfect right angle triangle that represented the lines the Egyptian surveyors were drawing in the sand There were many other important results from the study of areas by the Ancient Egyptians and Greeks. One was the general rule that the area of any particular shape, no matter what that shape, was proportional to the square of any one of its dimensions. This can be seen by drawing the shape onto a grid.
12 cubits
Also, it was no doubt obvious that this numerical relationship implied that a square erected on the hypotenuse would have an area equal to the sum of the areas of two smaller squares erected on the other two sides.
If now the object is made twice as big while retaining its shape, it can be seen to cover twice as many squares in both the horizontal and vertical directions.
Area = s 2
s
y
Area = y 2
x
Area = x 2
2
2
s = x + y
2
Lecture 2 - The art of physics: Finding patterns in numbers – Playing with Mathematical Models The object now covers four times as many squares. The area of the objects that have the same shape is therefore proportional to the square of their linear size. The simplest such case to visualize is just this case of the expansion of an object to twice its linear dimensions while retaining its shape. Each square millimeter on the original object then becomes 4 square millimeters. Such a relationship is called a "quadratic relationship". A very important aspect of this relationship had been studied extensively by Egyptians. This is the rule that a rope of given length encloses the greatest area when that area is in the shape of a circle. As a calculation exercise, consider the ratio of the area of a rope would enclose as a square compared to the area that same rope would encompass as a circle.
9
people went back to believing that the Earth was flat.. The Greek studies of the sphere led to the following rules for the surface area and the volume of a sphere: A = 4πr 2 4 Volume of a sphere; V = πr 3 3 As in the case of the area of any shape being proportional to the square of its linear dimensions, so the surface area of any particular shape of solid is proportional to the square of its linear dimensions. Similarly, the volume of any shape of object is proportional to the cube of its linear size. Again, this can be related to a very important example known at least to the Ancient Greeks. This is the rule that a sphere has the greatest volume to surface area ratio of any geometrical object. This rule is why water drops and bubbles tend to be spherical. As another calculation exercise, consider the ratio of the volume of a cube to that of a sphere that has the same surface area. Surface Area of a sphere;
This rule is of great importance in living organisms. It is one of the reasons, for example, that tree trunks tend to be round. Extension to three dimensions. One of the greatest contributions of the Ancient Greeks to the history of physics was to extend the mostly two-dimensional geometry of the Egyptians to three dimensions. It seems that the drive for this was the navigational needs of the Greek navy, who knew that the surface of the Mediterranean was curved (as did the Indians 1000 years earlier). Whatever, the study of the Greeks led not only to the certification that the Earth was indeed spherical but also to a good estimate of its diameter, a fact that was forgotten with the death of the Greek culture when many
The Greeks also showed how the theorem of Phythagoras could be extended to three dimensions. Imagine yourself as an Egyptian surveyor gazing at a pyramid. The position of the tip of the pyramid relative to you could be
Physics 101A - Physics for the life sciences specified by three numbers, which are the short sides x, y and z of the right angled triangles shown; 2 2 z x +y +
s =
z
x
y
2
Q=
πr 4 P 8ηL
2
x2 + y2
2
10
2
s = x +y +z
2
In this diagram you can see that the distance x, which could be the distance of the Pyramid tip in the Easterly direction, and the distance y, which would then be the distance of the tip in the Northerly direction, together form the small sides of a right angle triangle in which the hypotenuse is the line from the surveyor to the base of the pyramid under the tip. This line itself is the short side of the greater right-angle triangle in which the other small side is the height (z) of the pyramid. The hypotenuse of this triangle is the line of sight of the surveyor to the tip of the pyramid. The distance of the tip from the surveyor is therefore the square root of the sum of the squares of the three numbers x, y and z that specify the position of the pyramid tip relative to the surveyor. Extension to higher dimensions? Can this sort of geometry be extended to higher dimensions? Indeed it can. All that is required is to add another term like z, and this is essentially what Einstein did in his famous theory of relativity. (Mathematicians had done this before him but they did not see any relevance of it to the real world. In fact, to develop his theory of relativity Einstein himself had to go back to the books and master the higher dimensional geometry that the mathematicians had developed in the 19th century.) However, there are many simpler cases where a functional relationship goes beyond the cubic. One physics example important to biology is that of the flow of liquids in circular tubes. The relationship, discovered in the 18th century, is
where Q is the rate of flow in volume per second, r is the internal radius of the tube, P the pressure difference from the tube input to the tube output, η is the viscosity of the liquid and L the length of the tube. Thus the quantity of blood flowing through an artery of given length at a given heart pressure will be proportional to the fourth power of the artery radius. Consider the importance of this in the flow of blood through the arteries. The brain needs a certain flow Q to satisfy its needs or it will have a stroke. Given that the arteries will have a fixed length the most variable factor in the equation is the internal radius of the artery. Suppose that, due to cholesterol or some other condition such as hardening of the arteries, this radius decreases by 20%, i.e. to 0.8 of its normal value. To maintain the blood flow the heart pressure would have to increase by a factor (1/0.8) to the fourth power. A quick calculation shows this to be about 2.5 times. This is an impossible demand on the heart and so, without blood thinning agents to reduce the viscosity this patient will very likely have a heart attack. The bit of philosophy What I have been doing in this lecture is showing mathematical objects that have the same features as those observed for real things, such as triangles with perfectly straight sides as compared to the lines in the sands of Egypt made by the ancient surveyors, or the equation for the pressure required to get a certain flow though a circular pipe compared to the actual blood pressure required to get blood through the arteries to the brain. In our minds we can imagine perfectly straight lines, perfectly flat surfaces and, indeed, perfect circles. (It takes a little more effort to imagine perfect arteries.) We can also imagine a geometry that has certain rules of logic, such as plane geometry in which the internal angles of a triangle always add up to 180 degrees, or spherical geometry in which they do not. We can imagine these objects even though in the real world there is no such thing as a perfectly straight line or a perfect circle, or a perfect sphere. What is amazing is that these imagined objects can exhibit many of the features of the
Lecture 2 - The art of physics: Finding patterns in numbers – Playing with Mathematical Models real world, such as the lines and circles made in the sand by the Egyptian surveyors and even the Earth itself. Indeed, it is the observed relationship between real lines and circles that led to imagining such things as perfect lines and circles and their relationships, i.e. to the invention of mathematics. However, in science, particularly physics, it is important to realize that the mathematical objects are not real, just as a model car is not a real car. Mathematical objects and their relations are essentially models of reality. And just as a model car cannot have all the features of a real car, mathematical models cannot have all the features of reality. This is exactly opposite to the philosophy of the Greeks, who believed that the Earth and everything in it was a working model of the pure mathematical objects. In other words, that the creation of the Earth was a mathematical exercise, that the Earth was merely an imperfect model of a real sphere. It is poignant that this philosophy is even prevalent today. Many people still believe that there must be absolute truths about the Universe, like those of one plus one equals two, and that someday, with enough resources and time, we will discover them. The eminent British mathematician and physicist Roger Penrose gives a brilliant refutation of this philosophy in his book “The Emperor’s New Mind”. A simple example of mathematical modeling is of the Earth as a sphere. That is good enough for many activities on the Earth’s surface, such as navigating over it. But a more accurate model would be a spheroid, i.e. a sphere slightly flattened into a disk shape. This model is necessary for “explaining” the small difference in the weight of objects at the poles compared to at the equator. However, even this model is crude when compared to the real Earth with all its surface variations due to mountains and oceans. The art of physics is then the art of creating mathematical models that simulate the relationships that we observe in the numbers of our measurements (that is, of course, the relationships that survive the test of statistical significance). When the model gives numbers that do not have the same relationships as those of our measurements then that model is inappropriate and must be modified, or perhaps even discarded and a new one started.
11
Something like the approach used in ordinary problem solving! But what is the purpose of playing with such mathematical models? There is certainly some satisfaction in playing with a model that works like the real thing, like that of children playing with toys or even adults playing with model trains. However, in the mathematical modeling involved in science, the mathematical model itself can be probed for features that cannot be observed in the real world. For example, modern mathematical models of the internal processes that heat the Sun are judged on the basis of how well they duplicate the observed temperature of the surface of the Sun. However, these same models can give numbers for the internal temperatures of the Sun, which could never be determined by direct observation. Another example of modern mathematical modeling is that of the physiological and neural processes involved in decoding speech. Such models are judged by their ability to simulate the mistakes of hearing impaired children when defects are deliberately introduced into the model. If and when successful models are developed than it might be possible to simulate features of the human neural network that are so deep within it that we could never see them by direct observation. Relevant material from Hecht Same as for Lecture 1
Physics 101A - Physics for the life sciences
12