Energies 2013, 6, 1632-1656; doi:10.3390/en6031632 OPEN ACCESS
energies ISSN 1996-1073 www.mdpi.com/journal/energies Article
Percolation Theory in Solid Oxide Fuel Cell Composite Electrodes with a Mixed Electronic and Ionic Conductor Daifen Chen 1,*, Huanhuan He 1, Donghui Zhang 1, Hanzhi Wang 1 and Meng Ni 2 1
2
School of Energy and Power Engineering, Jiangsu University of Science and Technology, Zhenjiang 212003, Jiangsu, China; E-Mails:
[email protected] (H.H.);
[email protected] (D.Z.);
[email protected] (H.W.) Building Energy Research Group, Department of Building and Real Estate, The Hong Kong Polytechnic University, Hung Hom, Kowloon, Hong Kong, China; E-Mail:
[email protected]
* Author to whom correspondence should be addressed; E-Mail:
[email protected]; Tel.: +86-511-8441-7398; Fax: +86-511-8440-4433. Received: 6 December 2012; in revised form: 26 February 2013 / Accepted: 6 March 2013 / Published: 11 March 2013
Abstract: Percolation theory is generalized to predict the effective properties of specific solid oxide fuel cell composite electrodes, which consist of a pure ion conducting material (e.g., YSZ or GDC) and a mixed electron and ion conducting material (e.g., LSCF, LSCM or CeO2). The investigated properties include the probabilities of an LSCF particle belonging to the electron and ion conducting paths, percolated three-phase-boundary electrochemical reaction sites, which are based on different assumptions, the exposed LSCF surface electrochemical reaction sites and the revised expressions for the inter-particle ionic conductivities among LSCF and YSZ materials. The effects of the microstructure parameters, such as the volume fraction of the LSCF material, the particle size distributions of both the LSCF and YSZ materials (i.e., the mean particle radii and the non-dimensional standard deviations, which represent the particle size distributions) and the porosity are studied. Finally, all of the calculated results are presented in non-dimensional forms to provide generality for practical application. Based on these results, the relevant properties can be easily evaluated, and the microstructure parameters and intrinsic properties of each material are specified. Keywords: solid oxide fuel cell; percolation theory; mixed electron and ion conductor; LSCF; coordination number; three-phase-boundary sites; electrochemically active sites
Energies 2013, 6
1633
Nomenclature aYSZ, YSZ f mat
L Lter YSZ M nkV nkS Pmat i
Pmat e
Pmat
pmatk
rmatk rmat
rk
rc rg
S ter
S YSZ V
S es, per
Z Zk Z k ,
Z mat , mat
surface area per contact between two YSZ particles probability density of the normal distribution particle size thickness of the composite cathode total thickness of the YSZ particle interfaces along the ion conducting path particle size types of the multi-component mixture number of k particles per unit volume within the entire composite electrode number of k particles per unit dense electrolyte surface probability of the mat particle belonging to the percolated cluster A probability of the mat particle belonging to the percolated ion conducting path probability of the mat particle belonging to the percolated electron conducting path normalized probability of the non-dimensional radius rmat / rmat radii of the different particle sizes with number index k mean radius of the mat phase material radius of the k particle neck radius between the contact particles hydraulic radius of the composite cathode structure geometric cross-sectional area of the composite cathode effective contact surface area among the YSZ particles per particle layer exposed surface sites of the percolated LSCF particles per unit volume average coordination number of all the particles average number of contacts between a k type particle and all of its neighboring particles number of contacts between the k particle and all of its neighboring particles average coordination number of all of the mat phase particles k
Greek Letters mat
g
k 0 mat k LSCF,YSZ
k ,ele
V TPB, per S
TPB, per
i, eff i,tra,eff
mat
inter-particle interface thickness standard deviation of the normal distribution particle size contact angle porosity of the composite electrode solid volume fraction of the k particles relative volume fraction of the matk particles in the whole mat phase material electrochemical reaction site per contact between LSCF and YSZ particles electrochemical reaction site per connect between a k particle and the dense electrolyte TPB electrochemical reaction site per unit volume TPB electrochemical reaction site per unit electrolyte surface area net ionic conductivity of the composite cathode effective intra-particle ion conductivity of mat phase material
i,ter,0 mat - mat intrinsic inter-particle ion conductivity at the mat- mat interfaces i,ter,eff mat -mat effective inter-particle ion conductivity at the mat- mat interfaces
Energies 2013, 6
1634
Subscript ~
non-dimensional item
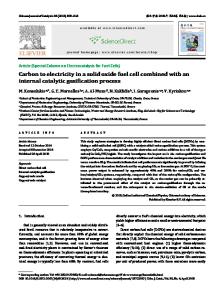
1. Introduction The planar solid oxide fuel cell (SOFC) is one of the promising power generation devices with many favorable properties, such as high electrical conversion efficiency, fuel flexibility, compactness, and low emission [1,2]. Figure 1 shows a typical planar SOFC unit with seven distinct layers: (a) interconnect at anode side for the fuel distribution and electric current collection, (b) the porous composite anode support, (c) the composite anode inter-layer, (d) the dense YSZ electrolyte, (e) the composite cathode inter-layer, (f) the porous cathode current collector and the interconnect at the cathode side for the air distribution and electric current collecting. Figure 1. The typical components of a planar solid oxide fuel cell.
Generally, the typical porous composite electrode is a mixture of the electrode-phase material (i.e., La1 xSrx Co1 y Fe y O3 (LSCF) or La1 xSrx MnO3 (LSM) for the cathode and Ni for the anode) and electrolyte-phase material (i.e., yttria-stabilized zirconia (YSZ)) [3,4]. A proper SOFC composite electrode may have, but is not limited to, the following characteristics: (i) a proper thermal expansion coefficient that matches the other components, (ii) a sufficient mechanical strength to support the cell, (iii) a percolated porous path for the reaction species to transport from the channel into the reaction sites. The term “percolated” is defined as the contiguous connection through the whole electrode structure, iv) a percolated electron conducting path (through Ni or LSCF particles) for the electrons to conduct from the reaction spots to the current collector, v) a percolated ion conducting path (through the YSZ or LSCF particles) for the ions to propagate from the dense electrolyte to the reaction spots, (vi) the reaction sites to support the electrochemical reaction. As the electrochemical reaction refers to electrons, ions and reaction species, it can only occur near the sites, where the electron conducting, ion conducting and porous phases coexist (i.e., Ni-YSZ-pore, LSCF-YSZ-pore, LSCF-pore), and each phase must belong to a percolated path, respectively. Conclusively, the composite electrode properties play an important role in the SOFC performance.
Energies 2013, 6
1635
In the past decades, parametric studies for the composite electrodes have been widely conducted by many researchers through experiments [5,6], random packing reconstruction methods [7–9] and percolation theory [10–12]: (i) the experimental methods rely primarily on the stereological methods [5,13,14]. Recently, the focused ion-beam scanning electron microscopy has been attempted to obtain the high resolution 3D image of a composite electrode [5,6]. All of them greatly enhance the understanding of the composite electrode microstructure and are helpful for developing the theoretical model in relating the microstructure to the electrode properties. Even so, the theoretical approaches are also necessary, because the experimental methods are still expensive and time consuming, and require hard-to-access facilities. The resolution of focused ion beam SEM is still a limiting factor, especially for electrodes of nano-particles; (ii) the random packing reconstruction methods are mainly based on the random packing of the spherical particles, in which a composite electrode is considered as a porous structure formed by randomly distributed spherical particles [7–9]; (iii) the percolation micro-models use the percolation theory and coordination number theory to represent the microstructure of a composite electrode developed by the random packing reconstruction methods [11]. The analytical expressions are derived to relate the electrode properties and the microstructure parameters [12,15]. Bouvard et al. [16] and Suzuki et al. [15] have proposed the empirical expression of coordination number to represent the microstructure of a binary random packing sphere structure. The theory is further developed by Costamagna et al. [12] to relate the coordination number and the effective properties. In our previous paper [11], the empirical expression of coordination number is revised to satisfy the important contact number conservation principle, and the percolation micro-model is further generalized to predict the effective properties of a composite electrode with 3-component random packed system for LSM-particles, coarse and fine YSZ-particles. Then, the percolation micro-model is further extended to predict the effective properties of the composite electrodes with a typical poly-disperse powder size distribution [17]. The effects of the pore former is further considered into the percolation theory by Bertei et al. [18]. Furthermore, the percolation micro-models are generally agreed and widely incorporated into the cell-level models to evaluate the effects of the electrode microstructure parameters on the SOFC performance [19–22]. To the best of our knowledge, most of the previous theory models that have been used to predict electrode properties were developed for a composite electrode that consists of a pure electron conducting material (e.g., Ni or LSM) and a pure ionic conducting material (e.g., YSZ). Mixed ion and electron conducting materials (e.g., LSCF or CeO2), which are promising composite cathode materials for intermediate temperature SOFCs, are receiving considerable attentions [23,24]. A composite cathode with a mixed electron and ion conducting conductor (e.g., LSCF, LSCM or CeO2) and pure an ion conductor (e.g., YSZ or GDC) has been found to exhibit great performance [23–28]. In this paper, percolation theory is further generalized to predict the effective properties of a composite electrode with a mixed electron and ion conductor. 2. Schematic Diagram of a Single Cell: LSCF + YSZ/YSZ/Ni + YSZ
Figure 2 shows a conceptual illustration of the microstructure of a typical single cell (LSCF + YSZ/YSZ/Ni + YSZ) and the physical processes within this cell. This single cell consists of three layers: (a) a porous Ni + YSZ anode layer with Ni and YSZ particles; (b) a dense YSZ electrolyte
Energies 2013, 6
1636
layer and (c) a porous LSCF+YSZ cathode layer with LSCF and YSZ particles. For the case with hydrogen as fuel and air as oxidation, the relevant anode and cathode reactions are H 2 O 2 H 2 O 2e and 0.5 O 2 2e O 2 , respectively. Obviously, the coexisting of the percolated gas transporting, electron conducting and ion conducting paths are essential to the electrochemical reaction. For the porous composite anode with Ni + YSZ, the electrochemical reaction sites mainly place around the gas + Ni + YSZ coexisting zone. For the porous composite cathode, however, the electrochemical reaction sites can place around both the gas + LSCF + YSZ coexisting zone and the LSCF particles surface exposing in air [29], because the LSCF-particles are mixed electron and ion conducting conductors. Figure 2. Illustration of the microstructure and physical processes within a single cell. Grey particles for Ni particles within composite anode, yellow particles represent YSZ particles while blue particles represent mixed ion and electron conducting LSCF particles within composite cathode.
On the anode side, fuel from a gas channel is transported through the porous structure to the anodic electrochemical reaction sites. For a composite anode that consists of Ni and YSZ, the electrochemical reaction sites are around the (gas-Ni-YSZ) three-phase boundaries (TPBs), at which the gas, Ni and YSZ particles coexist. At these sites, the fuel is oxidized by oxygen ions (O2−). The product H2O is transported back to the fuel channel through the porous anode structure, and an e− is conducted to the cathode side through the electron conducting path within the anode and through the external circuit to provide useful electric power. On the cathode side, air from a gas channel is transported through the gas path to the cathode electrochemical reaction sites [i.e., the (gas-LSCF-YSZ) TPB sites or the exposed LSCF surface sites]. At these sites, O2 reacts with the e− from the external circuit. The product O2− is then conducted to the anode electrochemical reaction sites through the ion conducting path within the cathode and the dense electrolyte. Both the YSZ and LSCF particles contribute to the ion conducting path within the cathode. 3. Percolation Theory for a Composite Electrode
Percolation theory can be considered as an extension application of the random packing reconstruction method and is sufficiently accurate in the prediction of electrode properties from the microstructure parameters. Typical percolation theory consists of two important parts [11]:
Energies 2013, 6
1637
(i) Coordination number theory: the coordination numbers of the particles are generally considered to be valid parameters that characterize the microstructure of a composite electrode. Generally, these numbers can be evaluated as a function of the specific material parameters, such as the volume composition of each particle type and the relevant particle size distribution. (ii) Micro-model: For a specific composite electrode, the effective electrode properties, such as the electric conductivity, mechanic stress, thermal expansion coefficient and electrochemical reaction sites should significantly rely on the coordination numbers, which represent the connecting condition among the particles within the composite electrode. The relation between these properties and the coordination numbers can be described by a specific expression in the micro-model. 3.1. Coordination Number Theory
The coordination number represents the number of contacts that a certain particle makes with its neighboring particles. Considering a multi-component mixture of randomly packed spherical particles with M types of particles, the average number of contacts between a k type particle and all of its neighboring particles is [11]: M
Z k Z k , ,
(1)
1
where Z k , is the number of contacts between the k particle and all of its neighboring particles. This expression can be estimated by [11]:
Z k , 0.5(1 rk2 / r2 ) Z
/ r M
k 1
k
/ rk
,
(2)
where rk is the radius of the k particle, k is the solid volume fraction of the k particles, and Z is the average coordination number of all of the particles, which is widely assumed to be 6 for random close packing of rigid spherical particles [10,12,30]. Equation (2) is considered a more reasonable expression for relating the coordination numbers and the microstructure parameters than the previous equation for estimating the coordination number [15]. Equation (2) satisfies the necessary contact number conservation principle [11]:
nkV Z k , nV Z ,k ,
(3)
where nkV is the number of k particles per unit volume within the entire composite electrode, which can be evaluated as a function of the solid volume fraction k , particle radius rk and porosity g : nkV
(1 g ) k 4 rk3 / 3
.
(4)
Contact number conservation means that the net contacts between the k and particles must be equal to the net contacts between the and k particles [11,12]. Furthermore, the validity of Equation (2) has been tested by comparing the calculated results with computer simulated results [11,15].
Energies 2013, 6
1638
3.2. Binary Mixture Properties
We first focus on the SOFC porous composite cathode that consists of two-component materials, studying the ion conducting particles of the electrolyte phase material (i.e., YSZ) and the mixed electron and ion conducting particles of the electrode phase material (i.e., LSCF). 3.2.1. Probability of Each Particle Belonging to the Percolated Ion and Electron Conducting Paths Figure 3 illustrates a two-component, randomly packed mixture of LSCF and YSZ particles. As described in the previous papers [11,12], there are three different cluster types of YSZ particles. Following the nomenclature of Costamagna et al.[12], these clusters can be characterized as follows: Type A clusters: The YSZ particles form a percolated cluster that extends throughout the entire thickness of the composite electrode (i.e., from the dense electrolyte to the electrode current collector). Type B clusters: The YSZ particles form a short network that is connected only to the dense electrolyte. Type C clusters: The YSZ particles form a completely isolated cluster.
Generally, the probability of a YSZ particle belonging to an A cluster can be evaluated using [31]: 3.7
PYSZ
4.236 Z YSZ, YSZ 1 , 2.472
(5)
where Z YSZ, YSZ is the average coordination number among the YSZ particles, which can be estimated from Equation (2). Figure 3. Microstructure of a two-component, randomly packed mixture of LSCF and YSZ particles.
The LSCF particles within the composite electrode can contribute to both the electron and ion conducting paths because the electrode-phase material LSCF is a mixed electron and ion conducting conductor. In this case, both the LSCF and YSZ particles contribute to the ion conducting path. Thus, the probability of a YSZ particle belonging to the percolated cluster “A” (labeled PYSZ ) is different i ). The ion from the probability of it belonging to the percolated ion conducting path (labeled as PYSZ conducting path is formed by the particles from different material types that have ion conducting capability. The percolated ion conducting path is a larger particle network than the percolated A cluster, which consists of only YSZ particles. Thus, the probabilities of the YSZ and LSCF particles
Energies 2013, 6
1639
belonging to the percolated electron and ion conducting paths within the composite cathode can be obtained from: i PYSZ 1 i PLSCF 1 e
PLSCF
4.236 Z LSCF, LSCF 1 2.472
, 3.7
(6)
i e and PLSCF are the probabilities of the LSCF particles belonging to the percolated ion and where PLSCF
i is the probability of the YSZ particles belonging to electron conducting paths, respectively, and PYSZ i is different from the percolated probability of the the percolated ion conducting path. Obviously, PLSCF e PLSCF because the LSCF particles are the particle belonging to the A cluster, PLSCF . However, PLSCF
only material that contributes to the electron conducting path. 3.2.2. Electrochemical Reaction Sites per Unit Volume Generally, the coexisting of the percolated electron conducting, ion conducting and gas transporting paths is essential to an electrochemical active reaction. Taking the cathode oxidant reaction 0.5 O 2 +2e O2 as an example, the oxygen should be transported from the gas channel to the reaction sites through the gas transporting path, e− can only be conducted through the electron conducting path and the product O2− should be conducted through the ion conducting path. To explain the electrochemical reaction sites of the LSCF + YSZ composite cathode, four different definitions are clarified as follows: Electrochemical reaction sites: The coexisting sites of the percolated electron conducting, ion conducting and gas-transporting paths. These sites are essential to the electrochemical active zone. For a composite cathode with LSCF and YSZ phase materials, the electrochemical reaction sites include the (LSCF-YSZ-pore) TPB sites and the LSCF surface sites. (LSCF-YSZ-pores) TPB sites: The areas around the coexisting sites of the percolated electrode material, electrolyte material and porous phases. In this case, the percolated LSCF and YSZ particle phases provide the electron and ion conducting paths, respectively. The porous phase provides the gas transporting path. It is necessary to note that the electrochemical reaction may occur near the TPB sites instead of exactly at the TPB sites because the global electrochemical reaction actually consists of multiple elementary reaction steps. LSCF surface sites: The percolated LSCF particle surfaces are exposed to air can also be electrochemical reaction sites due to the mixed electron and ion conducting characteristic of the LSCF particles. In this case, the percolated LSCF particle network can provide both electron and ion conducting paths for the electrochemical reaction. Electrochemical active zone: As illustrated in our previous paper [32], the electrochemical reaction sites are only potentially electrochemically active. The percentage of these sites that are electrochemically active depends on the ability of the ions to be transported from the dense electrolyte to the electrochemical reaction sites, the thickness of the composite electrode and the particular working conditions.
Energies 2013, 6
1640
Generally, the percolated TPB site per unit volume is proportional to the electrochemical reaction site per contact between LSCF and YSZ particles LSCF, YSZ , the number of contact points per unit V Z LSCF, YSZ and the probabilities of the relevant LSCF and YSZ particles belonging to the volume nLSCF electron and ion conducting paths: V V e i TPB , per LSCF,YSZ nLSCF Z LSCF, YSZ PLSCF PYSZ ,
(7)
where the number of LSCF particles per unit volume within the entire composite electrode structure can be estimated using Equation (4) [12,20]. It is generally accepted that the global reaction rate will be governed by many multiple elementary chemical steps and by the transport processes in the gas phase, in the solid bulk and on the surface, such as the adsorption/desorption/spillover and the charge transfer reactions [33]. There is some controversy regarding the actual pathway and nature of the electrochemical reaction sites [12]. Thus, there are different expressions for evaluating the electrochemical reaction site per contact between LSCF and YSZ particles LSCF, YSZ , which are based on different assumptions. Assumption 1: The cathode electrochemical reaction site per contact between LSCF and YSZ particles is assumed to exist at the two-phase intersection contact area [12,34]. As shown in Figure 4a, the 2D inter-particle contact area per contact between LSCF and YSZ particles can be estimated by:
LSCF, YSZ rc2 ,
(8a)
where rc is the neck radius, which depends on the smaller particle radius and on the contact angle , V rc min(rLSCF , rYSZ ) sin . In this case, the TPB electrochemical reaction site TPB, per in Equation (7) can be described as the percolated TPB area per unit volume in m−1. Assumption 2: Assuming that the reduction reaction of oxygen in the cathode will occur at the 1D circular length between contacting LSCF and YSZ particles, as shown in Figure 4b [11]:
LSCF, YSZ 2 rc
(8b)
In this case, the TPB electrochemical reaction site in Equation (7) is the TPB contact line among the electron conducting, ion conducting and pore phases, which can be described as the percolated TPB length per unit volume in m−2. Assumption 3: The oxygen reduction reaction is assumed to occur on the particle surfaces within a finite distance from the three phase contact lines [22]. In this case, the electrochemical reaction occurs on the spherical caps up to a width w from the intersection between LSCF and YSZ particles, as shown in Figure 4c:
w w 2 LSCF 2 rYSZ YSZ , cos YSZ cos rLSCF rYSZ
2 LSCF, YSZ 2 rLSCF cos LSCF cos
(8c)
where the contact angles satisfy the relation rLSCF sin LSCF rYSZ sin YSZ . Thus, the percolated TPB site in Equation (7) is the percolated TPB extended area per unit volume in m−1. Assumption 4: As illustrated in Figure 4d, the exposed LSCF particle surface site per unit volume is V proportional to the number of LSCF particles per unit volume nLSCF , the exposed surface area of each
Energies 2013, 6
1641
LSCF particle and the probabilities of the relevant LSCF particles belonging to the electron and ion conducting paths: V 2 V Ses, per 2 rLSCF nLSCF [2 (1 cos LSCF ) Z LSCF, LSCF e i (1 cos LSCF ) Z LSCF, YSZ ]PLSCF PLSCF
,
(9)
where the contact angles per contact between the rLSCF and r2 particles satisfy the relation rLSCF sin LSCF r2 sin 2 . The exposed surface area of each LSCF particle can be determined by subtracting the parts that overlap the neighboring particles from the spherical surface area. The unit of the exposed LSCF surface site should be m−1. Figure 4. Illustration of the four different assumptions of the electrochemical reaction sites: (a) the 2D contact area at the contact intersection, (b) the 1D circular length around the contact intersection, (c) the particle surfaces within a finite distance of the contact circular length and (d) the exposed surface area of each LSCF particle.
3.2.3. Electrochemical Reaction Sites at the Dense Electrolyte Surface The cathodic electrochemical reaction will occur not only within the composite cathode body but also at the interface of the composite cathode and the dense electrolyte [20]. The percolated electrochemical reaction site per unit electrolyte surface area can be estimated by: S S e TPB ,per LSCF,ele nLSCF PLSCF ,
(10)
where the number of LSCF particles per unit dense electrolyte surface is [11,20]: S nLSCF
(1 g ) LSCF 2 2 rLSCF /3
.
(11)
Based on “Assumptions 1 and 2” in Section 3.2.2, the electrochemical reaction site per connect between an LSCF particle and the dense electrolyte can be determined from:
Energies 2013, 6
1642 2 LSCF,ele rLSCF sin 2 LSCF ,
(12a)
LSCF,ele 2 rLSCF sin LSCF .
(12b)
S In these cases, there are different physical meanings of TPB ,per because of the different assumptions S of the percolated TPB sites: based on “Assumption 1”, TPB,per is the percolated TPB area per unit S dense electrolyte surface, which has a unit of 1, and, based on “Assumption 2”, TPB ,per is the −1 percolated TPB length per unit dense electrolyte surface in m .
3.2.4. The Effective Electric Conductivity Generally, the interfaces between the particles can have very different properties and compositions than the particle body (intra-particle) and can play an important role in the overall conductivity [10,11], especially at intermediate and low temperatures, The relatively low ion conductivity of ceramic conductors can be attribute to low ion conductivity at the particle interface [11]. Thus, the effective electronic (or ionic) conductivity through the composite cathode can be separated into the intra-particle i,tra,eff i,ter,eff conductivity mat and the inter-particle conductivity mat [10,11,35]. The intra-particle and mat inter-particle electric conductivities represent the charge transport capabilities through the particle interior and through the particle interface, respectively. As shown in Figure 3, it is reasonable to assume that the composite electrode structure is composed of particle layers that are connected in series [11]. In this case, the net ionic conductivity is determined by the intra-particle conductivity within the particle layer and the inter-particle conductivity at the particle layer interface added in series [10,36]. For a composite cathode that consists of the LSCF and YSZ materials, both the LSCF and YSZ particles will contribute to the ion conducting path. Thus, it is reasonable to assume that the ion intra-particle conductivities of LSCF and YSZ particles within the particle layer are connected in parallel and that there are three parallel paths that can conduct the ions i,ter,eff i,ter,eff through the particle layer interface (i.e., there are three inter-particle conductivities YSZ -YSZ , LSCF-LSCF i,ter,eff and LSCF -YSZ ):
1
i, eff
1 1 i,tra,eff i,tra,eff i,ter,eff i,ter,eff i,ter,eff , YSZ -YSZ LSCF-LSCF LSCF-YSZ YSZ LSCF
(13)
i,tra,eff where the effective ionic intra-particle conductivity mat , which is based on the geometry of the composite cathode, is primarily determined by the effective relative density of the percolated material and by the tortuosity of the conducting path [35].
3.2.5. Modified Expression for the Effective inter-Particle Conductivity Taking the YSZ particles as an example, the transport resistance that is due to the inter-particle ion conductivity among the YSZ particles can be expressed by: i,ter RYSZ
L i,ter,eff S YSZ -YSZ
Lter YSZ
ter i,ter,0 YSZ S YSZ -YSZ
,
(14)
Energies 2013, 6
1643
where S and L represent the geometric cross-sectional area and thickness of the composite cathode, i,ter,eff respectively. YSZ -YSZ is the effective inter-particle ion conductivity among the YSZ particles, which is i,ter,0 based on the geometry. YSZ -YSZ is the relevant intrinsic conductivity of the interfaces among the YSZ ter particles and LYSZ is the total thickness of the YSZ particle interfaces along the ion conducting path, which is the product of the number of particle layers L / rYSZ and the thickness of an individual particle interface [10,11]. Based on earlier literature, Chan et al. reported that the specific inter-particle −1 i,ter,0 conductivity of YSZ is YSZ at 800 °C [10] and that the inter-particle interface -YSZ = 0.05 Sm thickness is approximately 5 nm [37]. ter S YSZ is the effective contact surface area among the YSZ particles per particle layer and is proportional to the surface area per contact between two YSZ particles aYSZ, YSZ , the number of YSZ V particles within each particle layer (2rYSZ S )nYSZ , the coordination number among the YSZ particles i Z YSZ, YSZ and the relevant probability of the particle belonging to the percolated ion conducting path PYSZ : ter V S YSZ aYSZ, YSZ (2 rYSZ S )nYSZ
Z YSZ, YSZ 2
i PYSZ .
(15)
i,ter,eff The effective inter-particle ion conductivity YSZ -YSZ can thus be evaluated using [10,11]:
i,ter,eff YSZ-YSZ
i,ter,0 YSZ-YSZ
V i 2aYSZ, YSZ ( rYSZ )2 nYSZ Z YSZ, YSZ PYSZ
YSZ-YSZ
.
(16)
Similarly, the effective inter-particle ion conductivity among the LSCF particles can be estimated using:
i,ter,eff LSCF-LSCF
i,ter,0 LSCF-LSCF
V i 2aLSCF, LSCF ( rLSCF ) 2 nLSCF Z LSCF, LSCF PLSCF
LSCF-LSCF
.
(17)
Because both the LSCF and YSZ particles will contribute to the ion transporting process, there is an inter-particle ion conductivity at the interfaces between the LSCF and YSZ particles. Generally, there are two alternative methods for obtaining an expression for the effective inter-particle ion conductivity i,ter,eff i,ter,eff LSCF -YSZ : (i) the expression for the effective inter-particle ion conductivity LSCF-YSZ can be obtained based on the rLSCF particle layer, Equation (18a), and (ii) the effective inter-particle ion conductivity i,ter,eff YSZ -LSCF can be obtained based on the rYSZ particle layer, Equation (18b).
i,ter,eff i,ter,0 LSCF -YSZ LSCF-YSZ
i,ter,eff i,ter,0 YSZ -LSCF LSCF-YSZ
V i i 4aLSCF, YSZ ( rLSCF ) 2 nLSCF Z LSCF, YSZ PLSCF PYSZ
LSCF-YSZ V i i 4aYSZ, LSCF ( rYSZ ) 2 nYSZ Z YSZ, LSCF PLSCF PYSZ
LSCF-YSZ
,
(18a)
.
(18b)
V V Because aLSCF, YSZ aYSZ, LSCF and nLSCF Z LSCF, YSZ nYSZ Z YSZ, LSCF , it appears that Equations (18a) and i,ter,eff i,ter,eff (18b) do not satisfy the conservation principle LSCF-YSZ YSZ -LSCF when rLSCF rYSZ . To obtain a i,ter,eff reasonable expression for the inter-particle ion conductivity LSCF-YSZ , the two different calculating methods are illustrated and compared in Figure 5. Taking the case rLSCF rYSZ as an example, we obtain the following. (i) Figures 5a,b show the LSCF and YSZ particle contact interface distribution within the small rLSCF particle layer. As observed from the figure, the ion that is conducted through the interface between the LSCF and YSZ particles can be directly conducted to the next rLSCF particle
Energies 2013, 6
1644
layer. (ii) Figure 5(c) shows the LSCF and YSZ particle contact interface distribution within the large rYSZ particle layer. Obviously, the ion that is conducted through the LSCF and YSZ particle interface needs to be further transported through the other LSCF particles and LSCF particle interfaces before it i,ter,eff can be conducted to the next YSZ particle layer. In this case, LSCF -YSZ in Equation (18b) is considered to be greatly overestimated, i.e., Equation (18b) should also consider the effects of the interfaces among the small LSCF particles that are within the large YSZ particle layer. Figure 5. Comparison of the two different calculating methods used to obtain the inter-particle ion conductivity among the LSCF and YSZ particles when rLSCF rYSZ :
(a,b) the smaller particle layer is used to obtain the expression and (c) the larger particle layer is used to obtain the expression.
Thus, a reasonable expression for the inter-particle ion conductivity among the LSCF and YSZ particles is:
LSCF-YSZ i,ter,eff
i,ter,0 LSCF-YSZ
V i i 4aLSCF, YSZ min( rLSCF , rYSZ ) 2 nLSCF Z LSCF, YSZ PLSCF PYSZ
LSCF-YSZ
,
(18)
where the inter-particle conductivity expression should be obtained based on the smaller particle layer [i.e., on min(rLSCF , rYSZ ) ]. For the electronic conductivity within the composite cathode, the electronic inter-particle conductivity is essentially negligible compared with the intra-particle conductivity. Furthermore, because the LSCF particles within the cathode are the only material that contributes to the electron conducting path, the effective electronic conductivity that is based on the geometry would equal the effective electronic intra-particle conductivity of the LSCF particles network. 3.2.6. The Hydraulic Radius of the Porous Cathode Structure The hydraulic radius of the porous composite cathode structure is used mainly to describe the flow in a non-circular tube and is an essential parameter for modeling the multi-component porous media gas transport with the dusty-gas model [38]. This radius can be calculated using [11]: 1
2 g LSCF YSZ rg . 3 (1 g ) rLSCF rYSZ
(19)
3.3. LSCF + YSZ Composite Cathode with Poly-Dispersed Particle Sizes Because ceramic powders are typically poly-dispersed, the normal distributions are used to represent the particle size distributions of both the LSCF phase and YSZ phase materials [17]. For a
Energies 2013, 6
1645
specific material phase mat, such as LSCF or YSZ, the probability density function of the normal distribution particle size with a specified mean radius rmat and a standard deviation mat is given by: f mat
1
mat
(rmat rmat ) 2 k , exp 2 2 2 mat
(20)
where k is the number index and rmatk represents the radii of the different particle sizes. Generally, the particle size distribution range will be equally discretized into nine parts. The relevant non-dimensional radii of all nine types of particle sizes rmatk / rmat and their normalized probabilities pmatk are listed in Table 1 [17]. Based on Table 1, the particle radius of each type of particle size rmatk and the relative volume fraction of the matk particles in the whole mat phase material can be estimated using: rmatk
rmatk rmat
rmat
,
0 matk
3 pmatk rmat k 9
p 1
,
(21)
3 mat mat
r
where mat mat / rmat is the non-dimensional standard deviation and mat denotes the total volume fraction of the mat phase material. The volume fraction of the rmatk particles can be estimated by: 0 matk mat mat . k
(22)
There are two parameters that are needed to describe the particle size distribution of each material [17]. One parameter is the mean particle radius rmat of the mat material. The other parameter is the relevant standard deviation (or the non-dimensional standard deviation / r ), which represents mat
mat
mat
mat
the distribution of the particle sizes. Table 1. The non-dimensional radii of nine type particle sizes and the relevant normalized probabilities. Type rmatk rmat
pmatk
1 1
2
3
4
8 2 6 2 4 2 2 2 mat 1 mat 1 mat 1 mat 9 9 9 9
6.77%
9.53%
12.2%
5 1
6 1
7
8
9
2 2 4 2 6 2 8 2 mat 1 mat 1 mat 1 mat 9 9 9 9
14.1% 14.8% 14.1%
12.2%
9.53%
6.77%
For a composite cathode that consists of LSCF and YSZ ceramic powders, because the particle sizes are typically poly-dispersed, the probabilities of the material phase belonging to the percolated electron or ion conducting paths can be estimated by: i PYSZ 1 i PLSCF 1 e
PLSCF
4.236 Z LSCF, LSCF 1 2.472
. 3.7
(23)
The probabilities of the YSZ and LSCF particles belonging to the ion conducting path are 1 because both the YSZ and LSCF materials can contribute to the ion conducting path within the composite
Energies 2013, 6
1646
cathode. Because LSCF is the only material that contributes to the electron conducting path, e PLSCF PLSCF . The percolated probability of an LSCF particle belonging to the A clusters relies not only on the coordination numbers among the same-sized LSCFk particles, Z LSCFk , LSCFk but also on the mutual coordination numbers between the LSCFk particles and their neighboring LSCF particles, e Z LSCFk , LSCF ( k ). Thus, PLSCFk can be described by a function of the average coordination number of all of the LSCF particles [11,39]: 9
Z LSCF, LSCF
9
n k 1 1
V LSCFk
9
Z LSCF
k , YSZ
n k 1
.
(24)
V LSCFk
In our previous paper [17], the validity of Equations (20–23) were carefully checked by comparing the calculated results with computer simulation results that were obtained using the random packing reconstruction model [9]. The percolated TPB electrochemical reaction site can thus be estimated using: 9
9
V V e i TPB ,per LSCFk ,YSZ nLSCFk Z LSCFk , YSZ PLSCF PYSZ .
(25)
k 1 1
As illustrated in Section 3.2.2, there are different physical meanings of TPB,per with regard to the different assumptions of the electrochemical reaction site per contact between the LSCF and YSZ V particles: (i) for “Assumption 1”, TPB,per is the percolated TPB area per unit volume in m−1, (ii) for V “Assumption 2”, TPB,per is the percolated TPB length per unit volume in m−2 and, (iii) for V “Assumption 3”, TPB,per is the percolated TPB extended area per unit volume in m−1. The exposed LSCF particle surface electrochemical reaction site per unit volume can be evaluated by subtracting the parts that overlap the neighboring particles from the LSCF spherical surface area: V
9
9
V 2 V Ses, per 2 rLSCFk nLSCFk [2 (1 cos LSCFk ) Z LSCFk , LSCF k 1
1
9
(1 cos LSCFk ) Z LSCFk , YSZ ]PLSCF PLSCF e
,
(26)
i
1
where the contact angle per contact between the rLSCF k and r2 particles satisfy the relation rLSCF k sin LSCF k r2 sin 2 . The unit of the exposed LSCF surface sites is m−1. Analogously, the percolated TPB electrochemical reaction sites at the interface between the dense electrolyte and the composite cathode can be estimated by: 9
S S e TPB ,per LSCFk ,ele nLSCFk PLSCF .
k 1
(27)
For a composite LSCF + YSZ cathode with poly-dispersed particle sizes, the effective inter-particle ion conductivities among the (LSCF and LSCF), (YSZ and YSZ) and (LSCF and YSZ) particles can be represented by:
Energies 2013, 6
1647 9
9
YSZ-YSZ YSZ-YSZ i,ter,eff
i,ter,0
V 2aYSZk ,YSZ min( rYSZk , rYSZ ) 2 nYSZ Z Pi k YSZk ,YSZ YSZ
YSZ-YSZ
k 1 1 9
9
LSCF-LSCF LSCF-LSCF i,ter,eff
i,ter,0
V 2aLSCFk ,LSCF min( rLSCFk , rLSCF ) 2 nLSCF Z Pi k LSCFk ,LSCF LSCF
LSCF-LSCF
k 1 1
9
9
LSCF-YSZ LSCF-YSZ i,ter,eff
i,ter,0
4aLSCF
k ,YSZ
k 1 1
V min( rLSCFk , rYSZ ) 2 nLSCF Z Pi Pi k LSCFk ,YSZ LSCF YSZ
LSCF-YSZ
,
(28a)
,
(28b)
.
(28c)
The mean hydraulic radius of the porous structure of the LSCF+YSZ composite cathode can be estimated by: 9 2 g 9 LSCFk YSZ rg 3 (1 g ) k 1 rLSCFk 1 rYSZ
1
.
(29)
4. Results and Discussion
To illustrate the application of the extended percolation theory to the composite electrode that consists of a pure ion conducting material (e.g., the YSZ or GDC) and a mixed electron and ion conducting material (e.g., LSCF, LSCM or CeO2), the effects of the microstructure parameters on the effective properties of the composite cathode are investigated. Equations (1–19) can be used to predict the effective properties of the composite electrode using the mono-particle size distribution of each type of material. Equations (20–29) can be used to predict the effective properties of the composite electrode using the poly-dispersed particle sizes. To provide a general form of the extended percolation theory, all of the calculated properties will be presented in non-dimensional forms. Once the microstructure parameters are specified, the relevant properties can be easily extracted from the calculated results in this paper. V As described in Equation (25), there are three different physical meanings of TPB,per depending on the three different assumptions regarding the electrochemical reaction site per contact between the LSCF and YSZ particles. In this paper, “Assumption 2” will be used to represent the TPB electrochemical V reaction sites. In this case, the percolated TPB electrochemical reaction site per unit volume TPB, per can be described by the percolated TPB length per unit volume in m−2. The percolated TPB electrochemical reaction sites for “Assumptions 1 and 3” can also be obtained using a similar approach. V As described in Equation (25), the percolated TPB length TPB, per is a function of the 1D perimeter V per contact between LSCFk and YSZ particle LSCFk ,YSZ , the contact points per unit volume nLSCFk , the e i coordination number Z LSCFk ,YSZ and the probabilities PLSCFk and PYSZ . As shown in Equations (2) e i and (23), Z LSCFk ,YSZ , PLSCFk and PYSZ are functions of the volume fraction LSCF , the average particle radii ratio rYSZ / rLSCF and the non-dimensional standard deviations LSCF and YSZ , which represent the particle size distributions. By combining Equations (4), (8b) and (23), the non-dimensional form of the V percolated TPB length per unit volume TPB, per can be written as: V TPB , per
V TPB , per . 2 (1 g ) sin / rLSCF
(30)
Energies 2013, 6
1648
V Although the non-dimensional percolated TPB length per unit volume TPB, per is independent of the particular particle radii (i.e., rLSCF and rYSZ ) and the porosity g , it is a function of the non-dimensional standard deviations LSCF and YSZ , the volume fraction of the LSCF material LSCF and the mean particle radii ratio ( rYSZ / rLSCF ). V Figure 6 shows how TPB , per depends on the volume fraction LSCF , the mean radius ratio rYSZ / rLSCF and the non-dimensional standard deviations LSCF and YSZ , which represent the particle size distributions of the LSCF and YSZ materials within the composite cathode. As observed from the V figure, TPB,per ~ LSCF ; the label ( rYSZ / rLSCF , LSCF , YSZ ) = (1, 0, 0) indicates that the mean particle radii and the mono-particle size distributions of the LSCF and YSZ materials are equal. In this case, the V maximum TPB, per will be obtained when LSCF 0.55 . The volume fraction loading LSCF should be chosen to fall within the range of 0.3 to 1 during the composite electrode fabrication process. Under this constraint, both percolated electron and ion conducting paths can be formed throughout the whole cathode structure. Because both the YSZ and LSCF particles are ionic conductors, the percolated ion conducting path can be formed at any volume fraction loading. Thus, satisfying the volume fraction constraint is essential to forming the percolated electron conducting path throughout the whole composite electrode. V When larger YSZ particles are used (e.g., when rYSZ / rLSCF = 2.5), the TPB ,per ~ LSCF relation curve V will shift from (1, 0, 0) to (2.5, 0, 0). It is evident that the volume fraction LSCF for maximal TPB, per will change from 0.55 to 0.39. V The effect of a wider particle distribution on TPB , per is also studied. The non-dimensional standard deviations LSCF and YSZ are used to describe the particle size distributions of the LSCF and YSZ materials, respectively. For the composite electrodes that consist of border size distributions for both the LSCF and YSZ materials (i.e., YSZ LSCF =0.6) instead of the mono-particle sizes for each type of V material (i.e., YSZ LSCF = 0), the TPB, per ~ LSCF curves will shift from (1, 0, 0) and (2.5, 0, 0) to V (1, 0.6, 0.6) and (2.5, 0.6, 0.6). The calculated results indicate that the maximum TPB, per significantly decreases with increasing particle size distribution. V Figure 6. The non-dimensional percolated TPB length TPB, per as a function of LSCF , rYSZ / rLSCF , the non-dimensional standard deviations LSCF and YSZ .
Energies 2013, 6
1649
V Taking the rYSZ / rLSCF = 1 case as an example, the maximum TPB, per for the particle size distributions V YSZ LSCF = 0.6 is 42% lower than the TPB, per for the mono-particle size distributions (i.e., V YSZ LSCF = 0). Similarly, the maximum TPB , per decreases 34% when the microstructure parameters change from (2.5, 0, 0) to (2.5, 0.6, 0.6). V It is necessary to note that, although the non-dimensional TPB, per is independent of the practical particle radius (i.e., the mean particle size of the LSCF material rLSCF ) and the porosity, the physical V percolated TPB length per unit electrode volume TPB , per is actually determined by the particular microstructure parameters. As an example, consider a composite cathode in which the volume fraction loading is LSCF = 0.42, the mean particle radii of the LSCF and YSZ materials are rYSZ = 200 nm and V rYSZ = 40 nm and YSZ LSCF = 0.6. Figure 6 can be used to calculate TPB, per , which is approximately 9.3 × 10¹³ m−2 when the contact angle 29.50 and the porosity g = 40%. Therefore, the curves for the non-dimensional properties are very general for practical applications, and the relevant effective properties can be easily extracted when the physical parameters of the microstructure are specified. The percolated LSCF particle surface that is exposed to air is considered another important part of the electrochemical reaction sites. Based on Equation (26), the non-dimensional LSCF particle surface V electrochemical reaction site per unit volume Ses, per can be written as:
V Ses, per
V Ses, per . (1 g ) / rLSCF
(31)
The non-dimensional variable Ses, per is a function of LSCF , rYSZ / rLSCF , LSCF , YSZ and . Figure 7 V shows the effects of many of the microstructure parameters on Ses, per for 29.5o . As observed from V the figure, the non-dimensional Ses, per will increase with increasing LSCF volume fraction LSCF , and V Ses, per appears to be insensitive to the particle size ratio rYSZ / rLSCF . For a specific rYSZ , extending the particle size distribution slightly decreases the percolated LSCF surface electrochemical reaction sites. V Although the non-dimensional Ses, per is independent of the practical particle radius and the porosity, V the physical Ses, per will actually increase with decreasing mean particle size of the LSCF material rLSCF . V
Figure 7. The non-dimensional LSCF particle surface electrochemical reaction site per unit V volume Ses, per as a function of LSCF , rYSZ / rLSCF , the non-dimensional standard deviations LSCF and YSZ for 29.50 .
Energies 2013, 6
1650
As reported in our previous paper [32], the percolated TPB length per unit surface area at the S interface between the dense electrolyte and the composite electrode TPB, per will have an important effect on the electrochemical charge transfer process. Based on Equation (27), the non-dimensional S TPB , per can be estimated by:
S
TPB, per
S TPB , per . (1 g ) sin / rLSCF
(32)
S Figure 8 shows the non-dimensional percolated TPB area per unit electrolyte surface area TPB, per as S a function of LSCF , rYSZ / rLSCF , LSCF and YSZ . As observed from the figure, TPB, per increases with S increasing LSCF and rYSZ / rLSCF . When LSCF = 1, the maximum TPB, per can be achieved. In this case, the composite electrode is only composed of the single material LSCF. The percolated TPB length per unit surface area at the interface between the dense electrolyte and the composite electrode will play a prominent role in the electrochemical reaction process that occurs within the SOFC.
V Figure 8. Dependence of the non-dimensional percolated TPB length TPB,per on LSCF ,
rYSZ / rLSCF , LSCF and YSZ .
As described in Equation (13), the net ionic conductivity is determined by the intra-particle conductivity and the inter-particle conductivity at the particle layer interface added in series [10,36], and there are three parallel paths that can conduct the ions through the particle layer interface. Based on Equations (28a–c), the effective inter-particle ionic conductivities among the (YSZ and YSZ), (LSCF and LSCF) and (LSCF and YSZ) particles can be normalized using the mean radius of the LSCF particles:
i,ter,eff YSZ-YSZ
i,ter,eff YSZ -YSZ i,ter,0 , YSZ-YSZ rLSCF sin 2 (1 g ) / YSZ-YSZ
i,ter,eff LSCF -LSCF
i,ter,eff LSCF -YSZ
(33a)
i,ter,eff LSCF -LSCF , i,ter,0 2 LSCF-LSCF rLSCF sin (1 g ) / LSCF-LSCF
(33b)
i,ter,eff LSCF -YSZ . i,ter,0 2 LSCF-YSZ rLSCF sin (1 g ) / LSCF-YSZ
(33c)
Energies 2013, 6
1651
Figure 9 shows the effects of LSCF , rYSZ / rLSCF , LSCF and YSZ on the non-dimensional effective i,ter,eff inter-particle ionic conductivity among the YSZ particles YSZ -YSZ . The calculated results show that i,ter,eff YSZ-YSZ increases with decreasing LSCF and attains a maximum value when LSCF = 0. As rYSZ / rLSCF i,ter,eff i,ter,eff increases from 1 to 2.5, the YSZ curve will shift from (1, 0, 0) to (2.5, 0, 0). A larger YSZ -YSZ -YSZ ~ LSCF can be obtained by using broader particle size distribution materials (i.e., YSZ LSCF = 0.6) instead of mono-particle size distribution materials. Figure 9. The effect of LSCF , rYSZ / rLSCF , LSCF and YSZ on the effective non-dimensional i,ter,eff inter-particle ionic conductivity YSZ -YSZ .
Because the LSCF particles are mixed electronic and ionic conductors, they will also contribute to i,ter,eff the ion conducting path. Figure 10 shows LSCF -LSCF as a function of LSCF , rYSZ / rLSCF , LSCF and YSZ . i,ter,eff LSCF -LSCF can be increased by increasing LSCF , and there are weak effects from rYSZ / rLSCF , LSCF and i,ter,eff YSZ . Although the non-dimensional LSCF-LSCF is independent of the practical particle radius, the i,ter,eff dependence of the actual physical LSCF -LSCF on the mean particle size of the LSCF material rLSCF can be i,ter,eff obtained using Equation (33b), and LSCF-LSCF increases as rLSCF increases. i,ter,eff Figure 10. The effective non-dimensional inter-particle ionic conductivity LSCF-LSCF as a
function of LSCF , rYSZ / rLSCF , LSCF and YSZ .
Energies 2013, 6
1652
Figure 11 shows the dependence of the effective non-dimensional inter-particle ionic conductivity i,ter,eff on LSCF , rYSZ / rLSCF , LSCF and YSZ . As shown in the figure, the non-dimensional LSCF-YSZ i,ter,eff increases with increasing LSCF volume loading until it reaches a maximum value. LSCF -YSZ then decreases with increasing LSCF volume fraction. For a composite electrode with only one type of i,ter,eff i,ter,eff ionic conducting material (i.e., LSCF = 0 or 1), LSCF -YSZ =0. For rYSZ / rLSCF = 1, the maximum LSCF-YSZ is i,ter,eff attained when LSCF = 0.5. The LSCF value for the maximum LSCF -YSZ will shift to a lower value when i,ter,eff rYSZ / rLSCF is increased from 1 to 2.5. Furthermore, for the specific volume fraction LSCF = 0.5, LSCF -YSZ decreases with increasing rYSZ / rLSCF , LSCF and YSZ . i,ter,eff LSCF-YSZ
Figure 11. Dependence of the effective non-dimensional inter-particle ionic conductivity i,ter,eff LSCF -YSZ on LSCF , rYSZ / rLSCF , LSCF and YSZ .
In conclusion, when the microstructure parameters (i.e., the volume fraction LSCF and the particle size distributions rLSCF , rYSZ , LSCF and YSZ ) and the intrinsic inter-particle ionic conductivities at the i,ter,0 i,ter,0 i,ter,0 interfaces (i.e., YSZ -YSZ , LSCF-LSCF and LSCF-YSZ ) are specified, Figures 7–9 can be used to calculate the i,ter,eff i,ter,eff i,ter,eff physical YSZ -YSZ , LSCF-LSCF and LSCF-YSZ . Combining these values with the intra-particle ionic conductivity of the LSCF and YSZ materials, the physical effective net ion conductivity that is based on the composite electrode geometry can be obtained. The non-dimensional hydraulic radius of the porous electrode can be estimated by: rg
rg rLSCF /(1 g )
.
(34)
Figure 12 shows the dependence of rg on LSCF , rYSZ / rLSCF , LSCF and YSZ . Obviously, for a composite electrode that consists of LSCF and YSZ materials with similar mean particle radii and particle size distributions, rg is independent on the volume fraction LSCF . The calculated results show that rYSZ / rLSCF has a strong effect on rg . A larger rg can be obtained by extending the particle size distributions or by increasing rYSZ / rLSCF .
Energies 2013, 6
1653
Figure 12. The non-dimensional hydraulic radius rg as a function of LSCF , rYSZ / rLSCF , LSCF and YSZ .
5. Conclusions
Percolation theory is extended to predict the effects of the microstructure parameters, such as the volume fraction of an LSCF material, particle size distributions of LSCF and YSZ materials (i.e., the mean particle radii and the non-dimensional standard deviations of the particle size distribution) and the porosity, on the effective properties of a specific composite electrode, which consists of a pure ion conducting material and a mixed electron and ion conducting material. Because the mixed electron and ion conducting material (i.e., LSCF) contributes to both the electron and ion conducting paths within the composite electrode, there are different physical meanings for the probabilities of the LSCF particles belonging to the A cluster and to the percolated electron and ion conducting paths. These probabilities can have significant effects on the electrode properties. For a composite electrode that consists of LSCF and YSZ materials, the electrochemical reaction sites include the percolated (LSCF-YSZ-pore) three-phase boundary sites and the percolated LSCF surface sites that are exposed to air (Figure 4). Different physical meanings can be obtained for the percolated TPB sites using three different assumptions regarding the electrochemical reaction site per contact between the LSCF and YSZ particles. It is reasonable to assume that the composite electrode structure consists of particle layers that are connected in series. Thus, the net ionic conductivity is the result of the intra- and inter-particle conductivities added in series. For an LSCF + YSZ composite cathode with a poly-dispersed particle size distribution, there are three parallel paths that can conduct the ions through the particle layer i,ter,eff i,ter,eff i,ter,eff interface (i.e., there are three inter-particle conductivities YSZ-YSZ , LSCF-LSCF and LSCF-YSZ ). A reasonable modified expression of the inter-particle ion conductivity is obtained by comparing two different calculation methods in detail. Finally, all of the calculated results are presented in non-dimensional forms to provide generality for practical application.
Energies 2013, 6
1654
Acknowledgments
We gratefully acknowledge the financial support of the National Science Foundation of China (21106058 and 11204107), the China National Petroleum Corporation (OG 11080101), the Jiangsu University of Science and Technology (35011005), and the Hong Kong Research Grant Council (PolyU5238/11E). References
1. 2.
3. 4.
5.
6.
7. 8. 9.
10. 11. 12. 13.
Yokoo, M.; Tabata, Y.; Yoshida, Y.; Hayashi, K.; Nozaki, Y.; Nozawa, K.; Arai, H. Restoration of solid oxide fuel cell stacks after failure of partial cells. J. Power Sources 2009, 190, 252–257. Marquez, A.I.; Ohrn, T.R.; Trembly, J.P.; Ingram, D.C.; Bayless, D.J. Effects of coal syngas and H2S on the performance of solid oxide fuel cells: Part 2. Stack tests. J. Power Sources 2007, 164, 659–667. Zhao, F.; Virkar, A.V. Dependence of polarization in anode-supported solid oxide fuel cells on various cell parameters. J. Power Sources 2005, 141, 79–95. Chen, J.; Liang, F.; Yan, D.; Pu, J.; Chi, B.; Jiang, S.P.; Jian, L. Performance of large-scale anode-supported solid oxide fuel cells with impregnated La0.6Sr0.4Co0.2Fe0.8O3−δ + Y2O3 stabilized ZrO2 composite cathodes. J. Power Sources 2010, 195, 5201–5205. Iwai, H.; Shikazono, N.; Matsui, T.; Teshima, H.; Kishimoto, M.; Kishida, R.; Hayashi, D.; Matsuzaki, K.; Kanno, D.; Saito, M.; et al. Quantification of SOFC anode microstructure based on dual beam FIB-SEM technique. J. Power Sources 2010, 195, 955–961. Wilson, J.R.; Kobsiriphat, W.; Mendoza, R.; Chen, H.Y.; Hiller, J.M.; Miller, D.J.; Thornton, K.; Voorhees, P.W.; Adler, S.B.; Barnett, S.A. Three-dimensional reconstruction of a solid-oxide fuel-cell anode. Nat. Mater. 2006, 5, 541–544. Schneider, L.C.R.; Martin, C.L.; Bultel, Y.; Dessemond, L.; Bouvard, D. Percolation effects in functionally graded SOFC electrodes. Electrochim. Acta 2007, 52, 3190–3198. Ali, A.; Wen, X.; Nandakumar, K.; Luo, B.J.; Chuang, K.T. Geometrical modeling of microstructure of solid oxide fuel cell composite electrodes. J. Power Sources 2008, 185, 961–966. Kenney, B.; Valdmanis, M.; Baker, C.; Pharoah, J.G.; Karan, K. Computation of TPB length, surface area and pore size from numerical reconstruction of composite solid oxide fuel cell electrodes. J. Power Sources 2009, 189, 1051–1059. Chan, S.H.; Chen, X.J.; Khor, K.A. Cathode micromodel of solid oxide fuel cell. J. Electrochem. Soc. 2004, 151, A164–A172. Chen, D.; Lin, Z.; Zhu, H.; Kee, R.J. Percolation theory to predict effective properties of solid oxide fuel-cell composite electrodes. J. Power Sources 2009, 191, 240–252. Costamagna, P.; Costa, P.; Antonucci, V. Micro-modelling of solid oxide fuel cell electrodes. Electrochim. Acta 1998, 43, 375–394. Yoon, J.; Araujo, R.; Grunbaum, N.; Baque, L.; Serquis, A.; Caneiro, A.; Zhang, X.H.; Wang, H.Y. Nanostructured cathode thin films with vertically-aligned nanopores for thin film SOFC and their characteristics. Appl. Surf. Sci. 2007, 254, 266–269.
Energies 2013, 6
1655
14. Song, H.S.; Lee, S.; Hyun, S.H.; Kim, J.; Moon, J. Compositional influence of LSM-YSZ composite cathodes on improved performance and durability of solid oxide fuel cells. J. Power Sources 2009, 187, 25–31. 15. Suzuki, M.; Oshima, T. Estimation of the co-ordination number in a multi-component mixture of spheres. Powder Technol. 1983, 35, 159–166. 16. Bouvard, D.; Lange, F.F. Relation between percolation and particle coordination in binary powder mixtures. Acta Metall. Mater. 1991, 39, 3083–3090. 17. Chen, D.; Lu, L.; Li, J.; Yu, Z.; Kong, W.; Zhu, H. Percolation micro-model to predict the effective properties of the composite electrode with poly-dispersed particle sizes. J. Power Sources 2011, 196, 3178–3185. 18. Bertei, A.; Nicolella, C. Percolation theory in SOFC composite electrodes: Effects of porosity and particle size distribution on effective properties. J. Power Sources 2011, 196, 9429–9436. 19. Hussain, M.M.; Li, X.; Dincer, I. A numerical investigation of modeling an SOFC electrode as two finite layers. Int. J. Hydrogen Energy 2009, 34, 3134–3144. 20. Jeon, D.H.; Nam, J.H.; Kim, C.J. Microstructural optimization of anode-supported solid oxide fuel cells by a comprehensive microscale model. J. Electrochem. Soc. 2006, 153, A406–A417. 21. Zhu, H.Y.; Kee, R.J. Modeling distributed charge-transfer processes in SOFC membrane electrode assemblies. J. Electrochem. Soc. 2008, 155, B715–B729. 22. Völker, B.; McMeeking, R.M. Impact of particle size ratio and volume fraction on effective material parameters and performance in solid oxide fuel cell electrodes. J. Power Sources 2012, 215, 199–215. 23. Zhang, C.; Grass, M.; McDaniel, A.; DeCaluwe, S.; El Gabaly, F.; Liu, Z.; McCarty, K.; Farrow, R.; Linne, M.; Hussain, Z. Measuring fundamental properties in operating solid oxide electrochemical cells by using in situ X-ray photoelectron spectroscopy. Nat. Mater. 2010, 9, 944–949. 24. Yang, L.; Wang, S.; Blinn, K.; Liu, M.; Liu, Z.; Cheng, Z. Enhanced Sulfur and Coking Tolerance of a Mixed Ion Conductor for SOFCs: BaZr0.1Ce0.7Y0.2−xYbxO3−δ. Science 2009, 326, 126–129. 25. Ye, X.-F.; Wang, S.R.; Wang, Z.R.; Hu, Q.; Sun, X.F.; Wen, T.L.; Wen, Z.Y. Use of La0.75Sr0.25Cr0.5Mn0.5O3 materials in composite anodes for direct ethanol solid oxide fuel cells. J. Power Sources 2008, 183, 512–517. 26. Chen, J.; Liang, F.; Yan, D.; Pu, J.; Chi, B.; Jiang, S.P.; Jian, L. Performance of large-scale anode-supported solid oxide fuel cells with impregnated La0.6Sr0.4Co0.2Fe0.8O3−δ + Y2O3 stabilized ZrO2 composite cathodes. J. Power Sources 2010, 195, 5201–5205. 27. Ruiz-Morales, J.C.; Canales-Vazquez, J.; Marrero-Lopez, D.; Irvine, J.T.S.; Nunez, P. Improvement of the electrochemical properties of novel solid oxide fuel cell anodes, La0.75Sr0.25Cr0.5Mn0.5O3−δ and La4Sr8Ti11Mn0.5Ga0.5O37.5−δ, using Cu-YSZ-based cermets. Electrochim. Acta 2007, 52, 7217–7225. 28. Lu, L.; Chen, D.; Zhao, G.; Ren, X.; Guo, G. Temperature and Excitation wavelength dependence of surface-plasmon-mediated emission from CdSe nanocrystals. J. Phys. Chem. C 2010, 114, 18435–18438. 29. Kee, R.J.; Zhu, H.; and Goodwin, D.G. Modeling electrochemistry and solid-oxide fuel cells: II. Research challenges. J. Combust. Soc. Jpn. 2005, 47, 276–289.
Energies 2013, 6
1656
30. Suzuki, M.; Oshima, T. Co-ordination number of a multi-component randomly packed bed of spheres with size distribution. Powder Technol. 1985, 44, 213–218. 31. Bertei, A.; Nicolella, C. A comparative study and an extended theory of percolation for random packings of rigid spheres. Powder Technol. 2011, 213, 100–108. 32. Chen, D.; Bi, W.; Kong, W.; Lin, Z. Combined micro-scale and macro-scale modeling of the composite electrode of a solid oxide fuel cell. J. Power Sources 2010, 195, 6598–6610. 33. Bessler, W.G.; Warnatz, J.; Goodwin, D.G. The influence of equilibrium potential on the hydrogen oxidation kinetics of SOFC anodes. Solid State Ion. 2007, 177, 3371–3383. 34. Wang, D.Y.; Nowick, A.S. Diffusion‐controlled polarization of Pt, Ag, and Au electrodes with doped ceria electrolyte J. Electrochem. Soc. 1981, 128, 55–63. 35. Chen, X.J.; Khor, K.A.; Chan, S.H.; Yu, L.G. Influence of microstructure on the ionic conductivity of yttria-stabilized zirconia electrolyte. Mater. Sci. Eng. A 2002, 335, 246–252. 36. Park, H.J.; Kwak, C.; Lee, S.M. Mixed conduction behavior in nanostructured lanthanum gallate. Electrochem. Commun. 2009, 11, 962–964. 37. M.J. Verkerk, B.J.M.a.A.J.B. Effect of grain boundaries on the conductivity of high-purity ZrO2-Y2O3 ceramics. Solid State Ion. 1982, 6, 159–170. 38. Suwanwarangkul, R.; Croiset, E.; Entchev, E.; Charojrochkul, S.; Pritzker, M.D.; Fowler, M.W.; Douglas, P.L.; Chewathanakup, S.; Mahaudom, H. Experimental and modeling study of solid oxide fuel cell operating with syngas fuel. J. Power Sources 2006, 161, 308–322. 39. Bertei, A.; Choi, H.W.; Pharoah, J.G.; Nicolella, C. Percolating behavior of sintered random packings of spheres. Powder Technol. 2012, 231, 44–53. © 2013 by the authors; licensee MDPI, Basel, Switzerland. This article is an open access article distributed under the terms and conditions of the Creative Commons Attribution license (http://creativecommons.org/licenses/by/3.0/).