Pedestrian Safety in Sweden PUBLICATION NO. FHWA-RD-99-091
Research, Development, and Technology Turner-Fairbank Highway Research Center 6300 Georgetown Pike McLean, VA 22101-2296
DECEMBER 1999
FOREWORD
The aim of this report is to highlight some of the more important research findings in Scandinavia. Since our position is Lund in Sweden, most of our findings derives from Swedish results. The Scandinavian countries have great similarities and most of the findings are valid for all the countries. In some cases the difference in the traffic law plays an important role. This is especially the case for zebra crossings where the rules in Norway are significantly different from the other Scandinavian countries.
Technical Report Documentation Page 1. Report No.
2. Government Accession No.
3. Recipient's Catalog No.
FHWA-RD-99-091 4. Title and Subtitle
5. Report Date
Pedestrian Safety in Sweden 6. Performing Organization Code
8. Performing Organization Report No.
7. Author(s) Dr. Lars Ekman & Dr. Christer Hyden 9. Performing Organization Name and Address
Lund University Dept. of Traffic Planning & Engineering
10. Work Unit No. (TRAIS)
University of North Carolina Highway Safety Research Center 730 Airport Rd, CB #3430 Chapel Hill, NC 27599-3430
12. Sponsoring Agency Name and Address
11. Contract or Grant No.
DTFH61-92-C-00138 13. Type of Report and Period Covered
Federal Highway Administration Turner-Fairbank Highway Research Center 6300 Georgetown Pike McLean, VA 22101-2296
14. Sponsoring Agency Code
15. Supplementary Notes
Prime Contractor: University of North Carolina Highway Safety Research Center FHWA COTR: Carol Tan Esse 16. Abstract
This report was one in a series of pedestrian safety synthesis reports prepared for the Federal Highway Administration (FHWA) to document pedestrian safety in other countries. Reports are also available for: United Kingdom (FHWA-RD-99-089) Canada (FHWA-RD-99-090) Netherlands (FHWA-RD-99-092) Australia (FHWA-RD-99-093) This report is a review of recent pedestrian safety research in Sweden (in particular) with some attention to similar research in other Scandinavian countries. The report states that even in Sweden, where attention has long been paid to pedestrian and bicyclists concerns, even so, still too much traffic planning is addressed as if it were a vehicular issue only. If traffic cannot be separated, then consideration should be given in some areas to restricting vehicle speeds to 30 km/hr. It is argued that future planning must better balance the competing needs of motor vehicle traffic, pedestrians, and cyclists. 17. Key Words:
18. Distribution Statement
Pedestrians, safety, Sweden, walking cycling
19. Security Classif. (of this report)
Unclassified
20. Security Classif. (of this page)
Unclassified Form DOT F 1700.7 (8-72)
21. No. of Pages
37
Reproduction of form and completed page is authorized
22. Price
SI* (MODERN METRIC) CONVERSION FACTORS APPROXIMATE CONVERSIONS TO SI UNITS Symbol
When You Know
Multiply by
To Find
APPROXIMATE CONVERSIONS FROM SI UNITS Symbol
Symbol
When You Know
LENGTH in ft yd mi
inches feet yards miles
25.4 0.305 0.914 1.61
in f t2 y d2 ac mi2
square inches square feet square yards acres square miles
645.2 0.093 0.836 0.405 2.59
millimeters meters meters kilometers
mm m m km
mm m m km
millimeters meters meters kilometers
0.039 3.28 1.09 0.621
fluid ounces gallons cubic feet cubic yards
29.57 3.785 0.028 0.765
Symbol
inches feet yards miles
in ft yd mi
square inches square feet square yards acres square miles
in2 f t2 y d2 ac mi2
fluid ounces gallons cubic feet cubic yards
fl oz gal f t3 y d3
ounces pounds short tons (2000 lb)
oz lb T
Fahrenheit temperature
EF
foot-candles foot-Lamberts
fc fl
AREA square millimeters square meters square meters hectares square kilometers
mm m2 m2 ha km 2
2
mm m2 m2 ha km 2
2
square millimeters square meters square meters hectares square kilometers
VOLUME fl oz gal f t3 y d3
To Find
LENGTH
AREA 2
Multiply by
0.0016 10.764 1.195 2.47 0.386 VOLUME
milliliters liters cubic meters cubic meters
mL L m3 m3
mL L m3 m3
milliliters liters cubic meters cubic meters
0.034 0.264 35.71 1.307
NOTE: Volumes greater than 1000 l shall be shown in m3. MASS oz lb T
ounces pounds short tons (2000 lb)
28.35 0.454 0.907
MASS grams kilograms megagrams (or “metric ton”)
g kg Mg (or “t”)
g kg Mg (or “t”)
grams kilograms megagrams (or “metric ton”)
TEMPERATURE EF
Fahrenheit temperature
5(F-32)/9 or (F-32)/1.8
TEMPERATURE Celcius temperature
EC
EC
Celcius temperature
ILLUMINATION fc fl
foot-candles foot-Lamberts
10.76 3.426
poundforce poundforce per square inch
4.45 6.89
1.8C+32 ILLUMINATION
lux candela/m2
lx cd/m 2
lx cd/m 2
lux candela/m2
FORCE and PRESSURE or STRESS lbf lbf/in 2
0.035 2.202 1.103
newtons kilopascals
*SI is the symbol for the International System of Units. Appropriate rounding should be made to comply with Section 4 of ASTM E380.
0.0929 0.2919
FORCE and PRESSURE or STRESS N kPa
N kPa
newtons kilopascals
0.225 0.145
poundforce poundforce per square inch
lbf lbf/in 2
(Revised September 1993)
TABLE OF CONTENTS
1. Pedestrian safety situation in Scandinavia . . . . . . . . . . . . . . . . . . . . . . . . . . . . . . . . . . . . . . . . . . . 1.1 Result from police reported accidents . . . . . . . . . . . . . . . . . . . . . . . . . . . . . . . . . . . . . . . 1.2. Result from hospital records . . . . . . . . . . . . . . . . . . . . . . . . . . . . . . . . . . . . . . . . . . . . . . Most pedestrians are injured in single accidents . . . . . . . . . . . . . . . . . . . . . . . . . . . . . . 1.3. Other sources for safety information . . . . . . . . . . . . . . . . . . . . . . . . . . . . . . . . . . . . . . . . The traffic conflict technique . . . . . . . . . . . . . . . . . . . . . . . . . . . . . . . . . . . . . . . . . . . . . .
1 1 2 2 2 2
2. The effect of common pedestrian facilities . . . . . . . . . . . . . . . . . . . . . . . . . . . . . . . . . . . . . . . . . . . 4 2.1. Zebra crossings . . . . . . . . . . . . . . . . . . . . . . . . . . . . . . . . . . . . . . . . . . . . . . . . . . . . . . . 4 With and without refuge . . . . . . . . . . . . . . . . . . . . . . . . . . . . . . . . . . . . . . . . . . . . . . . . 10 2.2. Small roundabouts . . . . . . . . . . . . . . . . . . . . . . . . . . . . . . . . . . . . . . . . . . . . . . . . . . . 12 2.3. Traffic calming . . . . . . . . . . . . . . . . . . . . . . . . . . . . . . . . . . . . . . . . . . . . . . . . . . . . . . 14 Environmentally adapted through-roads . . . . . . . . . . . . . . . . . . . . . . . . . . . . . . . . . . . . 14 2.4 Project WALCYNG — How to encourage WALking and CYcliNG instead of shorter car trips and to make these modes safer . . . . . . . . . . . . . . . . . . . . . . . . . . . . . . 14 Introduction . . . . . . . . . . . . . . . . . . . . . . . . . . . . . . . . . . . . . . . . . . . . . . . . . . . . . . . . . 14 Main findings . . . . . . . . . . . . . . . . . . . . . . . . . . . . . . . . . . . . . . . . . . . . . . . . . . . . . . . . 15 a. What is known about the target groups and their situation? . . . . . . . . . . . . . . . . . . . . 15 b. What is known about the preconditions for WALCYNG? . . . . . . . . . . . . . . . . . . . . 16 The WALCYNG Quality Scheme . . . . . . . . . . . . . . . . . . . . . . . . . . . . . . . . . . . . . . . . 19 2.5 Car - Pedestrian interaction at zebra crossings . . . . . . . . . . . . . . . . . . . . . . . . . . . . . . . 19 3. The use of new pedestrian facilities . . . . . . . . . . . . . . . . . . . . . . . . . . . . . . . . . . . . . . . . . . . . . . . 3.1. Detection of pedestrians at signal-controlled intersections . . . . . . . . . . . . . . . . . . . . . . . 3.2. Relevant warning system . . . . . . . . . . . . . . . . . . . . . . . . . . . . . . . . . . . . . . . . . . . . . . . 3.3. Warning lights mounted at the roadways . . . . . . . . . . . . . . . . . . . . . . . . . . . . . . . . . . . . 3.4. Painted pre-marking at zebra crossings in Stockholm . . . . . . . . . . . . . . . . . . . . . . . . . . 3.5 Fluorescent caps on first class pupils . . . . . . . . . . . . . . . . . . . . . . . . . . . . . . . . . . . . . . . 3.6 Ultra violet light (UV-Light) . . . . . . . . . . . . . . . . . . . . . . . . . . . . . . . . . . . . . . . . . . . . .
21 21 22 23 24 25 26
4. Ongoing and future research in Scandinavia . . . . . . . . . . . . . . . . . . . . . . . . . . . . . . . . . . . . . . . . . 4.1. The implementation of the Vision Zero . . . . . . . . . . . . . . . . . . . . . . . . . . . . . . . . . . . . . A new approach to road safety . . . . . . . . . . . . . . . . . . . . . . . . . . . . . . . . . . . . . . . . . . System designer has primary responsibility . . . . . . . . . . . . . . . . . . . . . . . . . . . . . . . . . . Action in a variety of fields is needed to produce a safe road system . . . . . . . . . . . . . . . 4.2. Speed Limiters for controlling vehicle speeds . . . . . . . . . . . . . . . . . . . . . . . . . . . . . . . . Interview results . . . . . . . . . . . . . . . . . . . . . . . . . . . . . . . . . . . . . . . . . . . . . . . . . . . . . . Driving behaviour . . . . . . . . . . . . . . . . . . . . . . . . . . . . . . . . . . . . . . . . . . . . . . . . . . . . . Driving patterns . . . . . . . . . . . . . . . . . . . . . . . . . . . . . . . . . . . . . . . . . . . . . . . . . . . . . . Speed profiles . . . . . . . . . . . . . . . . . . . . . . . . . . . . . . . . . . . . . . . . . . . . . . . . . . . . . . .
26 26 27 27 28 28 29 31 31 31
5. Conclusion . . . . . . . . . . . . . . . . . . . . . . . . . . . . . . . . . . . . . . . . . . . . . . . . . . . . . . . . . . . . . . . . 32 6. References . . . . . . . . . . . . . . . . . . . . . . . . . . . . . . . . . . . . . . . . . . . . . . . . . . . . . . . . . . . . . . . . . 33
1. Pedestrian safety situation in Scandinavia 1.1. Result from police reported accidents Police reported accidents are still the most common source of information if we want to study the overall safety situation for road users. In the Scandinavian countries, we have a long tradition of studying accidents reported by the police. Since the accuracy of these reports decline with declining severity, we tend to only rely 100 percent on fatal accidents; but for most purposes, all injury accidents are used. Looking at the number of people killed in road related accidents, we can see that pedestrian accidents still constitutes a severe problem. Table 1. Police reported pedestrian accidents 1995 in the Scandinavian countries. Population (106) Sweden Denmark Finland Norway
8.8 5.2 5.2 4.3
Number of killed pedestrians
Number of injured pedestrians
71 118 72 51
Killed and Number of killed injured pedestrians per million inhabitant
1403 1033 1031 1105
1474 1151 1103 1156
8.1 22.7 13.8 11.9
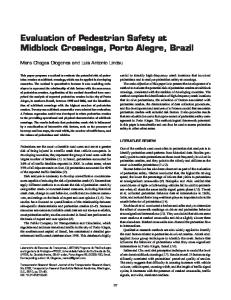
Police reported accidents in Sweden
Killed or injured pedestrians
25000
20000
15000
Killed seriously injured
10000
slightly injured
5000
0 1970
1980
1990
2000
YEAR
Figure 1. Police reported accidents in Sweden, 1970-1996.
1.2. Result from hospital records Since the problem with underreporting is especially big for pedestrian and bicycle accidents, it makes sense to include results from hospital records. In Sweden all accidents on roads or sidewalks — including at least one vehicle — are considered traffic accidents. This includes single accidents for pedal cyclists in the same way as single accidents for other road users, but it does not include single accidents for pedestrians. Besides, single accidents for cyclists are almost non-existing in the police records. In a study by Berntman and Modén (1996) it was found that more than 400 pedestrians were injured during 1 year in the city of Malmö. This is about five to seven times the number reported by the police. More than half of the injured people are above 65 years old. This is also true for smaller towns. Problems for pedestrians generally increase with increasing age. As an example, we can often find traffic accidents involving pedestrians above 90 in the hospital statistics. Women are more at risk than men. In smaller towns, such as Lund (100,000 inhabitants), 70 people per 100,000 inhabitants are injured in traffic. In Malmö which is a bigger town (225,000 inhabitants) 185 people per 100,000 inhabitants are injured. Most pedestrians are injured in single accidents In studies based on hospital records, the most predominant type of accidents involve pedestrians who have fallen or slipped on icy or snowy surfaces. Berntman and Modén (1996) found that between 65 and 80 percent of the accidents reported by the hospital were of this type. Compared to other road user groups, falling and slipping is far more common for pedestrians. In our Nordic climate, icy and snowy sidewalks play an important role in many pedestrian accidents. In a Swedish study (LTH/VTI 1996), it is concluded that the climate and thus snow and ice conditions have a great impact on pedestrian problems. In the city of Göteborg and Lidköping, icy or snowy conditions were present in 50 percent of all accidents in which pedestrians fell. In Umeå, in the far north with colder climate, the number is 65 percent. Pedestrians injured by falling often claim that bad winter maintenance was a main contributing factor to the accident. Holes and generally uneven surfaces are also often mentioned.
1.3. Other sources for safety information The traffic conflict technique From a methodological point of view, the monitoring and evaluation of traffic safety is a very challenging task. Generally, safety monitoring and evaluation must include a number of different tools. Accident reports normally provide only limited information about the accident generating processes. Besides, it is often difficult to make reliable estimates of the expected
number of accidents. Accident analysis must therefore be supported by supplementary information. The most common concept in this respect is the traffic conflict. It represents a link between behavior and accidents. It has 'one leg' on the behavioral side, via the continuous monitoring of behaviors and specification of behaviors that lead to serious conflicts. The 'other leg' is on the accident side, thanks to the identification of near-accident situations (= serious conflicts) that have shown a close relationship with accidents. Accident analysis plays the role of large-scale monitoring of safety problems, while conflict studies are used to identify the kind of problems that lie behind the accidents and what kind of measures might be effective. Behavioral studies, finally, support conflict studies through more comprehensive and detailed studies to explain the presence of certain accident- producing behaviors, or why this behavior is more common than other nonaccident producing behaviors. The Swedish Traffic Conflicts Technique (TCT), the most commonly used today, is based on two concepts: Time to Accident (TA) and Conflicting Speed (CS) (Hydén, 1987). TA is the time that remains from the moment one of the road users takes evasive action until a collision would have occurred if the speeds and directions of the involved road users had not changed. CS is the speed of the road user that takes evasive action, just prior to the evasive action. A serious conflict is defined by certain border values for TA and CS. The serious conflicts are recorded by human observers. The training of observers normally takes 1 week. One great advantage with conflict studies is that they are easy to perform. In the most simple form, no sophisticated hardware is needed, only a pencil and a recording sheet. Today, image processing is becoming a valid concept for making conflict studies more efficient and reliable. The Swedish technique has been carefully assessed regarding reliability and validity. It has been demonstrated that serious conflicts very often are more reliable in predicting average expected accident numbers at individual locations than occurred accidents are. Moreover, events leading to accident situations (i.e., to serious conflicts) are more reliably recorded by trained observers than if they were to be recorded via interviews with accident involved road users, or via some other reconstructing procedure. Long experience in the development and use of this tool has clearly shown that the Swedish TCT is reliable and valid enough to be a useful not only in Sweden but also in other countries. The Swedish technique has been applied in quite a few countries around the world. Thanks to this comprehensive knowledge of what behaviors actually produce risks and what the underlying reasons for these behaviors are, one can then hypothesize about remedial measures in any of the traditional areas, e.g., road design, campaigns, information, education, etc., thus treating both general problems and local problems. There is one more major point; conflict studies can be used in an after situation to see whether the hypotheses that were formulated actually proved to be true or not. Thus, the learning process, and the increase of useful knowledge, can be accelerated.
The main problem in using the technique today is that it is too demanding of time and human resources. One way out of this problem is to make the procedure of data collection and analysis more or less automatic. Research efforts are underway to link conflict studies to video- recording and image processing.
2. The effect of common pedestrian facilities 2.1. Zebra crossings Zebra crossings are one of the most common pedestrian safety countermeasures in Sweden, as in all Scandinavian countries. To test the safety effect of a standard zebra crossing, a comparative study was carried out with data collected from five cities in southern Sweden. The vast majority of intersections in central parts of Swedish urban areas have been equipped with marked zebra crossings. It has been considered almost self evident to most people that it is safer to cross the road at a zebra crossing. The well-known fact that most of the accidents where pedestrians have been hit by a car in urban areas occur either at a zebra crossing or at a signalized intersection has not changed the opinion about the zebra crossing. It was considered obvious that this was caused by the high exposure at zebra crossings and signalized intersections respectively. No one had, however, up to that point, measured the exposure of pedestrians in Sweden (Ekman, 1988). The study was designed to ensure comparison with previous British studies by Jacobs and Wilsson (1967). In that study only a few streets were examined, but in this study, data were collected from many streets in the five cities. In line with the British study, the street was divided into segments that could be considered comparable. In addition to the zones defined in the British study, some zones were added to make it possible to compare the zebra crossing, including the area just surrounding the zebra marking, to approaches with no zebra marking or signalized facilities. The reason for this was that the previous studies pointed out that there was a big difference in accident rates between the zebra and the area just beside the crossing itself. This had been used as an indication of the safety benefits of the zebra crossing. The high accident rate close to the zebra crossing should be looked upon as a negative side effect of the zebra.
Table 2. Cities where the data was gathered. City
Inhabitants in urban areas of the city in 1980
Göteborg
457000
Malmö
227000
Lund
55000
Landskrona
27000
Eslöv
14000
Accident data were collected from the cities listed in table 2 in southern Sweden. Data on police reported injury accidents where pedestrians had been hit by a vehicle was collected from 1979 to 1984. The length of the period was a compromise between a reasonably large data set on one hand and on the other hand avoiding too large changes in the traffic situation during the time period. Each accident was classified in line with the zone system, which means that only accidents that involved both crossing pedestrians and cars were considered. Accordingly, the number of crossing pedestrians was counted at all streets. To cover all the selected streets, the counting was carried out with a sample technique. All the counting was done manually by observers. In total, 56,700 km (35,211 mi) of street were covered. For each individual zone, the number of crossing pedestrians was counted twice during a short time (two 6-minute periods). The peak traffic period was avoided by counting crossing pedestrians between 9:00 to 12:00 and between 13:00 to 16:00. An analysis of accident occurrence suggested counting the traffic during off-peak time, since the accidents seemed to be dispersed during the day with some concentration in the afternoon. The accident rate was defined in accordance with the probability approach. The aim was to see if it was safer for those pedestrian crossing the street at a zebra crossing compared to those crossing at other similar locations. The accident rate was then:
R=
the number of police reported accidents during 6 years ∗1000 the number of crossing pedestrians during 12 minutes
Exposure
Accidents
(number of crossing pedestrians)
40,3%
17,2%
Links
10,0%
40,6%
20,3%
32,4%
Links
4,4%
34,6%
Figure 2. The distribution of exposure and accidents.
50 40 30