PALM BEACH COUNTY’S HEALTHY KIDS, HEALTHY COMMUNITIES
PALM BEACH COUNTY’S HEALTHY KIDS, HEALTHY COMMUNITIES CASE REPORT PALM SPRINGS, LAKE WORTH, AND GREENACRES, FLORIDA Evaluation of the Healthy Kids, Healthy Communities National Program December 2009 to December 2013
1
PALM BEACH COUNTY’S HEALTHY KIDS, HEALTHY COMMUNITIES ACKNOWLEDGMENTS Support for this evaluation was provided by a grant from the Robert Wood Johnson Foundation (#67099). Transtria LLC led the evaluation and dissemination activities from April 2009 to March 2014. Representatives from Palm Beach County’s Healthy Kids, Healthy Communities partnership actively participated in the evaluation planning, implementation, and dissemination activities. This case report is a synthesis of information collected through multiple evaluation methods as part of a collaborative, community-based approach to evaluation. We are grateful for the collaboration with and support from the Robert Wood Johnson Foundation (Laura Leviton, PhD and Tina Kauh, PhD), the Washington University Institute for Public Health (Ross Brownson, PhD), the Healthy Kids, Healthy Communities (HKHC) National Program Office (Casey Allred; Rich Bell, MCP; Phil Bors, MPH; Mark Dessauer, MA; Fay Gibson, MSW; Joanne Lee, LDN, RD, MPH; Mary Beth Powell, MPH; Tim Schwantes, MPH, MSW; Sarah Strunk, MHA; and Risa Wilkerson, MA), the HKHC Evaluation Advisory Group (Geni Eng, DrPH, MPH; Leah Ersoylu, PhD; Laura Kettel Khan, PhD; Vikki Lassiter, MS; Barbara Leonard, MPH; Amelie Ramirez, DrPH, MPH; James Sallis, PhD; and Mary Story, PhD), the Social System Design Lab at Washington University in St. Louis (Peter Hovmand, PhD), the University of Memphis (Daniel Gentry, PhD), and Innovative Graphic Services (Joseph Karolczak). Special thanks to the many individuals who have contributed to these efforts from Transtria LLC, including Evaluation Officers (Tammy Behlmann, MPH; Kate Donaldson, MPH; Cheryl Carnoske, MPH; Carl Filler, MSW; Peter Holtgrave, MPH, MA; Christy Hoehner, PhD, MPH; Allison Kemner, MPH; Jessica Stachecki, MSW, MBA), Project Assistants (James Bernhardt; Rebecca Bradley; Ashley Crain, MPH; Emily Herrington, MPH; Ashley Farell, MPH; Amy Krieg; Brandye Mazdra, MPH; Kathy Mora, PhD; Jason Roche, MPH; Carrie Rogers, MPH; Shaina Sowles, MPH; Muniru Sumbeida, MPH, MSW; Caroline Swift, MPH; Gauri Wadhwa, MPH; Jocelyn Wagman, MPH), additional staff (Michele Bildner, MPH, CHES; Daedra Lohr, MS; Melissa Swank, MPH), Interns (Christine Beam, MPH; Skye Buckner-Petty, MPH; Maggie Fairchild, MPH; Mackenzie Ray, MPH; Lauren Spaeth, MS), Transcriptionists (Sheri Joyce; Chad Lyles; Robert Morales; Vanisa Verma, MPH), and Editors (Joanna Bender and Julie Claus, MPH). This material may be reproduced or copied with permission from Palm Beach County’s Healthy Kids, Healthy Communities, Robert Wood Johnson Foundation, the Healthy Kids, Healthy Communities National Program Office, or Transtria LLC. Citation of the source is appreciated. Photos on the front page were provided by Palm Beach County’s Healthy Kids, Healthy Communities Partnership.
Suggested citation: Behlmann T, Brennan LK. Palm Beach County’s Healthy Kids, Healthy Communities Case Report. St. Louis, MO: Transtria LLC; 2014. http://www.transtria.com/hkhc. Accessed .
For more information about the evaluation aims, methods, analyses, or products, please contact Laura Brennan (
[email protected]) or Allison Kemner (
[email protected]).
ACKNOWLEDGMENTS
2
PALM BEACH COUNTY’S HEALTHY KIDS, HEALTHY COMMUNITIES TABLE OF CONTENTS Background Community Demographics Influence of Social Determinants Palm Beach County’s Healthy Kids, Healthy Communities Partnership Partnership Funding Community Assessment Planning and Advocacy Efforts Healthy Eating and Active Living Strategies Community and School Gardens Parks and Play Spaces Joint Use Agreements Active Transportation Sustainability of the Partnership and Initiative
Tables Table 1: Demographics by City, 2010 Table 2: Gardens Developed or Supported by the Partnership
Figures Figure 1: Map of Healthy Kids, Healthy Communities Partnerships Figure 2: Map of Lake Worth, Greenacres, and Palm Springs, FL Figure 3: Parks and Play Spaces Infographic
Appendices Appendix A: Evaluation Logic Model Appendix B: Partnership and Community Capacity Survey Results Appendix C: Palm Beach County Healthy Kids, Healthy Communities Partnership List Appendix D: Sources and Amounts of Funding Leveraged Appendix E: Parks and Play Spaces Direct Observation Report
TABLE OF CONTENTS
3
PALM BEACH COUNTY’S HEALTHY KIDS, HEALTHY COMMUNITIES BACKGROUND Healthy Kids, Healthy Communities National Program With the goal of preventing childhood obesity, the Healthy Kids, Healthy Communities (HKHC) national program, funded by the Robert Wood Johnson Foundation (RWJF), provided grants to 49 community partnerships across the United States (Figure 1). Healthy eating and active living policy, system, and environmental changes were implemented to support healthier communities for children and families. The program placed special emphasis on reaching children at highest risk for obesity on the basis of race, ethnicity, income, or geographic location.1 Project Officers from the HKHC National Program Office assisted community partnerships in creating and implementing annual workplans organized by goals, tactics, activities, and benchmarks. Through site visits and monthly conference calls, community partnerships also received guidance on developing and maintaining local partnerships, conducting assessments, implementing strategies, and disseminating and sustaining their local initiatives. Additional opportunities supplemented the one-on-one guidance from Project Officers, including peer engagement through annual conferences and a program website, communications training and support, and specialized technical assistance (e.g., health law and policy). For more about the national program and grantees, visit www.healthykidshealthycommunities.org. Figure 1: Map of Healthy Kids, Healthy Communities Partnerships
Evaluation of Healthy Kids, Healthy Communities Transtria LLC and Washington University Institute for Public Health received funding from the Robert Wood Johnson Foundation to evaluate the HKHC national program. They tracked plans, processes, strategies, and results related to active living and healthy eating policy, system, and environmental changes as well as influences associated with partnership and community capacity and broader social determinants of health BACKGROUND
4
PALM BEACH COUNTY’S HEALTHY KIDS, HEALTHY COMMUNITIES Reported “actions,” or steps taken by community partnerships to advance their goals, tactics, activities, or benchmarks from their workplans, formed community progress reports tracked through the HKHC Community Dashboard program website. This website included various functions, such as social networking, progress reporting, and tools and resources to maintain a steady flow of users over time and increase peer engagement across communities. In addition to action reporting, evaluators collaborated with community partners to conduct individual and group interviews with partners and community representatives, environmental audits and direct observations in specific project areas (where applicable), and group model building sessions. Data from an online survey, photos, community annual reports, and existing surveillance systems (e.g., U.S. census) supplemented information collected alongside the community partnerships. For more about the evaluation, visit www.transtria.com/hkhc. Palm Beach County’s Healthy Kids, Healthy Communities In December 2009, Palm Beach County’s Healthy Kids, Healthy Communities received a four-year $360,000 grant as part of the HKHC national program. The partnership focused on increasing healthy eating and active living in Palm Beach County, specifically in the Cities of Lake Worth and Greenacres and the Village of Palm Springs. There are over 91,000 residents in the target area. The Palm Beach County School District served as the lead agency for the partnership. Led by Project Director Eric Stern, and Project Coordinator, Erica Whitfield, the partnership consisted of over 100 members, and the meetings routinely attracted about 30 people. The partnership and capacity building strategies of the partnership included: School Involvement: The administrative staff of Palm Beach County School District led the partnership, but principals and teachers were actively engaged in the development and maintenance of school gardens, joint use agreements, and active transportation components. Youth Involvement: Youth were involved with the development and maintenance of school gardens and the active transportation initiative. See Appendix A: Evaluation Logic Model and Appendix B: Partnership and Community Capacity Survey Results for more information. Along with partnership and capacity building strategies, the Palm Beach County Healthy Kids, Healthy Communities partnership incorporated assessment and community engagement activities to support the partnership and the healthy eating and active living strategies. The healthy eating and active living strategies of Palm Beach County’s Healthy Kids, Healthy Communities included: Community and School Gardens: To increase access to fruits and vegetables, the partnership collaborated with the Palm Beach County Cooperative Extension, local organizations, and community residents to establish 30 school and community gardens. Parks and Play Spaces: The partnership worked with Palm Beach County Parks and Recreation Department to increase opportunities for healthy eating and active living in parks and play spaces through the development of the Tropical Ridge Fitness Park, improvements to Spillway Park, creation of a park at 5th Avenue, and adoption of a vending machine policy at Palm Beach County Parks. Joint Use: To increase access to physical activity facilities, the partnership focused on creating a joint use agreement with Berkshire Elementary. As part of the agreement, a walking trail and fence were installed to be used by the students and community. Active Transportation: The partnership worked to increase opportunities for active transportation in the community by installing a bike rack, purchasing a bike trailer, and supporting the adoption of a Master Comprehensive Bicycle Transportation Plan.
BACKGROUND
5
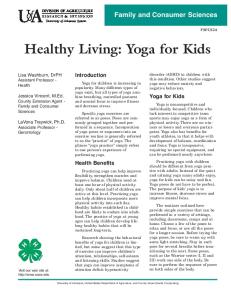
PALM BEACH COUNTY’S HEALTHY KIDS, HEALTHY COMMUNITIES COMMUNITY DEMOGRAPHICS Palm Beach County is one of the largest counties east of the Mississippi River, with a population of 1,320,134. Residents of the county are mainly white (76.9%) and approximately 20% are Hispanic/Latino. The county is known to have the highest cost of living in the state. The median household income is $52,806 and 14% of persons live below the poverty level.2 The three target areas (City of Lake Worth, City of Greenacres, Village of Palm Springs) cover 31 square miles from east to west (see Figure 2). The demographic make-up varies across the three cities (see Table 1). The City of Lake Worth, covering seven miles of Palm Beach County, has the highest rate of poverty (28.6%), as well as the highest number of residents that speak a language other than English (52.9%).2 The city is unique in that it supplies its own services (e.g., electrical plant, water) and has the only school in Palm Beach County with a Haitian principal who speaks Creole. About half (50.9%) of the residents in the Village of Palm Springs are Hispanic/Latino, and 52.2% speak a language other than English. Representing over one-fifth of the county’s population, foreign-born residents represent a range of languages, ethnicities, and cultures. Mexicans and Colombians are the most dominant immigrant population in Greenacres, while individuals from Haiti, Mexico, and Guatemala frequently reside in Lake Worth. Figure 2: Map of Lake Worth, Greenacres, and Palm Springs, FL3
Table 1: Demographics by City, 20102 Race/Ethnicity
% Speaks No English at Home
Population
% Below Poverty
Palm Beach County
1,320,134
14.0%
Black 18.2%
Hispanic 20.1%
City of Lake Worth
34, 910
28.6%
19.8%
39.6%
52.9%
City of Greenacres
37,573
17.6%
17.0%
38.3%
48.2%
Village of Palm Springs
18, 928
24.5%
12.1%
50.9%
52.2%
Community
COMMUNITY DEMOGRAPHICS
27.9%
6
PALM BEACH COUNTY’S HEALTHY KIDS, HEALTHY COMMUNITIES School Environment The School District of Palm Beach County is the 5th largest public school district in Florida and the 11th largest in the nation. The district serves over 175,000 students across 107 elementary schools, 33 middle schools, 23 high schools, and 22 other schools (e.g., alternative, intermediate). In the target areas of Lake Worth, Greenacres, and Palm Springs, there are 30 schools that serve approximately 27,000 students. Seventy percent of the students receive free and reduced-price lunch.4 About 44% of students in the area are overweight or obese, compared to 38% in Palm Beach County.5 INFLUENCE OF SOCIAL DETERMINANTS Poverty The City of Lake Worth has areas of extreme wealth and poverty, all within two blocks. Neighboring communities (e.g., Riviera Beach, Glades) have many issues, such as high unemployment rates, taking attention away from the Lake Worth area. In addition, 54% of public schools in the Palm Beach School District are Title I, which indicates a high percentage of the students are from low-income families. Transportation Transportation opportunities keep the community and outside cities connected. A tri-rail, owned by CSX Corporation runs from Miami to Rivera Beach, Florida The north-south train stops every five miles providing residents access to local and surrounding destinations. Additionally, a public bus system is available within the county. In the City of Lake Worth, the Community Redevelopment Association developed a bike master plan and paid $100,000 to restripe the city. Bike lanes were also put in throughout downtown and the north side of the city. Economic Climate
“Well unfortunately for us the economic The current and forecasted economic situation for the country forecast for the next 3-5 years is not is proving to be a challenge. The City of Lake Worth does not looking good throughout the country.” – have money for maintenance because some residents are not Partner required to pay taxes. Taxes are based on housing, as well as utility usage (e.g., electric). The money residents pay per kilowatt hour does not increase until they are over a certain amount. The economic downturn, aging infrastructure, and budget cuts make it impossible for the city to maintain property. Housing The community has a local organization called Adopt-a-Family that takes in homeless people. Individuals or families are given a place to stay for free, but they are required to get a job and pay Adopt-a-Family a certain amount each month. The program saves the money in an account for them until they can afford a down payment for a house. Crime and Safety Lake Worth has a violent crime rate (12.88 per 1,000 persons), almost 50% higher than Palm Springs (6.73 per 1,000 persons) and Greenacres (6.07 per 1,000 persons).6 In Lake Worth, there are 13 gangs present.
Photo from Healthy Kids, Healthy Communities Evaluation Site Visit
Perception of safety is low in some neighborhoods, especially in the City of Lake Worth. Residents outside of the community perceive certain areas as having high crime because of news stories and media flashes. Students are oftentimes kept on lock down because of safety concerns. “…quite often kids are kept in school until 5pm or 6pm because they have to clear the area so it’s unfortunate that there is a stigma that is associated with that community.” – Partner INFLUENCE OF SOCIAL DETERMINANTS
7
PALM BEACH COUNTY’S HEALTHY KIDS, HEALTHY COMMUNITIES PALM BEACH COUNTY’S HEALTHY KIDS, HEALTHY COMMUNITIES PARTNERSHIP Lead Agency and Leadership Teams The School District of Palm Beach County was the lead agency for Palm Beach County’s Healthy Kids, Healthy Communities partnership. The partnership was formed in August 2010 as a result of the HKHC grant funding. Several key partners had an established history of working with the School District before the formation of the HKHC partnership; however through the initiative, they were able to scale-up their participation to the community level. The partnership has grown from a small group of core partners to include a large number of diverse partners from the community, civic organizations, businesses, government, community-based organizations, foundations and elected officials. See Appendix C for a list of partners. The Project Director, Eric Stern, and Project Coordinator, Erica Whitfield, led the efforts of the partnership. Eric was employed “We have a lot of community support that by the lead agency before the initiative was funded, while Erica comes from outside other organizations was hired after the start of the grant. that I didn’t even know were going to be The recruiting efforts of the administrative staff (e.g., Project able to support us.” -Staff Coordinator) were vital to attracting the broad network of partners that strengthened the partnership. Specific partners were involved in each of the HKHC initiatives, providing support and guidance from planning to implementation or adoption. Community and School Gardens The partnership collaborated with several organizations and youth to develop and maintain 30 gardens in the target area. Principals, teachers, parents, and youth were actively engaged throughout the initiative. Nonprofit community-based organizations and business, such as Memory Trees, Florida Agriculture in the Classroom, The Breakers, Amelia’s Smarty Plants, and Lowe’s, contributed by donating supplies and providing in-kind support. Parks and Play Spaces The partnership collaborated with the City of Lake Worth, the Office of Community Revitalization, the College Park Neighborhood Association, Florida Department of Transportation, and Palm Beach County Parks and Recreation Department to increase physical activity facilities in the target area. Joint Use The Palm Beach County School District worked closely with Berkshire Elementary and Palm Beach County Office of Community Revitalization to implement a joint use agreement for the school’s walking trail. Funding was provided from Quantum Foundation for a fence near the trail, while funding from the Palm Healthcare supported development of the trail. Active Transportation Partners collaborated with Berkshire Elementary, the South Florida Commuter Services, Palm Beach Metropolitan Planning Organization, City of Lake Worth, Lake Worth Community Redevelopment Agency, and the Department of Health to implement active transportation initiatives.
PARTNERSHIP AND LEADERSHIP PROFILE
8
PALM BEACH COUNTY’S HEALTHY KIDS, HEALTHY COMMUNITIES PARTNERSHIP FUNDING Several funding sources were obtained to support the HKHC initiatives. Grants or funds were received from private and public foundations or organizations. As part of HKHC, grantees were expected to secure a cash and/or in-kind match equal to at least 50% of the funds received from Robert Wood Johnson Foundation (RWJF) over the entire grant period. For additional funding information, see Appendix D: Sources and Amounts of Funding Leveraged. Several partner organizations provided in-kind support for staff time and meeting space as part of the matching funds. The following organizations provided substantial support to the initiative: Florida Department of Transportation ($750,000), Quantum Foundation ($170,000), School District of Palm Beach County School Food Service Department ($89,000), Palm Healthcare Foundation ($50,000), City of Lake Worth Community Redevelopment Agency ($30,000), Wells Fargo Bank ($20,000), Office of Community Revitalization ($20,000), Law Enforcement Trust Fund ($10,000), and KaBoom! ($10,000). Gardens Several non-profit organizations, foundations, and businesses supported the community and school garden initiative, including: The Quantum Foundation provided funds ($100,000) for the development of gardens. Kiwanis Club of Lake Worth allocated a $500 budget each year to maintain the South Grade Elementary garden. The Quakers provided $3,000 for the Highland Elementary School garden. In addition, individual teachers applied for and received funds to support school gardens. Parks and Play Spaces The following resources were received to support the parks and play spaces initiatives: The Quantum Foundation, the City of Lake Worth’s Community Revitalization Agency, the Trust for Public Land, Wells Fargo Bank, and the Palm Health Care Foundation provided funds to install the Tropical Ridge Fitness Park. Funds for the walking trail at Spillway Park were received from the Palm Beach County REAP program and the College Park Neighborhood Association. The Community Redevelopment Agency received funding ($10,000) from KaBoom! to install a children’s play area at the Tropical Ridge Fitness Park. Additional funding for the fitness park came from Publix Supermarkets, Keep Palm Beach County Beautiful, Community Partners of Palm Beach County, Bridges at Highland Elementary, Cannatelli Builders, and Tropical Ridge Neighborhood Association. Joint Use Agreements The Office of Community Revitalization, Palm Healthcare, and Quantum Foundation provided funds for the Berkshire walking trail. Active Transportation Funds from the Palm Healthcare Foundation and Palm Beach County School District supported active transportation improvements (e.g., bike rack).
PARTNERSHIP FUNDING
9
PALM BEACH COUNTY’S HEALTHY KIDS, HEALTHY COMMUNITIES COMMUNITY ASSESSMENT HKHC staff, along with members of the partnership, conducted initial focus groups to determine the direction for the partnership’s work. As a result, three strategy areas were identified: community and school gardens, parks and play spaces, and joint use agreements. Additional assessments were developed and conducted related to three strategy areas. Community and School Gardens Garden Survey: Garden Coordinators were surveyed at the end of the initiative to understand the effects of the garden on youth and the community. Parks and Play Spaces Parks and Play Spaces Direct Observation: Partners collected direct observation data on the Tropical Ridge Fitness Zone after it was installed. Data was collected at the park on eight different days in the spring of 2013 between March 22 and June 3. A total of 343 observation periods were collected. During the dry season (March and April), a total of 167 observation periods were captured, while 176 observation periods were completed in the wet season (May and June). Overall, observed activity in the dry season was most commonly coded as moderate (41%), followed by sedentary (32%) and then very active (27%). In the wet season, Adults were most commonly observed in sedentary (40%) and very active (41%) behavior. No adolescents or children were observed in the wet season. A complete summary of the results can be found in Appendix E. Joint Use Play Space Inventory: A tour of schools in the project area was conducted to identify potential public play spaces and to determine the feasibility of a joint use agreement for that site. Document review: Existing joint use agreements were reviewed for the school district.
COMMUNITY ASSESSMENT
10
PALM BEACH COUNTY’S HEALTHY KIDS, HEALTHY COMMUNITIES PLANNING AND ADVOCACY EFFORTS Community Outreach and Engagement Community participation was a core element of the HKHC initiative. Elected officials and community residents served as volunteers, generated project ideas, participated in events, and became involved in one of the neighborhood associations. Local organizations, such as Palm Beach County Health Department, the Quantum Foundation, and Palm Healthcare offered their time and support. A County Commissioner and the City of Lake Worth Commissioners were active supporters of the HKHC partnership and attended all planned events and frequented the gardens. Support was also received by other local departments (e.g., City of Lake Worth Department of Planning and Building) attending partnership meetings. A gardening event was held in Palm Springs, and almost all of the City Council members came out to plant vegetables. Advocacy and Media The Palm Beach County HKHC initiative was disseminated through several avenues: The Palm Beach Post covered the Spillway Park walking trail (May 2011), the Berkshire walking trail (October 2013), and community and school gardens (2013). A pamphlet was created in March 2011 to assist schools as they developed and enhanced school gardens. This pamphlet was presented at a School District’s Wellness Policy Taskforce meeting. Through the partnership with the Quantum Foundation, the HKHC partnership was given the opportunity to appear on an episode of "Your Healthy Community," a show on the local PBS station. Garden coordinator, Tom Salinsky, and grant coordinator, Erica Whitfield, appeared together in a segment about the South Grade garden.
PLANNING AND ADVOCACY EFFORTS
11
PALM BEACH COUNTY’S HEALTHY KIDS, HEALTHY COMMUNITIES COMMUNITY AND SCHOOL GARDENS To increase access to fruits and vegetables, the partnership collaborated with the University of Florida/IFAS Palm Beach County Cooperative Extension, local organizations, and community residents to establish school and community gardens. Several different types of gardens were created based on the needs and desires of students and residents and availability of funding. Policy, Practice, and Environmental Changes The following policy, practice, and environmental changes occurred between 2010 and 2013: The partnership collaborated with school staff and local organizations to develop 27 school and community gardens (see Table 2 for the complete list of locations). Three gardens outside of the project were developed as a result of HKHC, but did not receive funding. Students painted murals and created mosaics in five of the gardens with leadership from the Palm Beach County School District’s Fine Arts Department. In December 2010, a sidewalk was installed at Highland Elementary to meet the standards of Americans with Disabilities Act (ADA). The 29 other gardens that were installed also included the installation of ADA sidewalks. Complementary Programs/Promotions At least 11 after-school gardening clubs were developed or maintained with funds from HKHC, including the Owl Team at Pine Jog Elementary School and the Green Club at CO Taylor/Kirklane Elementary.
Table 2: Gardens Developed or Supported by the Partnership Barton Elementary School
Gray Mockingbird at Scottish Rite Masonic Center
Meadow Park Elementary School
Berkshire Elementary School
Greenacres Elementary School
North Grade Elementary
Cholee Lake Elementary School
G-Star School of the Arts
CO Taylor/Kirkland Elementary School
Highland Elementary School
Diamond View Elementary School Elbridge Gale Elementary
Heritage Elementary School Indian Pines Elementary School
Forest Hill Elementary
John I Leonard High School
Palmetto Elementary Pine Jog Elementary School South Florida Science Museum South Olive Elementary The Flannery Community Garden at South Grade Elementary School
For the Children at Osborne School
Lake Worth Middle School
The Sun Garden at the Therapeutic Recreation Center
Grassy Waters Elementary
Liberty Park Elementary School
Tradewinds Middle School
In addition, gardening classes and workshops were taught by local partners. The Breakers, a hotel in Palm Beach County, taught gardening classes weekly at the Scottish Rite Masonic Center and Berkshire Elementary. A coordinator from University of Florida Cooperative Extension taught a gardening class for the Palm Beach County School District. The class, Farm Your Backyard: Vegetable Growing, was originally intended for community members and tailored to fit the needs of teachers. Photo provided by Palm Beach County’s
Many schools added a curriculum component to the garden to Healthy Kids, Healthy Communities. increase students’ knowledge. Teachers were trained by other teachers on how to incorporate gardening into their curricula. A local partner, Florida Agriculture in the Classroom, provided a free training manual and workshop called Gardening for Grades. The workshop was for teachers who were interested in learning how to integrate gardening into classroom curricula. Each garden was given a binder with Gardening for Grades or Junior Master Garden. In addition, the partnership incorporated art into some of the gardens, and presentations were given about gardening to the schools and community. COMMUNITY AND SCHOOL GARDENS
12
PALM BEACH COUNTY’S HEALTHY KIDS, HEALTHY COMMUNITIES Implementation The partnership developed plans, agreements, and leases to help guide the development and maintenance of each garden. Guides and Agreements The School Garden Development Guide was developed in 2011 by the partnership. The guide included a list of prohibited plants. The school district permitted the use of synthetic and natural fertilizers, but recommended keeping all chemicals to a minimum. It required all gardens to have areas that offered opportunities for children and adults with disabilities. The booklet was distributed to every school, including those outside the grant area. In addition, a five-year agreement was created between the Palm Beach County School District and each community site or school principal. The agreement included requirements for maintenance and usage by the students. Planning and Development Responsibilities, sponsorships, and logistics (e.g., garden hours) varied across the 27 sites. The planning process began after a principal, teacher, or community member expressed interest in developing a garden. A walk-through was then conducted to determine potential garden design and to identify a water source. The school or community received information on additional options (e.g., murals, art projects) during the walk-through. Each of the 27 gardens were built by volunteers and students through planting days. A large proportion of the gardens was run and maintained by after-school or aftercare programs. Some sites chose to operate the garden year-round, while the remaining sites chose to operate only during the school year.
Photo taken from Healthy Kids, Healthy Communities Dashboard
Design and equipment used also varied across the gardens. Some gardens were organized into culinary themes (e.g., pizza garden) or were developed to attract specific insects, such as butterflies. Pine Jog Elementary had a greenhouse-like structure built that sheltered crops and kept them moist, eliminating the need for weekend watering. In April 2011, several compost bins were installed to allow schools to produce their own fertilizer. Funding and donations for the gardens were provided by various organizations. The University of Florida Cooperative Extension and Palm Beach County Health Department were common sources of funding for seeds and equipment. Several other local organizations provided donations or supplies, including Kiwanis Club of Lake Worth, Florida Agriculture in the Classroom, “70% of our students qualify for free and Lowes, Amelia’s Smarty Plants, Mecca Farms, Memory Trees, reduced lunch. So we’re a higher poverty Solid Waste Authority, local farmers, and others. In addition to school. And actually some of those the donations, fundraisers were held to support the gardens. vegetables that are donated to that church Grow ‘Ems, a take home garden kit, was sold to students for may be actually picked up by the families.” $10 each. Approximately half of the funds were used for the - Partner gardens. Produce Donation Several of the gardens provided produce to vulnerable communities. The Scottish Rite Masonic Center garden was created with the sole intention of providing produce to food pantries. Although the garden at Pine Jog was managed using a business model to sell fresh produce, it had begun to donate to local pantries when possible. In addition, a local non-profit organization, Palm Beach County Food Bank, accepted a yearly donation of fresh produce from the gardens to distribute to local food pantries. COMMUNITY AND SCHOOL GARDENS
13
PALM BEACH COUNTY’S HEALTHY KIDS, HEALTHY COMMUNITIES Population Reach and Impact The community and school gardens were targeted to youth and their families that resided in the Palm Beach County School District. The school and garden initiative built a supportive network of community partners, including farmers, local law enforcement, and University of Florida Cooperative Extension. Challenges Partners have noted a few challenges that occurred during the planning and development of the gardens. The Palm Beach County School District created a list of items that were prohibited from being grown on school grounds including peach trees and tomato plants. After discussions and school lobbying efforts, both peach trees and tomato plants were removed from the prohibited list.
Photo from Healthy Kids, Healthy Communities Dashboard
Time required to search and apply for grant funding was a burden on school teachers and administrators. Lessons Learned and Sustainability Gardens are sustained primarily through donations, fundraisers, and produce sales. To ensure long-term success of the gardens, local businesses and community partners were recruited to provide support to the gardens beyond HKHC. Five-year agreements were signed by principals at each school, and each garden was to develop its own financial sustainability plan. The School District Wellness Policy will be updated by the Wellness Policy Taskforce to include language to encourage the development of gardens on school campuses. The district is trying to move toward institutionalized gardens, as many schools are requesting that they be included in new construction areas. Individual schools share best practices and lessons learned at local and national conferences and with national advocacy organizations. Lastly, the partnership is collaborating with the City Commission of Lake Worth to develop an Urban Land Use Plan that will include changes to zoning regulations and the comprehensive plan, and recommendations for urban agriculture.
COMMUNITY AND SCHOOL GARDENS
14
PALM BEACH COUNTY’S HEALTHY KIDS, HEALTHY COMMUNITIES PARKS AND PLAY SPACES The partnership collaborated with the Palm Beach County Parks and Recreation Department and several local organizations to increase opportunities for healthy eating and active living in parks and play spaces. Policy, Practice, and Environmental Changes The following policy, practice, and environmental changes occurred as a result of HKHC: Tropical Ridge Fitness Park The City Commission approved a zoning change from residential to recreational for the Tropical Ridge Fitness Park site in 2011. In October 2012, the Tropical Ridge Fitness Park was created to provide physical activity opportunities to residents of Lake Worth. Nine outdoor fitness stations were installed at the park. Signs were developed and installed in the park to explain the importance of physical activity and the use of the machines.
Photo provided by the Palm Beach County Healthy Kids, Healthy Communities.
Palm Beach County Parks and Recreation Vending Policy The partnership supported Palm Beach County Parks and Recreation Department with the adoption of a vending machine policy in November 2012 that required the contractor to provide healthier options. Spillway Park Park benches, waste receptacles, and pet waste stations were installed at the park in 2010. In 2011, a walking trail was developed at Spillway Park in partnership with College Park Neighborhood Association and the Recreation Division of Lake Worth. For additional information see Figure 3: Parks and Play Spaces Infographic. Complementary Programs/Promotions A grand opening ceremony was held for the Tropical Fitness Zone on November 14, 2012. Local officials spoke during the ceremony, free glucose screenings and risk tests were provided, and health education and exercise tips were distributed.7 Implementation Tropical Ridge Fitness Park To increase physical activity among residents in Lake Worth, the Tropical Ridge Fitness Park was built. The idea of a Fitness Zone was first introduced to ACHIEVE by the Parks and Recreation Department before HKHC, but never moved forward due to lack of funding and undecided priorities. Since receiving HKHC funds, the City of Lake Worth approved the development of the Tropical Ridge Fitness Park on city-owned land located at 211 and 214 North H Street. In November 2011, the City Commission approved a zoning change for the land from residential to recreational, and a Special Land Use permit was signed. Several organizations and paid staff assisted with the planning process, including Lake Worth Community Before and after photos provided by the Redevelopment Agency, Trust for Public Land, the Health Palm Beach County Healthy Kids, Healthy Department and Planning and Zoning Departments. Other Communities. organizations, including the Police Department, provided support. The PARKS AND PLAYSPACES
15
PALM BEACH COUNTY’S HEALTHY KIDS, HEALTHY COMMUNITIES Figure 3: Parks and Play Spaces Infographic
PARKS AND PLAY SPACES
16
PALM BEACH COUNTY’S HEALTHY KIDS, HEALTHY COMMUNITIES park was designed by the Trust for Public Health Land using similar layouts as parks found in Miami-Dade and Pinellas Counties. Sixty-five thousand dollars worth of outdoor fitness equipment was installed in October 2012, which was paid for by the Lake Worth Community Redevelopment Agency, the Quantum Foundation, Trust for Public Land, Wells Fargo, and the Palm Healthcare Foundation. The equipment included chin-up bars, a cross-country ski machine, an elliptical walker, and a chest press anchored on a concrete pad. The machines used the person’s weight for resistance. In addition, signs, written in English, Spanish, and Creole, were installed in the park to explain the importance of exercise. Several partners participated in a planting day to prepare for the park’s grand opening. The grand opening was held on November 14, 2012. Walking Trail at Spillway Park A partnership was created in 2010 with the Office of Community Revitalization, The College Park Neighborhood Association, and the City of Lake Worth to install a walking trail at Spillway Park. The mulch path was installed in 2011. Population Reach The park and play space initiative was focused on various populations in Palm Beach County. The Tropical Ridge Fitness Park was developed for residents aged 14 years and older in the City of Lake Worth. The walking trail at Spillway Park and NatureGrounds play space was developed for residents of Lake Worth. The vending machine policy was targeted to individuals and families residing in Palm Beach County. Challenges During planning and implementation, the partnership experienced some challenges. Approval processes were difficult and slow, such as the zoning changes and approval from the School District’s Risk Management Department. Initially there was a debate about the zoning change for the Tropical Ridge Fitness Park being rejected among residents; however only one person raised an issue and the plan was passed. There was some confusion around costs of building the Fitness Park. Other models (e.g., California) bought fitness equipment in bulk to get a discounted price. The partnership tried to coordinate with another Florida city, but the timing did not work. As a result, the equipment was purchased individually at full price. Other challenges during the planning phase were issues concerning insurance liability and consensus on who would maintain the park. Lastly, the Palm Beach County Parks and Recreation Department received little support from the community with the new vending policy. Sustainability Tropical Ridge Fitness Park The City of Lake Worth agreed to maintain the Tropical Ridge Fitness Park. Maintenance included mowing, cleaning, and emptying trash cans. The Community Redevelopment Agency was working to purchase a house adjacent to the park with plans to expand the site. In addition, the Community Redevelopment Agency received a KABOOM! grant to fund playground equipment at the park for younger children.
PARKS AND PLAY SPACES
17
PALM BEACH COUNTY’S HEALTHY KIDS, HEALTHY COMMUNITIES Joint Use To increase access to physical activity amenities, the partnership focused their efforts on increasing public joint-use agreements. Several fee-for-use joint use agreements were in place throughout the county before HKHC. The agreements were mainly between schools and private organizations (e.g., Boys and Girls Club, churches), which required permission from the principal or director. Policy, Practice, and Environmental Changes The following policy, practice, and environmental changes occurred at Berkshire Elementary School: The county’s first public joint use agreement with Berkshire Elementary School was approved in December 2012. Also, in December 2012, a fence was installed between the closed and open area. A walking trail was installed and opened to the public in October 2013. Complementary Programs/Promotions Implementation The partnership planned to create joint use agreements to increase physical activity opportunities for residents of Lake Worth, Greenacres, and Palm Springs. Sites were to be prioritized based on community interest, availability and accessibility of the property, proximity to a school, security of the school or area, and the need for improvements. Berkshire Elementary The partnership in collaboration with the Palm Beach County School District worked to develop the first public joint use agreement at Berkshire Elementary School. HKHC staff and partners went door-to-door to ask community residents for support on the project. In 2011, a grant for $20,000 was received from the Palm Beach County Office of Community Revitalization to install a walking trail on the campus of Berkshire Elementary School to Photo provided by community partnership. be used as part of the agreement. The funding had allowed the partnership to secure additional support that was needed to move the project forward. The Palm Beach County School Board and the Palm Beach County Government approved the agreement in December 2012, which opened the field area on Berkshire Elementary campus. The Law Enforcement Trust Fund provided funds to install a fence, a new gate, and a security camera for safety. The Kiwanis Foundation also provided funding for the fence. The fence was installed after the agreement was approved to help distinguish between the private and public area of the land.
Photo provided by community partnership.
The trail was installed and opened to the public in October 2013. Approximately 150 people attended the event.
The trail was opened for students during the day and for the public on weekends and holidays. The school’s custodian had been responsible for locking and unlocking the area. Population Impact Historically, communications were sparse between school departments, but relationships were beginning to develop. The change allowed for a greater understanding and cooperation among departments, aiding the PARKS AND PLAY SPACES
18
PALM BEACH COUNTY’S HEALTHY KIDS, HEALTHY COMMUNITIES agenda of several strategies, (e.g., joint use agreements). Challenges The partnership identified a few challenges to planning and implementing joint use agreements:
“all of a sudden we’ve got the planning department, the risk and safety department..[...]..and we are kind of mutually working together on a lot of projects… […]...but by bringing us all together, it’s created a significant amount of communication amongst the departments…” -Partner
The process and approval of joint use agreements in schools had been a struggle, especially since each individual principal made final decisions. Although this allowed each school to have a personalized or tailored approach, it also complicated efforts to streamline a process. The potential of influencing policy around joint use agreements would have been greater at the district level. Some schools, such as Highland Elementary and Lake Worth Middle, expressed an interest in developing walking trails for community use. However, the land around the schools was not ideal, and steep grades would require a cost-prohibitive ramp. The partnership had been working to establish legislative policy changes to reduce liability in joint use agreements with schools. Thus far, the efforts had been unsuccessful. Due to lack of lighting, the walking trail was only open during daylight hours. Sustainability The Berkshire walking trail will continue to be maintained by the school district. The school’s custodian or other identified staff will open and close the area on weekends for the public. The partnership will continue pursuing public joint use agreements using the criteria mentioned previously. There are plans to work with Lake Worth Middle School in the future.
PARKS AND PLAY SPACES
19
PALM BEACH COUNTY’S HEALTHY KIDS, HEALTHY COMMUNITIES ACTIVE TRANSPORTATION The partnership collaborated with school and government organizations to increase opportunities for active transportation in Palm Beach County. Policy, Practice, and Environmental Changes The following policy, practice, and environmental changes occurred as the result of HKHC: A bike rack and concrete pad were installed at Forest Hill High School in 2012. One bike trailer was donated for use in 16 elementary schools, two within the target area. In 2012, the Palm Beach Metropolitan Planning Organization approved and adopted a Master Comprehensive Bicycle Transportation Plan that integrated bicycling into Palm Beach County’s transportation system. Complementary Programs/Promotions Bike safety training was hosted for students by the University of Florida and the School District of Palm Beach County in 2011. The trainings lasted approximately 3 to 4 weeks and were embedded into physical education classes. One Walking School Bus was adopted in 2012 at Berkshire Elementary School with the Palm Beach County Department of Health, but little progress was made, because the person in charge separated). Due to lack of partner support and an unwillingness on Photo provided by the Palm Beach County behalf of the School District to promote walking to school based on Healthy Kids, Healthy Communities liability issues, the development of additional Walking School Buses was not complete. The partnership hoped to create an informal policy partnership of “Walking Wednesdays.” Implementation Bike Rack Students enrolled at Forest Hill High School often rode their bikes to school, but had no where to store them during the day. Funds to install a bike rack were provided by Palm Healthcare Foundation. The city’s recycling department provided staff to move trees that were in the way before construction started. The rack and a concrete pad were installed in 2012. Bike Trailer The partnership secured one bike trailer that would be used for several elementary schools. The trailer was used to transport 30 bikes to the schools to promote bike safety. The trailer and bikes were available to each school for a 3- to 6-week period. Physical education teachers used the bikes as part of a curriculum, although not all components included the use of the trailer. Youth in Kindergarten to 2nd grade participated in a walking program, while 3rd through 7th graders participated in the bike program. Population Reach The Safe Routes to School initiative was targeted toward youth in the Palm Beach County School District. Challenges The partnership identified challenges to planning and implementing active transportation opportunities: Many schools in the Palm Beach County School District were surrounded by busy roads creating an unsafe environment for youth walking to school. ACTIVE TRANSPORTATION
20
PALM BEACH COUNTY’S HEALTHY KIDS, HEALTHY COMMUNITIES The Florida Department of Transportation Safe Routes to School grant did not cover expensive infrastructure changes. Safety was a major concern to the community, especially since infrastructure was not adequate for active transportation. Some schools lacked pick-up lanes or efficient carpool systems, which led to high levels of traffic and unsafe conditions for those walking. Budget cuts and lack of funds prevented schools from hiring crossing guards. Sustainability The partnership applied for and received funding ($291,000) to get four more bike trailers that would be school and community based. Teachers will continue to be trained on how to incorporate bikes into the school’s physical education curriculum. In addition, Transportation Enhancement Funds ($750,000) were received from the Florida Department of Transportation to develop a greenway at 5th Avenue South in Lake Worth. The project, a Naturegrounds park, was planned but the funding was less than anticipated. Therefore, funding was used for the Fitness Zone playground and the 5th Avenue South project. Long cooridors will continue to be used throughout the city to create linear parks and greenways to enhance transportation and improve greenery.
ACTIVE TRANSPORTATION
21
PALM BEACH COUNTY’S HEALTHY KIDS, HEALTHY COMMUNITIES SUSTAINABILITY OF THE PARTNERSHIP AND INITIATIVE The partnership is working on plans to sustain the initiatives past HKHC. One main goal is to identify funding to support the Project Coordinator’s time so that she can continue to work on improving healthy eating and active living in Palm Beach County. The partnership had started to apply and secure additional grant funding for the project: A grant for $200,000 from the Ferris Foundation was submitted, which would pay for the development of community gardens, specifically in Glades, Lake Worth, and Vero Beach. Additional funding was applied for and received by one of the current community gardens. Several partners and funders will continue to be engaged past the grant period, including major funders, Palm Health Care and Quantum Foundations.
SUSTAINABILITY OF THE PARTNERSHIP AND INITIATIVE
22
PALM BEACH COUNTY’S HEALTHY KIDS, HEALTHY COMMUNITIES REFERENCES 1. Healthy Kids, Healthy Communities National Program Office. Home and About. 2009. . Accessed January 10, 2014 2. United States Census Bureau. QuickFacts. 2010. . Accessed January 10, 2014. 3. Healthy Kids, Healthy Communities. Lake Worth-Greenacres-Palm Springs, FL. 2013. . Accessed February 15, 2014. 4. School District of Palm Beach County. 2009. . Acccessed February 15, 2014. 5. Palm Beach County Healthy Kids, Healthy Communities. Healthy Kids, Healthy Communities Proposal. 2008. Accessed February 15, 2014. 6. Federal Bureau of Investigation. Crime Statistics. 2012. . Accessed February 5, 2014. 7. Lake Worth Community Redevelopment Agency. 2010. . Accessed February 15, 2014. 8. Palm Beach Post. . Accessed February 15, 2014.
REFERENCES
23
PALM BEACH COUNTY’S HEALTHY KIDS, HEALTHY COMMUNITIES APPENDIX A: EVALUATION LOGIC MODEL HEALTHY EATING AND ACTIVE LIVING STRATEGIES In the first year of the grant, this evaluation logic model identified short-term, intermediate, and long-term community and system changes for a comprehensive evaluation to demonstrate the impact of the strategies to be implemented in the community. This model provided a basis for the evaluation team to collaborate with the Palm Beach County’s Healthy Kids, Healthy Communities partnership to understand and prioritize opportunities for the evaluation. Because the logic model was created at the outset, it does not necessarily reflect the four years of activities implemented by the partnership (i.e., the workplans were revised on at least an annual basis). The healthy eating and active living strategies of Palm Beach County’s Healthy Kids, Healthy Communities included: Community and School Gardens: To increase access to fruits and vegetables, the partnership collaborated with the Palm Beach County Cooperative Extension, local organizations, and community residents to establish over 20 school and community gardens. Parks and Play Spaces: The partnership worked with Palm Beach County Parks and Recreation Department to increase opportunities for healthy eating and active living in parks and play spaces through the development of the Tropical Ridge Fitness Park, improvements to Spillway Park, creation of a NatureGrounds park, and adoption of a vending machine policy. Joint Use: To increase access to physical activity facilities, the partnership focused on creating a joint use agreement with Berkshire Elementary. As part of the agreement, a walking trail and fence were installed to be used by the students and community. Active Transportation: The partnership worked to increase opportunities for active transportation in the community by installing a bike rack, purchasing a bike trailer, and supporting the adoption of a Master Comprehensive Bicycle Transportation Plan.
APPENDICES
24
PALM BEACH COUNTY’S HEALTHY KIDS, HEALTHY COMMUNITIES APPENDIX A: EVALUATION LOGIC MODEL
APPENDICES
25
PALM BEACH COUNTY’S HEALTHY KIDS, HEALTHY COMMUNITIES APPENDIX B: PARTNERSHIP AND COMMUNITY CAPACITY SURVEY RESULTS Partnership and Community Capacity Survey To enhance understanding of the capacity of each community partnership, an online survey was conducted with project staff and key partners involved with the Lake Worth/Green Acres/Palm Springs Healthy Kids, Healthy Communities partnership during the final year of the grant. Partnership capacity involves the ability of communities to identify, mobilize, and address social and public health problems.1-3 Methods Modeled after earlier work from the Prevention Research Centers and the Evaluation of Active Living by Design,4 an 82-item partnership capacity survey solicited perspectives of the members of the Lake Worth/ Green Acres/Palm Springs Healthy Kids, Healthy Communities partnership on the structure and function of the partnership. The survey questions assisted evaluators in identifying characteristics of the partnership, its leadership, and its relationship to the broader community. Questions addressed respondents’ understanding of Lake Worth/Green Acres/Palm Springs Healthy Kids, Healthy Communities partnership in the following areas: structure and function of the partnership, leadership, partnership structure, relationship with partners, partner capacity, political influence of partnership, and perceptions of community members. Participants completed the survey online and rated each item using a 4point Likert-type scale (strongly agree to strongly disagree). Responses were used to reflect partnership structure (e.g., new partners, committees) and function (e.g., processes for decision making, leadership in the community). The partnership survey topics included the following: the partnership’s goals are clearly defıned, partners have input into decisions made by the partnership, the leadership thinks it is important to involve the community, the partnership has access to enough space to conduct daily tasks, and the partnership faces opposition in the community it serves. The survey was open between September 2013 and December 2013 and was translated into Spanish to increase respondent participation in predominantly Hispanic/Latino communities. To assess validity of the survey, evaluators used SPSS to perform factor analysis, using principal component analysis with Varimax with Kaiser Normalization (Eigenvalue >1). Evaluators identified 15 components or factors with a range of 1-11 items loading onto each factor, using a value of 0.4 as a minimum threshold for factor loadings for each latent construct (i.e., component or factor) in the rotated component matrix. Survey data were imported into a database, where items were queried and grouped into the constructs identified through factor analysis. Responses to statements within each construct were summarized using weighted averages. Evaluators excluded sites with ten or fewer respondents from individual site analyses but included them in the final cross-site analysis. Findings Structure and Function of the Partnership (n=5 items) A total of 20 individuals responded from Lake Worth/Green Acres/Palm Springs Healthy Kids, Healthy Communities partnership. Of the sample, 15 were female (75%) and 4 were male (20%). One respondent did not indicate if he/she was a male or female (5%). Respondents were between the ages of 26-45 (6, or 30%), or 46-65 (13, or 65%). One respondent did not specify his/her age (5%). Survey participants were also asked to provide information about race and ethnicity. Respondents identified with one or more from the following race and ethnicity categories: African American, American Indian/Alaskan Native, Asian, Native Hawaiian/ Pacific Islander, White, Other race, Hispanic or Latino, Not Hispanic or Latino, Ethnicity unknown/unsure, or Refuse to provide information about race or ethnicity. Of the 19 responses, 79% were White, 5% were African America, 11% were Hispanic/Latino, and 5% were Not Hispanic or Latino. No other races or ethnicities were identified. Respondents were asked to identify their role(s) in the partnership or community. Of the 21 identified roles, two were representative of the Community Partnership Lead (10%) and seven were Community Partnership Partners (33%). One respondent self-identified as a Community Leader (4%), and four as Community Members (19%). Two respondents self-identified as Public Officials (10%). Finally, five respondents APPENDICES
26
PALM BEACH COUNTY’S HEALTHY KIDS, HEALTHY COMMUNITIES APPENDIX B: PARTNERSHIP AND COMMUNITY CAPACITY SURVEY RESULTS identified their role as Other (24%). Individuals participating in the survey also identified their organizational affiliation. Fifty percent of respondents (n=10) indicated affiliation to a school (district, elementary, middle, high), while four (20%) claimed affiliation to a local governmental agency (city, county). Three respondents (15%) self-identified with having affiliation with a university or research/evaluation organization. Ten percent of respondents (n=2) indicated affiliation to a neighborhood association. One respondent (5%) claimed to have affiliation with other type(s) of organization(s) not listed as response options. No respondents associated to faith or community based organizations, advocacy organizations, health care organizations, or childcare/afterschool organizations. Leadership (n=8 items) All responses showed agreement or strong agreement (100% total) to statements suggesting that the partnership had an established group of core leaders who had the skills to help the partnership achieve its goals. Responses also indicated that participants in the survey felt the core leadership is organized and retains the skills to help the partnership and its initiatives succeed. Most respondents (99%) strongly agreed or agreed that leaders worked to motivate others, worked with diverse groups, showed compassion, and strived to follow through on initiative promises. One percent disagreed that leaders worked to motivate others, worked with diverse groups, showed compassion, and strived to follow through on initiative promises. Responses to the survey showed at least one member of the leadership team lived in the community (95% agree/strongly agree), but 5% of respondents were not sure. When asked if they agreed with statements suggesting that at least one member of the leadership team retained a respected role in the community, 100% of respondents agreed or strongly agreed. Partnership Structure (n=24 items) A majority of the respondents generally felt that the partnership adequately provided the necessary in-kind space, equipment and supplies for partners to conduct business and meetings related to partnership initiatives (79% agree/strongly agree). Yet, 16% felt unsure provision of space and equipment was sufficient. Five percent of participants did not respond. Most (89%) also agreed that the partnership has processes in place for dealing with conflict, organizing meetings, and structuring goals, although 10% responded “I don’t know”, indicating a lack of familiarity in this area, and 1% felt these processes were not established. Partnership members (leadership and partners) were generally perceived by respondents to be involved in other communities and with various community groups, bridging the gaps between neighboring areas and helping communities work together (91%), though 4% did not know and 5% did not respond. Though the majority (81%) of respondents indicated agreement with statements about the partnership’s effectiveness in seeking learning opportunities, developing the partnership, and planning for sustainability, 10% of responses disagreed, and 9% were not aware of partnership activities specific to development and sustainability. Relationship with Partners (n=4 items) One-hundred percent of responses to statements about leadership and partner relationships were positive (agree/strongly agree), indicating that the majority of respondents felt the partners and leadership trusted and worked to support each other. Partner Capacity (n=18 items) Nearly all responses (95% agree/strongly agree) indicated that respondents felt partners possess the skills and abilities to communicate with diverse groups of people and engage decision makers (e.g., public officials, community leaders). Furthermore, 82% of individuals responding to the survey felt that partners were dedicated to the initiative, interested in enhancing a sense of community, and motivated to create change. Political Influence of Partnership (n=2 items) Respondents felt that the leadership is visible within the community, with 93% of responses supporting statements that the leadership is known by community members and works directly with public officials to promote partnership initiatives. 27
PALM BEACH COUNTY’S HEALTHY KIDS, HEALTHY COMMUNITIES APPENDIX B: PARTNERSHIP AND COMMUNITY CAPACITY SURVEY RESULTS Perceptions of Community and Community Members (n=22 items) Statements suggesting that the community was a good place to live, with community members who share the same goals and values, help each other, and are trustworthy were supported by 84% of survey responses, while 5% of respondents disagreed and 10% indicated a lack of knowledge about these community attributes. One percent did not respond. Respondents also strongly supported suggestions that community members help their neighbors, but may take advantage of others if given the opportunity (95% agree/strongly agree). In general, respondents were convinced that community members would intervene on behalf of another individual in their community in cases of disrespect, disruptive behavior, or harmful behavior. While 70% agreed/strongly agreed, 22% disagreed/strongly disagreed. Eight percent of responses indicated that some respondents did not know how community members would act in these situations. Most survey participants (90%) felt community members were aware of the partnership’s initiatives and activities. The majority of respondents (80%) agreed that the partnership equally divides resources among different community groups in need (e.g., racial/ethnic minorities, lower-income), 20% disagreed. Overall, respondents agreed or strongly agreed that partners and members of the community maintained active involvement in partnership decisions and activities (95%), and also agreed that partners and residents have the opportunity to function in leadership roles and participate in the group decision-making process (90%). References 1. Goodman RM, Speers MA, McLeroy K, et al. Identifying and defining the dimensions of community capacity to provide a basis for measurement. Health Educ Behav. Jun 1998;25(3):258-278. 2. Israel BA, Schulz AJ, Parker EA, Becker AB. Review of community-based research: assessing partnership approaches to improve public health. Annu Rev Public Health. 1998;19:173-202. 3. Roussos ST, Fawcett SB. A review of collaborative partnerships as a strategy for improving community health. Annu Rev Public Health. 2000;21:369-402. 4. Baker E, Motton F. Is there a relationship between capacity and coalition activity: The road we’ve traveled. American Public Health Association 131st Annual Meeting. San Francisco, CA; 2003.
APPENDICES
28
PALM BEACH COUNTY’S HEALTHY KIDS, HEALTHY COMMUNITIES APPENDIX B: PARTNERSHIP AND COMMUNITY CAPACITY SURVEY RESULTS
APPENDICES
29
PALM BEACH COUNTY’S HEALTHY KIDS, HEALTHY COMMUNITIES APPENDIX B: PARTNERSHIP AND COMMUNITY CAPACITY SURVEY RESULTS
APPENDICES
30
PALM BEACH COUNTY’S HEALTHY KIDS, HEALTHY COMMUNITIES APPENDIX B: PARTNERSHIP AND COMMUNITY CAPACITY SURVEY RESULTS
APPENDICES
31
PALM BEACH COUNTY’S HEALTHY KIDS, HEALTHY COMMUNITIES APPENDIX B: PARTNERSHIP AND COMMUNITY CAPACITY SURVEY RESULTS
APPENDICES
32
PALM BEACH COUNTY’S HEALTHY KIDS, HEALTHY COMMUNITIES APPENDIX C: PALM BEACH COUNTY HEALTHY KIDS, HEALTHY COMMUNITIES PARTNERS Members of the Palm Beach County Healthy Kids, Healthy Communities Partnership Organization/Institution Partner Amelia’s Smarty Plants Business/Industry/ Lowe’s Commercial Sales Department Commercial The Breakers Guatemalan-Mayan Center Civic Organizations Kiwanis Club Trust for Public Land College/University University of Florida - Florida Agriculture in the Classroom Community Residents Parents and Youth City of Greenacres City of Lake Worth City of Lake Worth Community Sustainability Department City of Lake Worth Department of Public Services, Recreation Division City of Lake Worth Planning and Zoning Governor’s Council for Community Health Partnerships Institute for Food & Agricultural Services, Cooperative Extension Office of Community Revitalization Government Palm Beach County Board of County Commissioners Palm Beach County Department of Parks & Recreation Palm Beach County Department of Planning & Zoning Palm Beach County Government Palm Beach County Health Department Palm Beach County Metropolitan Planning Department Palm Beach County Sheriff’s Office Therapeutic Recreation Center, Lake Worth Village of Palm Springs Elected/Appointed Officials Lake Worth Community Redevelopment Agency Adopt-A-Family of the Palm Beaches, Inc. Bridges Beacon Center Other Community-Based College Park Neighborhood Association Organizations For the Children, Lake Worth Memory Trees Palm Beach Harvest Scottish Rite Masonic Center Faith-Based Organization Policy/Advocacy Organization Foundations School
Palm Beach County Children’s Services Council Palm Health Care Foundation, Inc. Quantum Foundation Palm Beach County School District*
*Lead agency
APPENDICES
33
PALM BEACH COUNTY’S HEALTHY KIDS, HEALTHY COMMUNITIES APPENDIX D: SOURCES AND AMOUNTS OF FUNDING LEVERAGED
APPENDICES
34
PALM BEACH COUNTY’S HEALTHY KIDS, HEALTHY COMMUNITIES APPENDIX D: SOURCES AND AMOUNTS OF FUNDING LEVERAGED
APPENDICES
35
PALM BEACH COUNTY’S HEALTHY KIDS, HEALTHY COMMUNITIES APPENDIX D: SOURCES AND AMOUNTS OF FUNDING LEVERAGED
APPENDICES
36
PALM BEACH COUNTY’S HEALTHY KIDS, HEALTHY COMMUNITIES APPENDIX D: SOURCES AND AMOUNTS OF FUNDING LEVERAGED
APPENDICES
37
PALM BEACH COUNTY’S HEALTHY KIDS, HEALTHY COMMUNITIES APPENDIX E: PARKS AND PLAY SPACES DIRECT OBSERVATION REPORT
APPENDICES
38
Palm Beach County’s Healthy Kids, Healthy Communities Initiative
Parks and Recreation Direct Observation
Summary Report
Prepared by Transtria LLC
1
Table of Contents Background................................................................................................................................. 2 Methods ...................................................................................................................................... 2 Results ........................................................................................................................................ 4 Appendix A: Parks and Recreation Direct Observation Tool........................................................ 9
2
BACKGROUND Healthy Kids, Healthy Communities (HKHC) is a national program of the Robert Wood Johnson Foundation (RWJF) whose primary goal is to implement healthy eating and active living policy, system, and environmental change initiatives that can support healthier communities for children and families across the United States. Healthy Kids, Healthy Communities places special emphasis on reaching children who are at highest risk for obesity on the basis of race/ethnicity, income, and/or geographic location. Palm Beach County, Florida was selected as one of 49 communities to participate in HKHC, and the School District of Palm Beach County is the lead agency for their community partnership, Healthy Kids, Healthy Communities: Lake Worth-Greenacres-Palm Springs. Palm Beach County has chosen to focus its work on school and community gardens, Safe Routes to School, joint-use, and parks and recreation. Transtria LLC, a public health evaluation and research consulting firm located in St. Louis, Missouri, is funded by the Robert Wood Johnson Foundation to lead the evaluation and dissemination activities from April 2010 to March 2014. For more information about the evaluation, please visit www.transtria.com. In order to better understand the impact of their work in parks and recreation, partnership representatives chose to participate in the enhanced evaluation data collection activities. This supplementary evaluation focuses on the six cross-site HKHC strategies, including: parks and play spaces, active transportation, farmers’ markets, corner stores, physical activity standards in childcare settings, and nutrition standards in childcare settings. Communities use two main methods as part of the enhanced evaluation, direct observation and environmental audits. Palm Beach County chose to collect data on parks and recreation using the direct observation method. METHODS Parks and Play Spaces Direct Observation The parks and play spaces direct observation tool was adapted from the System for Observing Play and Leisure Activity (SOPLAY) and System for Observing Play and Recreation in Communities (SOPARC) tools, protocols, and operational definitions. Direct observation is a method used to assess individuals’ behaviors in their natural setting. An Evaluation Officer from Transtria LLC trained representatives of Palm Beach County’s community partnership on proper data collection methods using the tool. Data were collected on eight different days in the spring of 2013 between March 22 and June 3, at the Palm Beach County Tropical Ridge Fitness Park. The dates included March 22, March 24, March 30, April 2, May 19, May 21, June 1, and June 3. The months of March and April fall into Florida’s dry season, while May and June mark the beginning of the wet season. Observations were conducted three different times (morning, afternoon, evening) on each day. Morning observations occurred between 8:00 a.m. and 8:36 a.m.; afternoon observations occurred between 2:42 p.m. and 3:36 p.m.; and evening observations occurred between 5:55 p.m. and 6:42 p.m. The observations were conducted by two different observers. Observers worked independently across all observation periods, with the exception of two dates (May 19 and 21), when they worked together. Observers collected data for 24 to 34 minutes per park per day. For the duration of each observation period, observers scanned the play space for one minute and 3
recorded observations for one minute. Each observation represents an individual’s activity level in the area at the specified time. Because individuals may have exited and re-entered the area during observation periods, the individuals observed in each time period were not the same. This method allowed observers to capture overall changes in activity level as time lapsed, but it did not allow observers to record individual behavior changes. During the scan, the observer completed the observation tool by tallying individuals in the designated area by age group (i.e., children = 3-12 years; adolescents = 13-18 years; adults = 19+ years) and activity level (i.e., sedentary, moderate, or very active behaviors). Sedentary behaviors are defined as activities in which individuals are not moving (e.g., standing, sitting, playing board games). Moderate intensity behaviors require more movement but no strenuous activity (e.g., walking, biking slowly). Very active behaviors show evidence of increased heart rate and inhalation rate (e.g., running, biking vigorously, playing basketball). Observers also reported the activity codes for the individuals in the designated area, including: No Identifiable Activity Dance Racquet Sports Playground Games
Aerobics Football Soccer Walking
Baseball/Softball Gymnastics Swimming Jogging/Running Volleyball
Basketball Martial Arts Weight Training None of the Above Biking
The activity code “No Identifiable Activity” was used to indicate no movement. The activity code “None of the Above” was used when an individual was engaging in an activity not included in the other activity codes. In addition to recording individuals’ activity levels, observers created maps of the parks. The maps included a form for the setting, location, type of park area, condition of the area, any permanent modifications (the specific permanent alterations present that assist individuals in participating in physical activity such as lines painted on courts or basketball poles and nets; this does not include temporary improvements such as chalk lines and portable nets.), the presence of overlap modifications (e.g., the space has multiple improvements that overlap but cannot be used simultaneously such as a space that is used for both volleyball and basketball), and the surface type (e.g., gravel, grass). One Transtria staff member entered the data and a second Transtria staff member conducted validity checks on 10% of observations (i.e., every tenth observation) to ensure accuracy and validity of the data. Of the 10% checked, no errors were found among the 343 observations (100% correct). RESULTS In order to better compare the data collected in the dry and wet seasons, the rate of activity (activity counts per hour) was calculated for the park. Number of activity counts Total number of observation periods
X 60 (minutes per hour)
4
Weather conditions varied across the dates and times observed at the Tropical Ridge Fitness Park. The conditions ranged from sunny and hot to cloudy, cool, and wet. No precipitation was recorded during the dry months, although once it was cloudy and puddles were noted under the equipment. Rain was observed during the wet months, specifically on May 21 (morning) and June 1 (afternoon, evening). The overall range of observation periods per session was between 13 and 18. A total of 343 observations periods were collected from March to June of 2013. During the dry season (March and April) a total of 167 observation periods were captured, while 176 observation periods were completed in the wet season (May and June). There were more time periods of data collection (176) and more activity counts (265) observed in the wet season. There were a total of 496 activity counts recorded during all time periods; however, this does not indicate that there were 496 unique individuals observed. A person counted during the first minute of scanning is also counted during the fifth minute of scanning if that person is still in the park area. It is likely that the unique number of individuals observed in a park is a small fraction of the number of activity counts recorded for each park. Activity counts often represent repetitive observations of the same individual. Dry Season A total of 231 activity counts per hour were recorded in the dry season during 167 observation periods. As seen in Table 1, over two-thirds (70%) of the observed activity counts rated in the dry season were of adults. Adolescents and children made up the remainder of observations (16% and 14%, respectively). Table 1. Dry Season - Activity Level by Age per Hour (n=83.0) Age Sedentary (%) Moderate (%) Very Active (%) Total (%) Children 0 (0%) 3.2 (4%) 8.6 (10%) 11.9 (14%) Adolescents 7.2 (9%) 3.6 (4%) 2.2 (3%) 12.9 (16%) Adults 19.8 (24%) 26.9 (32%) 11.5 (14%) 58.2 (70%) Total 26.9 (32%) 33.8 (41%) 22.3 (27%) 100% Activity Levels by Age Overall, observed activity in the dry season was most commonly coded as moderate (41%), followed by sedentary (32%) and then very active (27%). Shown in Figure 1, adults most frequently were observed be moderately active (32%), followed by sedentary (24%), and then very active (14%). Children were more likely (10%) than adolescents (3%) to participate in very active behavior; conversely, adolescents were reported slightly more (4%) than children (4%) to participate in moderate behavior. No children were rated as participating in sedentary activity.
5
Figure 1: Dry Season Activity Level by Age per Hour 35% 30% 25% 20% 15% 10% 5% 0%
32% 24% Children 14% 9% 4% 4%
10% 3%
Adolescents Adults
0% Sedentary
Moderate
Very Active
Types of Activities by Age Data collectors recorded types of activities they observed during the dry season using activity codes. Table 2 describes the activity codes seen in the dry season during all 167 observation periods. The activity codes aerobics and weight training were observed in all three age groups. Adults were observed participating in the widest variety of activities compared to children and adolescents. Table 2: Dry Season Activity Codes Observed by Age Activity Children Adolescents Adults No identifiable activity absent present present Aerobics present present present Weight training present present present Walking absent absent present Jogging/Running present absent present Key Takeaways The age group most observed during the dry season in Tropical Ridge Fitness Park was adults (70%). Moderate activity levels were observed most frequently (41%) than sedentary (32%) and very active (27%) across all age groups. No children were reported as participating in sedentary activity. Children, adolescents, and adults were all observed participating in aerobics and weight training.
Wet Season A total of 265 activity counts per hour were recorded in the wet season during 176 observation periods. Shown in Table 3, all of the observations rated in the wet season were comprised of adults.
6
Table 3: Wet Season - Activity Level by Age per Hour (n=90.3) Age Sedentary Moderate Very Active Total Children Adolescents Adults Total
36.1 (40%) 36.1 (40%)
17.4 (19%) 17.4 (19%)
36.8 (41%) 36.8 (41%)
100% 100%
Activity Levels by Age Overall, adults were most commonly observed engaging in sedentary (40%) and very active (41%) behavior. Nineteen percent of adults were observed participating in moderate behavior. Types of Activities by Age Data collectors recorded types of activities they observed during the wet season using activity codes. Table 4 describes the activity codes seen in the wet season during all 265 observation periods. The activity codes no identifiable activity, aerobics, martial arts, weight training, other playground games, and walking were observed. Table 4: Wet Season Activity Codes Observed by Age Activity Adults No identifiable activity present Aerobics present Martial Arts present Weight training present Other playground games present Walking present Key Takeaways Adults were most commonly observed in sedentary (40%) and very active (41%) behavior. No adolescents or children were observed in Tropical Ridge Fitness Park in the wet season. Adults participated in a wide variety of activities, including: aerobics, martial arts, walking, weight training, other playground games, and other activities not specifically captured.
Comparison Activity Level Observations When comparing the two seasons observed at Tropical Ridge Fitness Park (Table 5), the wet season had higher rates of very active (41%) and sedentary (40%) observations per hour compared to the dry season
Table 5: Overall Activity Level by Season per Hour Activity Level Dry n=83.0 (%) Wet n=90.3 (%) Sedentary 26.6 (32%) 36.1 (40%) Moderate 34.0 (41%) 17.2 (19%) Very Active 22.4 (27%) 37.0 (41%) 7
(27%, 32%, respectively). However, there were twice as many observations rated per hour as moderately active (41%) in the dry season than the wet season (19%). Table 6 shows the number of observations rated per hour in the dry season and the wet season. A total of 83.0 observations were rated per hour during the dry season. By contrast, 90.3 observations were rated per hour during the wet season. Adults were the only age group observed during both seasons; they comprised 70% of the observations during the dry season and 100% of the observations during the wet season. The number of adults observed in the park increased by over a third (36%) from the dry season (n = 58.2) to the wet season (n = 90.3). Table 6: Activity Level by Age per Hour Dry Season (n=83.0) Age Sedentary Moderate Children 0.0 (0%) 3.2 (4%) Adolescents 7.2 (9%) 3.6 (4%) Adults 19.8 (24%) 26.9 (32%) Wet Season (n=90.3) Age Sedentary Moderate Adults 36.1 (40%) 17.4 (19%)
Very Active 8.6 (10%) 2.2 (3%) 11.5 (14%)
Total 11.9 (14%) 12.9 (16%) 58.2 (70%)
Very Active 36.8 (41%)
Total 90.3 (100%)
Activity Level by Season – Adults Displayed in Figure 2, the majority of adults observed during the dry season were rated as moderate (46%), whereas adults during the wet season were less likely to be rated as moderate (19%). In contrast, adults were equally likely to be rated as sedentary (40%) and very active (41%) in the wet season.
Figure 2: Adult Activity Level by Season per Hour 50% 40%
46%
40%
41%
34%
Sedentary
30% 20%
19%
20%
Moderate Very Active
10% 0% Dry (n=58.2)
Wet (n=90.3)
8
Evaluation of Healthy Kids, Healthy Communities Parks and Play Spaces Direct Observation Tool Park or Play Space Name/Address:
Observer Name:
Community Partnership:
Start Time
Play Space
Weather Condition: Children 3-12 (# of children)
Sedentary Moderate
Very Active
Date:
Adolescent 13-18 (# of youth)
Activity Code Sedentary Moderate
Very Activity Code Active
Adults 19+ (# of adults) Sedentary Moderate
Very Active
Activity Code
__:__ __:__ __:__ __:__ __:__ __:__ __:__ __:__ __:__ __:__ __:__ __:__ __:__ Activity Codes: 0 = No identifiable activity (i.e. not moving); 1= Aerobics; 2 = Baseball/Softball; 3= Basketball; 4 = Dance; 5 = Football; 6 = Gymnastics; 7 = Martial Arts; 8 = Racquet sports; 9 = Soccer; 10 = Swimming; 11= Volleyball; 12 = Weight training; 13 = Other playground games; 14 = Walking; 15 = Jogging/Running; 16 = None of the above; 17 = Biking
Transtria LLC
Page 1
Evaluation of Healthy Kids, Healthy Communities Parks and Play Spaces Direct Observation Introduction This tool and protocol were developed by the evaluation team from Transtria LLC (Laura Brennan, PhD, MPH, Principal Investigator; Allison Kemner, MPH; Tammy Behlmann, MPH; Jessica Stachecki, MSW, MBA; Carl Filler, MSW) and Washington University Institute for Public Health (Ross Brownson, PhD, Co-Principal Investigator; Christy Hoehner, PhD, MSPH) as well as feedback from national advisors and partners. This tool and protocol were adapted from the System for Observing Play and Leisure Activity (SOPLAY) and System for Observing Play and Recreation in Communities (SOPARC) tools, protocols, and operational definitions. Funding was provided for the Evaluation of Healthy Kids, Healthy Communities by a grant from the Robert Wood Johnson Foundation (#67099). Transtria LLC is leading the evaluation and dissemination activities from April 2010 to March 2014. For more information about the evaluation, please contact Laura Brennan (
[email protected]) or Allison Kemner (
[email protected]). Prior to conducting the observations Safety Assess the safety of the environment for observing before entering the area: If dangerous or suspicious activities are taking place, leave the premises, notify the Project Director or Coordinator, and determine whether to schedule a new observation. If weather conditions (ice or snow, thunder or lightning) are not ideal for collecting data, leave the premises, notify the Project Director or Coordinator, and determine whether to schedule a new observation period. Items to remember Pencils, a copy of the paper tools for all data collectors, clipboards Comfortable shoes, umbrella (if it’s raining), sunscreen Data collectors’ contact information (in case of emergency) List and map of sites for data collection, identifying boundaries of the area Letter from the Project Director or Coordinator explaining the reason for data collection Transportation to and from the site for observers, if needed Direct Observation schedule Recommended timeframe for observations: Scan one area for 15-30 minutes. Scans should last for 30 seconds to 1 minute (depending on the number of people in the area). There should be a 1 minute rest between scans. Schedule observations at different times of the day (2-3 times per day recommended). Example times: Morning (7:30 AM) Noon (11:30 AM) Afternoon (3:30 PM) Evening (6:30 PM) Schedule observations for multiple times a week (2-3 days recommended). Example schedules: Two weekdays (Monday through Friday) and one weekend day (Saturday and Sunday) Example: Tuesday, Thursday, Saturday
Transtria LLC
Page 2
Evaluation of Healthy Kids, Healthy Communities Parks and Play Spaces Direct Observation Mapping Table (Instruction Sheet) The purpose of mapping is to record various features in different parks and play space settings. Completing the map will allow for a better understanding of the individual behaviors observed in the designated play spaces. Before observing activities, recorders should have knowledge of the play space where they are going to conduct observations. A rough sketch should be made of the overall park or play space (and how it has been divided into areas for different observers, if necessary). In the case where multiple play spaces are observed, each area should be numbered on the sketch. In addition, all permanent structures and natural and constructed boundaries should be recorded in the sketch. A copy of the sketch should be retained for reference during data analysis. Below you will find detailed descriptions for each column within the Parks and Play Spaces Mapping Table. Park or play space: All descriptive details about the park or play space should be easily referenced between the sketched map and the Mapping Table. From the sketched map, place the area number in the first column of the Mapping Table and follow the row across to complete all categories. [Note: The area numbers will also be referenced in the "Parks and Play Spaces observation tool."] Setting: Record whether the play space being used is a park, playground, recreation facility, or other space (specify). Location: Record whether the play space being used is indoors or outdoors. Type: Choose from the following categories. Court: An area marked for basketball, volleyball, racquetball, and/or other court games. It contains permanent markings specifically for court games. Field: An area marked for football, soccer, baseball, and/or other field games. It contains permanent markings or goals, backstops, or other features specifically for field games. Playground: A self-contained space for swinging, sliding, climbing, or other types of play. Pool: Consists of wading or swimming pool and the surrounding space. Gym: A large indoor space primarily for physical activity and game play. Multi-purpose room: An auditorium, classroom, studio, or other indoor space that may be used for physical activity (e.g., dance, aerobics, strength training). Multi-purpose field: An open, outdoor, unmarked field that may be used for physical activity. Other (specify): Record any other type of area not specified above. Condition: This section provides basic descriptive information about the designated play space. Accessible: Play space is not restricted from public use (e.g., area is not locked or rented to a private party). Usable: Play space is safe for physical activity (e.g., equipment is in good condition) Supervised: Play space is supervised by personnel (e.g., staff, teachers, volunteers). The supervisor must be in or adjacent to this specific area. Organized: Physical activity programs (i.e., scheduled, with leadership by school or agency personnel apparent) are occurring in the play space (e.g., intramurals, interscholastic practices, fitness classes). Equipment: Equipment is provided (e.g., balls, jump ropes). Do not mark if the equipment is permanent (e.g., basketball hoops) or is owned by people in the park or play space. [Note: The equipment may be provided by parks and recreation, schools, or other organizations/agencies.] Surface: Record what type of surface is present on the majority of each play space. Choose from the following: sand/dirt, grass, gravel, wood chips/ mulch, foam/ rubber/ tile, cement/ pavement, hardwood, carpet, and other (specify). Intervention: Record the specific intervention changes that assist children in participating in physical activity in this play space. This will include modifications such as lines painted on courts (e.g., four-square), cuts in the grass or field areas (e.g., baseball diamonds), and poles (basketball hoops, etc.). Do not record temporary improvements such as chalk lines and portable nets. A modification identifies what the area is primarily designed for, regardless of how it used at a particular time. Identify spaces that have multiple improvements that overlap but cannot be used simultaneously. For instance, a court space may have poles and painted lines that are used for both volleyball and basketball.
Transtria LLC
Page 3
Evaluation of Healthy Kids, Healthy Communities Parks and Play Spaces Mapping Table Play Space Name/Address:
Observer Name:
Community Partnership: Play Space
1
2
3
Setting
Park Rec. facility Other:
Park Rec. facility Other:
Park Rec. facility Other:
Transtria LLC
Weather Condition: Location
Indoor Outdoor
Indoor Outdoor
Indoor Outdoor
Date:
Type
Condition
Surface
Court Field Playground Pool Gym Multi-purp. room Multi-purp. field Other:
Accessible Usable Supervised Organized Equipment Other:
Court Field Playground Pool Gym Multi-purp. room Multi-purp. field Other:
Accessible Usable Supervised Organized Equipment Other:
Court Field Playground Pool Gym Multi-purp. room Multi-purp. field Other:
Accessible Usable Supervised Organized Equipment Other:
Intervention
Sand/dirt Grass Gravel Wood chips/ mulch Foam/ rubber/ tile Cement/ pavement Hardwood Carpet Other: Sand/dirt Grass Gravel Wood chips/ mulch Foam/ rubber/ tile Cement/ pavement Hardwood Carpet Other: Sand/dirt Grass Gravel Wood chips/ mulch Foam/ rubber/ tile Cement/ pavement Hardwood Carpet Other:
Page 4
Evaluation of Healthy Kids, Healthy Communities
Parks and Play Spaces Mapping Table Play Space
4
5
6
Setting
Park Rec. facility Other:
Park Rec. facility Other:
Park Rec. facility Other:
Transtria LLC
Location
Indoor Outdoor
Indoor Outdoor
Indoor Outdoor
Type
Condition
Surface
Court Field Playground Pool Gym Multi-purp. room Multi-purp. field Other:
Accessible Usable Supervised Organized Equipment Other:
Court Field Playground Pool Gym Multi-purp. room Multi-purp. field Other:
Accessible Usable Supervised Organized Equipment Other::
Court Field Playground Pool Gym Multi-purp. room Multi-purp. field Other:
Accessible Usable Supervised Organized Equipment Other:
Intervention
Sand/dirt Grass Gravel Wood chips/ mulch Foam/ rubber/ tile Cement/ pavement Hardwood Carpet Other: Sand/dirt Grass Gravel Wood chips/ mulch Foam/ rubber/ tile Cement/ pavement Hardwood Carpet Other: Sand/dirt Grass Gravel Wood chips/ mulch Foam/ rubber/ tile Cement/ pavement Hardwood Carpet Other:
Page 5
Evaluation of Healthy Kids, Healthy Communities Parks and Play Spaces Direct Observation Instruction Sheet Use the following codes and definitions to assist you in completing the observation tool. Observers: Observers will be split into groups of two to observe different areas at the same time (see example below). Areas correspond with the play spaces on the Parks and Play Spaces Mapping Table. Play Space 1: Play Space 2:
Observer 1 Observer 2 Observer 3 Observer 4
Start Time: This is the clock time for the beginning of each observation period. Each observation will last the same amount of time (with the length of time dependent on the number of individuals within the observed area) with a one minute break in-between observations to record (see below for an example). In the first column, record the start time for each period of observation. Period 1: Period 2: Period 3:
Minute 1 – Observation Minute 2 – Break/Record Minute 3 – Observation Minute 4 – Break/Record Minute 5 – Observation Minute 6 – Break/Record
Map: Before observation begins, the observers will split the street into sections (e.g., segments and intersections) and each observer will be responsible for observing his/her section. The observers should record the area number in the second column of the observation tool. Scanning: When scanning an area, observers should start on the far right end of the area and scan to the left side, then back to the right side for the duration of the scan time. During the scan, the observer should complete the observation tool by tallying activity by age group, in addition to reporting the activity codes for the age group. You should count the same individual’s activity level multiple times if they enter your line of vision more than once in the scan time. However, only mark each activity code one time per scan time (see below). Ages: Each age category has its own count. Please provide the number of youth or individuals represented during the observation period participating in different intensity levels of activity and their specific activity (i.e., activity code). Activity Level (Sedentary, Moderate, Very Active): During scans of the target area, all people should be accounted for as either participating in very active, moderate, or sedentary behaviors. Mark a tally mark for each individual in the proper activity level and age box (i.e. if you see a 14 year old walking, put a tally mark in moderate under Adolescent). Sedentary behaviors are defined as activities in which people are not moving (e.g. standing, sitting, playing board games) Moderate intensity behaviors require more movement but no strenuous activity (e.g. walking, biking slowly) Very active behaviors show evidence of increased heart rate and inhalation rate (e.g. running, biking vigorously, playing basketball) Activity Codes: Define what tasks individuals are participating in during the scanning period. All codes are labeled at the bottom of the observation tool. Use each code only one time per observation period (e.g., write “14” once in the space for activity codes even if more than one individual is observed walking).
Transtria LLC
Page 6