Overlapping community structures and their detection on social networks Nam P. Nguyen, Thang N. Dinh, Dung T. Nguyen, My T. Thai Department of Computer and Information Science and Engineering, University of Florida, USA Email: {nanguyen, tdinh, dtnguyen, mythai}@cise.ufl.edu
Abstract—We propose DOCA (Detecting Overlapping Community Algorithm), a connection-based algorithm for discovering high quality overlapping community structures in social networks. Our proposed method is fast, very limited parameter dependent and only requires local knowledge about the network topology. Furthermore, the community structures discovered by DOCA are deterministic, i.e., no fuzzy community assignments are produced. DOCA’s performance is certified by extensive experiments on real-world traces including Enron communication network, ArXiv citation and Astro physics collaboration networks as well as Facebook and Foursquare social networks. The demonstrative benchmark with other detection methods highlights the efficiency of DOCA when discovering community structures of large-scale networks. By using DOCA to analyze the community structures of real datasets, we find that overlapping communities occur naturally and quite frequently, especially for top largest communities. In addition, overlapped nodes tend to be active users who participate in multiple communities at the same time. This happens not only on social networks but also on collaboration, citation and communication networks.
I. I NTRODUCTION Network communities have long been believed to be groups of tight-knit nodes having more internal than external connections [1][2]. In social networks, a social community usually consists of people sharing common interests who tend to interact more frequently with other members than to the outside world. The discovery of network communities provides us a much better understanding about the structural topology of each community as well as its organization principles. For example, a community in biology often consists of proteins, genes or subunits with functional similarity. Likewise, a community in social networks usually contains users having similar characteristics that make them different from the others. In the social network visualization perspective, the detection of community structure is extremely helpful since it only displays core groups of users and their mutual interactions, hence presents a more compact and understandable description of the network as a whole. Detecting this special structure also finds itself extremely useful in other network aspects, such as forwarding and routing strategies in communication networks [3][4] and worm containment on cellular networks [5]. In general, community detection can be classified into two categories: Overlapping and Non-overlapping methods. Many efficient algorithms have been proposed to identify nonoverlapping network community structure, i.e., detecting pairwise disjoint communities, in both static [6][7] and dynamic networks [4][8]. An excellent survey on disjoint community detection methods can be found in [9] and references therein.
Network communities in reality, however, are not always disjoint from each other. In fact, communities in social networks usually overlap with each other since many active users can possibly participate in multiple groups at the same time. For example, on online social network sites, e.g., Facebook, Twitter or MySpace, a user with favors in movies, music and art can join in and becomes an active member of those communities of interests. A disjoint community detection method, when applied to a network with overlapping communities, shall misleadingly classify overlapped nodes into different communities, thus fails to reveal the original network’s structure. This makes the detection of overlapping communities an interesting, yet challenging problem. This problem also drives the need for a different concept of overlapping community structure. Unlike the non-overlapping point of view, a (overlaped) community should be local and independent of its context or topological environment, as proposed in a recent work [10]. In addition, Goldberg [11] suggests that a community should also satisfy connectedness, i.e., it should induce a connected sub-graph in the network, and local optimality, i.e., the removal or addition of a single node will not affect the community with respect to a density function. While we agree upon the independence and connectedness properties, we find the local optimality too strict to allow the extension of network communities, especially when they can overlap. Therefore, in this paper, we suggest a new concept for a local community satisfying the independence and connectedness properties, and relax the local optimality to make it easier for the expansion of highly overlapped communities in the network. Many methods have been proposed in the literature to find the overlapping network communities (section V). Unfortunately, most of them (1) usually require the global knowledge of the network topology (which is generally missing or unknown) (2) have parameters that are notoriously difficult to fine tune and (3) are time consuming when analyzing largescale networks. To overcome these limitations, we propose DOCA, a quick algorithm with performance guarantees capable for discovering high quality community structures in social networks. In a big picture, our connection-based DOCA algorithm works toward the classification of nodes into local communities when the number of interactions among them suffices, and then tries to combine highly overlapped communities if they share significant substructures. By doing this way, DOCA not only requires just local knowledge about network topology but also asks for a very light-weight computation.
Moreover, our method only requires a predefined parameter called overlapping threshold β for its entire operation. This requirement is necessary since communities can overlap at different scales and resolutions, and thus, we need to have a quality control parameter in order to certify how much the shared substructure means to them. This very limited parameter-dependence not only gives DOCA more freedom when analyzing networks with different types, sizes and hierarchical structures but also expedites its overall performance. The contributions of this paper are three-fold: First, we propose DOCA, a fast and effective algorithm for detecting high quality community structures in social networks (section III). Next, in section IV, we present the empirical results of our extensive experiments on real-world networks in reference to the most effective method COPRA and a recently proposed method GCE (review in Section V). This benchmark on real-world traces shows that DOCA performs competitively with extremely less time consuming. Finally, we use DOCA to analyze five real-world traces and find that overlapping communities occur naturally and quite frequently, especially for top largest communities. Moreover, overlapped nodes tend to be active users who participate in multiple communities at the same time. This happens not only on social networks but also on collaboration, citation and communication networks. II. P ROBLEM F ORMULATION A. Basic notations Let G = (V, E) be a graph representing a social network where V is the set of N nodes and E is the set of M connections. Denote by C = {C1 , C2 , ..., Ck } the network community structure, i.e., a collection of subsets of V where each Ci ∈ C and its induced subgraph form a community of G. In our model, we allow Ci ∩ Cj 6= ∅ so that the network communities can overlap with each other. For a node u ∈ V , let du , N (u) and Com(u) denote its degree, its neighbors and its community assignment list, respectively. For any community C of G, let C in be the set of connections having both endpoints in C and C out denote the set of connections having exactly one endpoint in C. B. Density function In order to quantify the goodness of a local community C ∈ C, we use the popular internal density function 2|C in | [12]. The more C approaches a clique ∆(C) = |C|(|C|−1) of its size, the higher its density value ∆(C) and the stronger its internal structure. In order to set up a threshold on the number of connections that suffices for a set of nodes C to be a community, we propose the function 1−
2
|C|(|C| − 1) |C|(|C|−1) σ(C) = 2 Several functions of the same purpose have been introduced in the literature, for instance in the work of [13][14][15] and thus, it is worth mentioning the main differences between those and ours. Firstly, our function processes on the candidate group only and neither requires any predefined threshold nor userinput parameter. Secondly, σ(C) is an increasing function that closely approaches C’s full number of connections, i.e., the
number of edges in a clique of size |C|. That makes σ(C) a relaxation version of the traditional density function, yet a powerful one as it scales well with the community sizes. σ(C) is used in detecting local communities, i.e., densely connected parts of the network, as described in section III. C. Objective Our objective is to find a community assignment for the set of nodes V which P maximizes the overall internal density function ∆(C) = C∈C ∆(C). Unlike the case of disjoint community structure, in which connections crossing between communities should be less than those inside them, our objective does not take into account the number of outgoing links from each community. Informally, we define detecting overlapping communities as an optimization problem as follow: Given a graph G = (V, E), find a community structure C =P {Ci } of V with the following objective function: max Ci ∈C ∆(Ci ) subject to |Ci | ≥ 4 ∀Ci ∈ C; |Ciin ∩Cjin | |Ci ∩Cj | + min{|C ≤ β min{|Ciin |,|Cjin |} � Ss Ss i |,|C�j |} ∆ i=1 Ci < τ ∀s ∈ i=1 Ci
∀Ci , Cj ∈ C; and
[1, |C|] where τ (·) is a function defined in section III-A and β is an overlapping threshold. This threshold defines how much substructure two communities can share, and the higher β the more we allow communities to overlap. The first condition |Ci | ≥ 4 is carried out from the increasing property of σ(·) function. This condition allows us to skip over network communities of very small sizes. This makes sense in social networks where a social community usually consists of more than three people, and intuitively agrees with the finding of [9][16]. Those tiny communities will then be identified in the last procedure of our DOCA algorithm. The next constraint implies two communities that overlap more than a certain fraction of the smaller’s size should be merged to a single community. Finally, the last constraint filters out the unfortunate case in which some subcommunities (i.e., parts of a bigger one) are contained in an actual big community. Since this constraint requires an intensive search for all possible combinations of network communities, which can grow exponentially especially when communities can overlap, we do not hope to find the best solution for this problem in a timely manner. Instead, we propose DOCA, an algorithm to quickly reveal a high quality community structure of a given social network. III. M ETHOD D ESCRIPTION
DOCA consists of three main procedures: (1) Detecting local communities, (2) Combining overlapping communities and (3) Revisiting unassigned nodes. Once given a social network as input, DOCA sequentially executes these three procedures in their orders to discover the network overlapping community structure. In a big picture, our method works toward the classification of network nodes into different groups by first identifying all possible densely connected parts of the input network in the starting phase, and then trying to merge highly overlapped communities in the next phase. To make sure that all nodes are properly labeled, the last procedure revisits unassigned nodes to either classify them into appropriate communities or
Algorithm 1 Detecting Local Communities
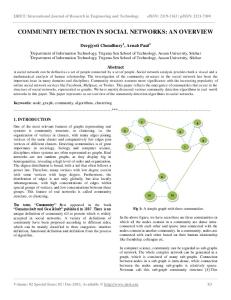
(a) (b) Fig. 1. (a) The group of nodes containing u and v defines a local community C since ∆(C) = 0.9 ≥ τ (C) = 0.725. (b) Two local communities sharing a significant substructure and should be combined to a single community. Here β = 0.75 and overlapping score is 3/5 + 3/7 = 1.027
identify them as outliers. This local community optimization approach scales well with the network’s size and topology as it works locally and does not depend on the knowledge of the whole network. Note that while DOCA shares this strategy in general, it fundamentally differs from the works recently suggested [14][17] in which its local communities detection is done automatically without requiring any user-input parameter. Moreover, DOCA also differs from [18] in the way it allows |Ci ∩ Cj | ≥ 2 for any subset Ci , Cj of V , and consequently allows network communities to overlap not only at a single vertex but also as a substructure of the whole community. A. Detecting local communities The detection of local network communities is the first and also the most important phase of our method. Knowledge of these raw communities provides us an overview of the network principles as well as predictions to critical places where communities can possibly overlap. In particular, we term a group of nodes C ⊆ V a local community if its internal density exceeds a threshold determined based only on C’s size, regardless to its external connections. Of course, a clique represents a perfect local community; however, we do not restrict our starting communities to be only cliques. Instead, we relax them to be “quasi-cliques” which can overlap with each other and whose detection can be done in an automatic fashion. This is the key difference between DOCA and previous works [19][17][14]. In order for a group of nodes C to be a local community, its internal density ∆(C) should satisfy the condition ∆(C) ≥ τ (C) where we propose the function τ (C) to be τ (C) = 2σ(C) |C|(|C|−1) . By the definition of σ(C), τ (C) can be reduced 2 − |C|(|C|−1)
to τ (C) = |C|(|C|−1) . It is clear that the above 2 function depends only on C’s size, and as a result, it can be locally computed and be adapted to multiple communities of different sizes. Moreover, local communities formed in this manner satisfy the connectedness and independence properties because they are (1) obviously connected and (2) determined only by their own internal densities. Local optimality is relaxed since our τ (·) function does not impose that requirement. The local community detection algorithm begins by examining every edge (u, v) in the network. For each edge, the algorithm inclusively finds the intersection Cuv of N (u) and N (v) and computes its internal density as well as the threshold τ (Cuv ). If the internal density suffices, i.e. ∆(Cuv ) ≥ τ (Cuv ), Cuv is defined as a local community and the community lists Com(u) and Com(v) are updated. Note that edges whose endpoints belonging to the same community are excluded from examination. Figure 1(a) illustrates the algorithm on a simple example. The detailed description is presented in Alg. 1
Input: Network G = (V, E) Output: Local (or raw) community structure C = {C1 , C2 , ..., Ck } 1: C = ∅; 2: for (u, v) ∈ E and Com(u) ∩ Com(v) = ∅ do 3: Let Cuv = N (u) ∩ N (v) ∪ {u, v}; 4: if ∆(Cuv ) ≥ τ (Cuv ) then /*Local community check*/ 5: C ← C ∪ Cuv ; 6: Update Com(u) and Com(v); 7: end if 8: end for
Complexity: Time complexity of Alg. 1 is O(δM ) where δ = maxu∈V {du }. Theorem 1: The local community structure C detected by Alg. 1 satisfies ∆(C) ≥ 0.83 × ∆(OP T ) where OPT is the optimal community assignment that maximizes the overall internal density function. B. Combining overlapping communities As soon as the first procedure finishes, the raw network community structure can be pictured as a collection of (possibly overlapped) dense parts of the network together with outliers. As some of those dense parts can possibly share significant common substructures, we need to merge them if they are indeed highly overlapped. In order to do so, we introduce the overlapping score of two communities: OS(Ci , Cj ) = in |Iij | |Iij | + in min{|Ci |,|Cj |} min{|Ci |,|Cjin |}
where Iij = Ci ∩Cj . Basically, OS(Ci , Cj ) values the importance of the common nodes and connections shared between Ci and Cj to the smaller community. In comparison with the distance metric suggested in [17], our overlapping function not only takes into account the fraction of common nodes (first term) but also values the fraction of common connections (second term), which is crucial in order to merge overlapped communities. In addition, OS(·, ·) is symmetric and scales well with community sizes. The higher this score, the more communities in consideration should be merged. The second procedure starts out by examining raw communities identified from the first phase in a bottom up manner. In this procedure, two communities Ci and Cj are combined if OS(Ci , Cj ) ≥ β. Figure 1(b) works out the merging on a simple example. The combination process terminates until no communities are further merged together. Algorithm 2 Combining Overlapping Communities Input: Local network community structure C 0 = {C10 , ..., Cp0 } Output: Combined community structure C = {C1 , ..., Ct } 1: C = C 0 ; 2: Done ← False; 3: while (!Done) do 4: Done ← True; 5: for Ci ∈ C do /* i = p..1 */ 6: Let N (Ci ) = {Cj ∈ C|Cj ∩ Ci 6= ∅}; 7: for Cj ∈ N (Ci ) do 8: if OC(Cj , Ci ) ≥ β then 9: Cmin{i,j} ← Ci ∪ Cj ; 10: C ← C\Cmax{i,j} ; 11: Update Com(u) for all u ∈ Ci ; 12: Done ← False; 13: end if 14: end for 15: end for 16: end while
Complexity: Time complexity of Alg. 2 is O(N02 ) where N0 is the number of local communities detected in Alg. 1. Clearly, N0 ≤ M and thus, it coulld be O(M 2 ). However, when the intersection of two communities is upper bounded, by Lemma 1, we know that the number of local communities is also upper bounded by O(N ), and thus, the time complexity of Alg. 2 is O(N 2 ). In our experiments, we observe that the running time is indeed much smaller than O(N 2 ). Lemma 1: The number of raw communities detected in Alg. 1 is O(N ) when the number of nodes in the intersection of any two communities is upper bounded by a constant α. C. Revisiting unassigned nodes Even when the above two procedures are executed, there would still exist leftover nodes or edges due to their less attraction to the rest of the network. Because of its size constraint, the first procedure skips over tiny communities of sizes less than four and thus, may leave out some nodes unlabeled. These nodes will not be touched in the second phase since they do not belong to any local communities and consequently, will remain unassigned afterwards. Therefore, we need to revisit those nodes to either group them into appropriate communities or classify them as outliers based on their connectivity structures. Alternatively, this process can be thought of as a community trying to hire adjacent unassigned nodes which are similar to the host community. To this end, we need a community fitness function in order to quantify the similarity between a node u and a neighbor community C. We find the fitness in function FS = 2|S in|S|+|S| out | (where S ⊆ V ) commonly used in [11][14][17] performs competitively in both synthesized and real-world datasets. Algorithm 3 Revisit Unassigned Nodes Input: The combined community structure C 0 = {C10 , ..., Ct0 } Output: The final community structure C = {C1 , C2 , ..., Ck } 1: C = C 0 ; 2: for u ∈ V and Com(u) = ∅ do 3: Let N C(u) = {Cj ∈ C|u is adjacent to Cj }; 4: for Cj ∈ N C(u) do 5: if FCj ∪{u} ≥ FCj then 6: Cj ← Cj ∪ {u}; 7: Com(u) ← Com(u) ∪ {j}; 8: end if 9: end for 10: if Com(u) = ∅ then 11: Classify u as an outlier; 12: end if 13: end for
Taking into account this fitness function, a community C will keep hiring any unassigned adjacent vertex of maximum similarity in a greedy manner, provided the newly joined vertex does not shrink down the community’s current fitness value. If there is no such node, C is defined as a final network community. Nodes remained unlabeled through this last procedure are identified as outliers. The detailed algorithm is presented in Alg. 3. The time complexity of the last procedure is O(N δ). IV. E XPERIMENTAL R ESULTS ON R EAL - WORLD T RACES We examine the performance of DOCA on different kinds of real-world networks including the Arxiv citation network1 , the 1 www.cs.cornell.edu/projects/kddcup/datasets.html
TABLE I S UMMARY OF FIVE DATASETS Dataset ArXiv citation Astro-physic Enron email Facebook Foursquare
Nodes 27770 18772 36692 69731 47260
Edges 352285 396160 367662 1.5M 1.6M
Source KDD Cup 2003 SNAP SNAP Ref. [20] Our data
collaboration network of Astro Physics2 , the email communication network from Enron3 , the Facebook and Foursquare4 social networks. The overview of five datasets is summarized in table I. Due to space limit, we omit the data descriptions whose details can be found in the provided links. A. Reference to other community detection methods We first compare the performance of DOCA with other methods COPRA [21] and GCE [17] whose implementations are available. We keep the default settings as provided in COPRA and GCE deliverables. The only DOCA’s parameter β is set to 0.67. Due to the lack of the ground-truths, we neither want to compete among three methods nor to turn any method down. Our goal is to observe how DOCA performs in reference to the other methods. In our experiments, COPRA gets errors on Astroph and Foursquare networks, and GCE is not able to finish Foursquare dataset in time, so we exclude those missing values in the charts. As depicted in Figure 2a, 2b and 2c, DOCA discovers many more communities of smaller sizes than other two methods, except for COPRA on the Enron dataset. For instance, on Arxiv dataset, DOCA finds out nearly 1500 communities where COPRA and GCE discover less than 500 communities. On Facebook network, DOCA and GCE find out relatively close number of communities with the nearly same average size. However, the average internal density values found by DOCA are much higher than those of COPRA and GCE, meaning that the community structures discovered by DOCA are somehow stronger. We next examine the maximum community size (Figure 2d) detected by each method. In general, DOCA and COPRA tend to find out top communities of very big sizes while those found by GCE are much smaller. Due to the lack of the proper ground-truths, it is difficult to justify whether these results are indeed correct or not. However, the results returned by DOCA make sense to us since most networks in reality expose to content a giant connected component that can be regarded as the biggest community. The coverage and running times of three testing algorithms are presented in Figure 2e and 2f. Because coverage is not a requirement, we only plot it for reference. Running times on five real datasets indicate that only DOCA was able to finish all the tasks in a timely manner: COPRA and GCE take 8 to 60 minutes to analyze just a single network, except for the Astroph network in which GCE takes more than 30 seconds (1 second for DOCA). This benchmark among three methods, though relative, gives us an idea of how effective 2 snap.stanford.edu/data/ca-AstroPh.html 3 snap.stanford.edu/data/email-Enron.html 4 sites.google.com/site/namnpuf/original
foursquare.7z
4500
450
DOCA COPRA GCE
4000 3500
350
3000
300
2500
250
2000
200
1500
150
1000
1
DOCA COPRA GCE
400
0.4 0.2
50
0 Arxiv
Astroph
Enron
0 Arxiv
Facebook Foursquare
Astroph
(a) Number of communities
Enron
0 Arxiv
Facebook Foursquare
Astroph
(b) Average community size
Facebook Foursquare
60
DOCA COPRA 50 GCE
90 80
40000
Enron
(c) Average density
100
DOCA 50000 COPRA GCE
ArXiv Astro Enron Facebook Foursquare
Num. com 172 327 1239 208 2450
Avg size 161.4 57.4 29.6 306.4 19.2
Avg density 0.08 0.18 0.88 0.09 0.001
Q
Coverage
0.65 0.62 0.60 0.63 0.44
100% 100% 100% 100% 100%
40
70
30000
30
TABLE III S TATISTIC OF GROUPS DISCOVERED BY DOCA
60 20000
20
50 10000
DOCA COPRA GCE
40 Astroph
Enron
30 Arxiv
FacebookFoursquare
Astroph
(d) Maximum community size
Fig. 2. 5000 4500 4000
Enron
10 0 Arxiv
Facebook Foursquare
(e) Coverage
Astroph
Enron
Facebook Foursquare
Comparison on real-world traces among DOCA, COPRA and GCE 250
Arxiv Astroph Enron Facebook Foursquare
Average size
3000 2500 2000
1
Arxiv Astroph Enron Facebook Foursquare
200
3500
Arxiv Astroph Enron Facebook Foursquare
0.9
150
100
1500 50
1000
Dataset
(f) Running Time (minutes)
Average density
Arxiv
Number of communities
TABLE II S TATISTIC OF GROUPS DISCOVERED BY B LONDEL’ S METHOD Dataset
0.6
100
500
DOCA COPRA GCE
0.8
0.8
ArXiv Astro Enron Facebook Foursquare
Avg num. com 1440 3386 3025 2195 700
Avg size 27.3 10.6 15.6 67.0 130.6
Avg density 0.67 0.84 0.83 0.72 0.56
Coverage 97% 98% 93% 96% 95%
0.7
0.6
500 0.65 0.66 0.67 0.68 0.69 0.7 0.71 0.72 0.73 0.74 0.75
0 0.65 0.66 0.67 0.68 0.69 0.7 0.71 0.72 0.73 0.74 0.75
Overlapping Threshold (a)
Overlapping Threshold (b) 90
Arxiv Astroph Enron Facebook Foursquare
0.8
80 70
Running time (s)
Avg Overlapping Ratio
1
0.6
0.4
0.5 0.65 0.66 0.67 0.68 0.69 0.7 0.71 0.72 0.73 0.74 0.75
Overlapping Threshold (c) Arxiv Astroph Enron Facebook Foursquare
60 50 40 30 20
0.2
10 0 1
2
3
4
5
6
7
8
9
10
0 0.65 0.66 0.67 0.68 0.69 0.7 0.71 0.72 0.73 0.74 0.75
Top 10 communities (d)
Fig. 3.
Overlapping Threshold (e)
Results of DOCA on real-world traces
DOCA is in analyzing and discovering overlapping community structures of many practical types of networks, ranging from communication, citation to collaboration and social networks. B. Reference to non-overlapping community detection method We further perform Blondel’s method [7], one of the best non-overlapping community detection methods [22], to give the reader a point of reference and to illustrate the difference between overlap and non-overlap community structures. The results are presented in table II and III (here modularity Q only applies for Blondel’s method). The Blondel’s method produces small numbers of found communities with average to big sizes, while DOCA discovers more communities of smaller sizes. Additionally, those communities are of much higher densities, meaning they possess stronger and clearer internal structures in comparison with the non-overlapping community structure. This can be explained by DOCA, unlike the non-overlapping method, pays its attention particularly to crucial parts of the network, thus is able to captures more structural details of the network communities. This fact also confirms the goodness of our proposed objective function. Coverage is not a strict requirement on real networks since there could be outliers or isolated nodes that do not belong to any group or community in reality. Of course, the higher network coverage (or the less number of network outliers) the better. The experimental results show that DOCA can classify from 93% up to 98% of network nodes into non-trivial communities. They also indicate that these real networks indeed contain outliers, however, they are very small in comparison with the total number of nodes. C. Results and findings using DOCA With the accuracy and efficacy observed through experiments and benchmarks with other detection methods, we
confidently use DOCA to further analyze the real-world traces and present our results and findings. In particular, we focus on the following quantities: Number of communities, Average community size, Average density, Average overlapping ratios and finally, Running time of the detection algorithm. We perform DOCA sequentially at each overlapping threshold β ranging from 0.65 to 0.75 and report results in Figure 3. Our first observation shows that the higher β is, the more communities DOCA can detect (Figure 3a). This intuitively agrees with what we have expected since the higher β, the more significant substructures two communities have to share in order to be merged. In our experiments, the Astroph dataset achieves the highest number of communities (more than 4500 at β = 0.75) whereas Foursquare dataset obtains the lowest (only more than 700 at β = 0.75) and those of other traces are ranging in between. Note that the numbers of communities of Facebook and Arxiv networks are nearly identical in the first half of testing, however, they increase quickly and differ significantly from each other in the second half. This implies the numbers of communities are sensitive to the input parameter β. We next take a look into the average size and internal density values (Figure 3b, 3c) as they give us the idea of how strong the internal structures of discovered communities are. As expected, the average community sizes decrease as β increases, upper bounded and lower bounded by the sizes of Foursquare and Astroph networks, respectively. However, their internal community structures are quite different. The high average densities of Astroph dataset indicate this network is containing many small-sized but tight-knit communities, where each community can be viewed as a group of collaborating authors sharing similar research interests and composing a common paper. The same observations applies on Enron dataset: this network also shares the almost strong and clear structure as Astroph dataset with even higher density values. This can be explained as the everyday email communication in the same company may occur faster and more frequent than between scientists composing the same papers. The low density values of Foursquare network, on the other hand, reveal that this new social network may contain many big groups of users whose social interactions may not be active at all time.
The interesting finding is on Facebook social network. Although this network contains many more users than Foursquare, its underlying structure is much stronger and clearer: the network is comprised by many middle-sized communities (from 25 to 125 users) with tight social interactions among community members. In general, although the average sizes of Facebook social network also decrease as β varies, its structures still remain wealthy as indicated by high density values. Moreover, Facebook users are in general more active than Foursquare users as they participate in more groups and communities, thus results in higher overlapping ratios as depicted in Figure 3d. We next further investigate the overlapping ratios of each dataset, i.e., we want to know the fraction of overlapped nodes in the top 10 biggest communities. This quantity provides us the concept of how the biggest communities are composed by and how important the overlapped nodes mean them. As depicted in Figure 3d, biggest communities in real-world networks, analyzed by DOCA, are significantly overlap with the others. The results show that not too many top communities on Astroph network are significantly overlapped (only community 1, 3, 7) whereas almost all top communities of Arxiv citation network are. These results also show that on Facebook network, nearly all top ten communities contain active users that involve in at least two groups whereas just less than half of the top communities on Foursquare and Enron networks appear to possess this property. The running times of DOCA are recorded in Figure 3e. DOCA only takes less than 15 seconds to finish analyzing each network, except for Foursquare which it finishes in less than a minute. Although time is not a strict constraint on community detection methods, those who can identify high quality structures in a timely manner are always of desire. These results confirm that DOCA is one of them. V. R ELATED WORK Palla proposes CFinder [19], the seminal and most popular method based on clique-percolation technique which iteratively searches for communities composed of connected kcliques, starting from an initial clique of size k. However, due to the clique requirement and the sparseness of real networks, the communities discovered by CFinder are usually of low quality [22]. Recently, Gregory proposes COPRA [21], a label propagation method with an extended feature to allow multiple community memberships. Recent benchmarks on community detection methods [22][23] reveal that with appropriate parameters set up, COPRA is the best method for detecting overlapping network communities. In a recent attempt, Goldberg [11] suggests connectedness and local optimality properties of a community, and proposes CIS method for finding overlapping communities. This method consists of repeated scans where each of them is based on “seeds” obtained in the previous scan. However, the results may not be deterministic due to its un-predetermined choice of initial seed nodes. Apart from that, Lee [17] proposes GCE, a method based on the greedy and iterative expansion of all “seed” cliques of sizes 3 or 4. This method might not be time effective due to the long running time inherited from the clique finding process. Other detection trends include methods based on nodes splitting [24], modularity [13] and link-based detection methods [18].
VI. C ONCLUSIONS We propose DOCA, a fast algorithm for effectively identifying community structures in social networks. In comparison with GCE and the state-of-the-art COPRA, DOCA performs competitively with extremely less time consuming. We further apply DOCA to analyze real datasets and report our findings. With only one input parameter, we believe DOCA is one of the fastest and most effective methods for identifying overlapping community structures social networks. ACKNOWLEDGMENT This work is partially supported by the NSF under CAREER Award grant 0953284, by the DTRA YIP under grant HDTRA1-09-1-0061 and grant HDTRA1-08-10. R EFERENCES [1] M. Girvan and M. E. J. Newman. Community structure in social and biological networks. PNAS, 99, 2002. [2] M. A. Porter, J-P. Onnela, and P. J. Mucha. Communities in networks. Notices of the AMS, 56(9), 2009. [3] T. N. Dinh, Y. Xuan, and M. T. Thai. Towards social-aware routing in dynamic communication networks. IPCCC, 2009. [4] N. P. Nguyen, T. N. Dinh, Y. Xuan, and M. T. Thai. Adaptive algorithms for detecting community structure in dynamic social networks. INFOCOM, 2011. [5] Z. Zou, G. Cao, S. Zhu, S. Ranjan, and A. Nucci. A social network based patching scheme for worm containment in cellulat networks. In IEEE INFOCOM, 2009. [6] M. E. J. Newman and M. Girvan. Finding and evaluating community structure in networks. Phy. Rev. E 69, 2004. [7] V. D. Blondel, J. Guillaume, R. Lambiotte, and E. Lefebvre. Fast unfolding of communities in large networks. J. Stat. Mech.: Theory and Experiment, 2008. [8] J. Hopcroft, O. Khan, B. Kulis, and B. Selman. Tracking evolving communities in large linked networks. PNAS, 101, 2004. [9] S. Fortunato. Community detection in graphs. Physics Reports, 486(35), 2010. [10] R. Cazabet, F. Amblard, and C. Hanachi. Detection of overlapping communities in dynamical social networks. In SOCIALCOM, 2010. [11] M. Goldberg, S. Kelley, M. Magdon-Ismail, K. Mertsalov, and A. Wallace. Finding overlapping communities in social networks. In SOCIALCOM, 2010. [12] S. Fortunato and C. Castellano. Community structure in graphs. eprint arXiv: 0712.2716, 2007. [13] V. Nicosia, G. Mangioni, V. Carchiolo, and M. Malgeri. Extending the definition of modularity to directed graphs with overlapping communities. J. Stat. Mech.: Theory and Experiment, 2009(03):P03024, 2009. [14] A. Lancichinetti, S. Fortunato, and K. Jnos. Detecting the overlapping and hierarchical community structure in complex networks. New Journal of Physics, 11(3):033015, 2009. [15] A. Lzr, D. bel, and T. Vicsek. Modularity measure of networks with overlapping communities. (Europhysics Letters), 90(1), 2010. [16] J. Leskovec, K. J. Lang, A. Dasgupta, and M. W. Mahoney. Statistical properties of community structure in large social and information networks. In WWW08, pages 695–704. ACM, 2008. [17] C. Lee, F. Reid, A. McDaid, and N. Hurley. Detecting highly overlapping community structure by greedy clique expansion. In KDD. ACM, 2010. [18] J. P. Bagrow Y-Y Ahn and S. Lehmann. Link communities reveal multiscale complexity in networks. Nature, 466:761–764, 2010. [19] G. Palla, I. Derenyi, I. Farkas1, and T. Vicsek. Uncovering the overlapping community structure of complex networks in nature and society. Nature, 435(10), 2005. [20] B. Viswanath, A. Mislove, M. Cha, and K. P. Gummadi. On the evolution of user interaction in facebook. In 2nd ACM SIGCOMM Workshop on Social Networks, 2009. [21] Steve Gregory. Finding overlapping communities in networks by label propagation. New Journal of Physics, 12(10):103018, 2010. [22] A. Lancichinetti and S. Fortunato. Community detection algorithms: A comparative analysis. Physical review. E. 80, 2009. [23] L. Peel. Estimating network parameters for selecting community detection algorithms. FUSION, 2010. [24] S. Gregory. An algorithm to find overlapping community structure in networks. In PKDD 2007, pages 91–102. Springer-Verlag, 2007.