DB2 UDB for z/OS
9/21/2009
Session: F01
Snapping the DB2 for z/OS Dynamic Statement Cache Daniel L Luksetich YL&A 05 October 2009 • 11:30 – 12:30 Platform: DB2 for z/OS
DB2 for z/Os does a pretty good job of caching dynamic SQL statements in order to avoid recompiling the statements on the fly. This can save significant system resources. However, we still have the problem of figuring out just what statements are coming in to DB2, and how they are performing. DB2 for z/OS version 8 introduced the ability to capture and report on the statements in the dynamic statement cache. This presentation will focus on the use of this facility, how to manage it, and how to report, understand, and act on the available performance information. Data from real-world case studies will be presented
© YL&A 1999 - 2009
1
Abstract DB2 for z/Os does a pretty good job of caching dynamic SQL statements in order to avoid recompiling the statements on the fly. This can save significant system resources. However, we still have the problem of figuring out just what statements are coming in to DB2, and how they are performing. DB2 for z/OS version 8 introduced the ability to capture and report on the statements in the dynamic statement cache. This presentation will focus on the use of this facility, how to manage it, and how to report, understand, and act on the available performance information. Data from real-world case studies will be presented Objectives: 1. Introduction to the dynamic statement cache 2. How to extract statements from the statement cache 3. Interpreting the performance metrics from the Explain of the statement cache 4. How to manage the output from the Explain of the statement cache 5. Understanding dynamic statement performance and the alternatives This presentation was developed by Dan Luksetich of YLA, who can be reached at
[email protected]. © YL&A 1999-2009
All of Dan’s presentations are based upon real-world experience at multiple customer sites.
2
DB2 UDB for z/OS
9/21/2009
Yevich, Lawson & Assoc. Inc. 2743 S. Veterans Pkwy PMB 226 Springfield, IL 62704 www.ylassoc.com www.db2expert.com
IBM is a registered trademark of International Business Machines Corporation. DB2 is a trademark of IBM Corp. © Copyright 1999-2009, YL&A, All rights reserved. © YL&A 1999-2009
3
Dan Luksetich is a senior DB2 DBA. He works as a DBA, application architect, presenter, author, and teacher. Dan has been in the information technology business for over 24 years, and has worked with DB2 for over 19 years. He has been a COBOL and BAL programmer, DB2 system programmer, DB2 DBA, and DB2 application architect. His experience includes major implementations on z/OS, AIX, and Linux environments. Dan's experience includes: * Application design and architecture * Database administration * Complex SQL * SQL tuning * DB2 performance audits * Replication * Disaster recovery * Stored procedures, UDFs, and triggers Dan works 8-16 hours a day, everyday, on some of the largest and most complex DB2 implementations in the world. He is a certified DB2 DBA and application developer, and the author of several DB2 related articles as well as co-author of the DB2 9 for z/OS Certification Guide.
© YL&A 1999 - 2007
3
DB2 UDB for z/OS
9/21/2009
Disclaimer PLEASE READ THE FOLLOWING NOTICE
The information contained in this presentation is based on techniques, algorithms, and documentation published by the several authors and companies, and in addition is the result of research. It is therefore subject to change at any time without notice or warning. The information contained in this presentation has not been submitted to any formal tests or review and is distributed on an “As is” basis without any warranty, either expressed or implied. The use of this information or the implementation of any of these techniques is a client responsibility and depends on the client’s ability to evaluate and integrate them into the client’s operational environment. While each item may have been reviewed for accuracy in a specific situation, there is no guarantee that the same or similar results will be obtained elsewhere. Clients attempting to adapt these techniques to their own environments do so at their own risks. Foils, handouts, and additional materials distributed as part of this presentation or seminar should be reviewed in their entirety.
© YL&A 1999-2009
4
No animals were harmed during testing
© YL&A 1999 - 2007
4
DB2 UDB for z/OS
9/21/2009
Outline
© YL&A 1999 - 2007
5
DB2 UDB for z/OS
9/21/2009
Getting Performance Information for Dynamic SQL
Introduction to the Dynamic Statement Cache Improving the Use of the Dynamic Statement Cache The Basis for Performance Tuning Your Dynamic SQL EXPLAINing the Dynamic Statement Cache The Statement Cache Table Using the Statement Cache Table for Tuning
© YL&A 1999-2009
6
The purpose of this presentation is to give the viewer a nice introduction to the dynamic statement cache, it’s purpose, when it is most useful, and how you can get valuable performance information from it.
© YL&A 1999 - 2009
6
DB2 UDB for z/OS
9/21/2009
Introduction to the Dynamic Statement Cache
© YL&A 1999 - 2007
7
DB2 UDB for z/OS
9/21/2009
What is the Dynamic Statement Cache? Area of Memory Inside DB2
– Enabled by the CACHEDYN Installation Parameter z z z
Set as YES by Default Part of the set of EDM Storage Stored Above the 2GB Bar
– Size of the Statement Cache Controlled by the EDMSTMTC Installation Parameter z z z
From 5MB to 1GB in Size There is a Provided Formula to Size it Most People Set this based Upon Available Memory – – – – – – – –
Must Balance Between Other Memory Allocations DB2 Buffers DB2 Logging DB2 Locking Transaction Processors Web Services Batch Jobs Etc © YL&A 1999-2009
8
The dynamic statement cache is an area of memory reserved inside DB2 for the storage of the text of dynamic SQL statements, along with the compiled runtime structures associated with the statement. The primary purpose of this cache is to avoid the overhead of recompiling a statement for every execution. The statement compile process can be expensive, especially for complicated statements, and can result in high CPU costs. The concept is simple; if the user and statement do not change, and no table structures or statistics have changed in the database, then there is no reason to recompile the statement and the previous executable version can be reused.
© YL&A 1999 - 2009
8
DB2 UDB for z/OS
9/21/2009
What Problem Does Caching Dynamic SQL Solve?
Traditionally most Application Programs Used Static Embedded SQL that was “Bound” to the Database
– Program was Pre-Compiled to Produce a Database Request Module (DBRM) – The DBRM was “Bound” to the Database to Create a Run-Time Structure – The Bind Process z z z z
Validated the Statements Looked up Object Definitions and Statistics in the DB2 Catalog Optimized the Access Path Created and Stored the Run-time Structures in Plans and Packages
Dynamic SQL Also Needs to be “Bound”
– Happens During Statement Prepare – This can be Expensive for Large Queries – Also Expensive for Heavily Repeated Dynamic Statements – Sometimes the Bind Represented 90% or more of the CPU Consumed by the Dynamic Statement Execution!
© YL&A 1999-2009
9
With static embedded SQL the statement compile process is performed during the package bind. This is not true for dynamic statements. Just like with static statements, dynamic statements need to be compiled, syntax verified, tables verified, and access paths determined. As our transaction based systems moved off of the local server and began utilizing modern programming languages, the use of dynamic SQL for these systems became more prevalent. The cost of constantly recompiling thousands or millions of statements each day became very expensive.
© YL&A 1999 - 2009
9
9/21/2009
Dynamic Statement Execution Without Cache Application Program D Statement B Prepare/Bind 2 DB2 Catalog Statement Execution DB2 Directory Indexes Tables © YL&A 1999-2009
10
This picture shows a remote application accessing the database server. A request comes across the network and enters the database server. The inbound SQL statement is verified for syntax, and then the DB2 system catalog and directory is used to verify tables, indexes, columns, etc. Catalog statistics are utilized to determine an access path. Finally, the runtime structures for the statement are built and the statement is executed. Many times the cost of doing all this stuff far outweighs the cost of the actual execution of the statement.
10
DB2 UDB for z/OS
9/21/2009
What Problem Does Caching Dynamic SQL Solve?
The Dynamic Statement Cache Retains Information Across the Execution of Dynamic SQL Statements
– SQL Text – Auth Id – Run-Time Execution Structure
Any Inbound Statement That Matches a Statement in Cache can Reuse the Run-Time Structure
– SQL Text Must Match Byte for Byte – Authid Must Match
Reusing the Access Path and Run-Time Structure Saves
– Elapsed Time in Accessing the Catalog and Directory – CPU Time in Validating and Compiling the Statement
© YL&A 1999-2009
11
The dynamic statement cache, when turned on, can help significantly reduce the cost of these inbound SQL statements. If the statement text matches byte for byte with a previous statement from the same user, then the entire statement compile process is bypassed. So, there is no catalog and directory access, no syntax and table verification, no access path determination. The corresponding runtime structure stored in the cache is simply reused. This can result in a significant performance advantage.
© YL&A 1999 - 2009
11
9/21/2009
Dynamic Statement Execution With Cache Application Program
STMT Cache
Match
D Statement B Prepare/Bind 2 No Match
DB2 Catalog
Statement Execution DB2 Directory Indexes Tables © YL&A 1999-2009
12
This picture demonstrates the use of the dynamic statement cache. The statement text is matched in the statement cache for the authorization id. If there is a match then the runtime structures stored in the statement cache are used to directly execute the statement. If there is no match then the DB2 system catalog and directory must be accessed, and the statement validated and complied, just as if there were no statement cache.
12
DB2 UDB for z/OS
9/21/2009
Coding to Take Advantage of the Statement Cache
The Statement Cache is Most Effective for Transaction Environments
– Same Statements Run Many Times versus Different Statements Running – NOT Good for Warehouse/DSS Environment s as Statements Change
You Need to Code to Take Advantage of Matching Statements in the Cache
– Use Parameter Markers versus Embedded Literals – Use a Fixed Authorization ID z z
Preferably in a Three Tiered Environment Preferably one Authid per Application
– Use Connection Pooling
There is Overhead to Matching to the Cache
– If Statements Don’t Match then You Could be Wasting CPU – I’ve Seen up to 10% of the Cost of the Statement © YL&A 1999-2009
13
Only certain statements can take advantage of the dynamic statement cache, and these are statements that are normally associated with transactions. That is, statements that execute often and repetitively. In order for a statement to match in the statement cache it has to match an existing statement, byte for byte, for the given authorization id. If any part of the statement does not match, then the statement has to go through the expensive bind process. For this reason it is important to code SQL statements so that they have a better chance of matching in the cache. The main way is to use parameter markers in the statement. If you use embedded literals, and those literal values change from statement to statement executions, then there will be little or no matching. Also, constants for authorization id’s should be used. A statement can only match for the same authorization id. For this reason you should utilize a 3-tier architecture with connection pooling to increase the matching in the statement cache. Remember that the matching logic is not free. While the cost of matching is not very high, especially relative to the cost of the bind process, if you are not properly matching then it is better just to turn the statement cache off.
© YL&A 1999 - 2009
13
DB2 UDB for z/OS
9/21/2009
Why Expose the Dynamic Statement Cache?
© YL&A 1999 - 2007
14
DB2 UDB for z/OS
9/21/2009
Our Dynamic SQL Challenge
Traditional Application Development Used Static Embedded SQL
– Statements were Bound into Plans and Packages – Access Paths were Determined Prior to Statement Execution – Statement Text is Stored in the DB2 System Catalog – Statistics were Collected to Improve Access Paths z z
Only After SQL Statement Rebound at a Controlled Time Also, Static Statements Could be Bound into a Test Collection to Determine Access Path Changes in Advance
Modern Application Development
– Typically Involves the Use of Dynamic SQL – This Dynamic SQL Typically Comes from Remote Application Servers – JDBC is One Very Popular Example
© YL&A 1999-2009
15
The ongoing challenge with dynamic SQL is how to predict the performance, and determine if there are tuning opportunities. This was always relatively easy to do with static SQL because the access path was determined before the statement was even executed. With dynamic, many times the statement is not seen by a DBA or other tuning expert until it is already executing. Unless specific performance traces are run you usually cannot see the statements coming from a remote dynamic application. Traditionally, tuning dynamic SQL has been very difficult. You either worked directly with programmers to obtain the SQL text, capture the SQL via an online monitor or trace, or capture the SQL via a local JDBC trace at the application server.
© YL&A 1999 - 2009
15
DB2 UDB for z/OS
9/21/2009
Our Dynamic SQL Challenge
With Traditional Static Embedded SQL
– The Access Path was Known in Advance of Execution – The Statement was Known in Advance of Execution
With Traditional Plans and Packages the Cost of a Program can be Determined
– From Accounting Trace SMF Information – If the Proper Accounting Traces are Set
With Dynamic SQL
– The Access Path is Not Known in Advance of Execution – The Statement is Not Known in Advance of Execution
With Dynamic SQL the Cost of Execution is Not Known Exactly
– All Accounting Trace Data is Under Plan DISTSERV – Can Separate Trace Data by Authid – More Individual Detail is More Difficult to Collect © YL&A 1999-2009
16
The cost of dynamic SQL statements is not generally known. Typically with static statements you know generally how often the program that contains the statement is executed by looking at the number of package executions in an accounting report. From looking at the program logic you can generally determine how often certain SQL statements execute. In order to properly tune you do need to know how expensive a statement is relative to what the statement does and how often it is used. This if obviously difficult to do with remote dynamic SQL, especially if all the SQL is coming in under the same authid.
© YL&A 1999 - 2009
16
DB2 UDB for z/OS
9/21/2009
Collecting Dynamic SQL Performance Information
© YL&A 1999 - 2007
17
DB2 UDB for z/OS
9/21/2009
Collecting Performance Information for Dynamic SQL
In Order for DB2 to Collect Performance Metrics for Dynamic SQL
– IFCIDs 316 and 318 Need to be Activated Within the DB2 Trace Facility – Very Easy to Activate These within an Existing Trace – Most DB2 Shops Have Traces Running z z
Accounting Trace Classes 1,2,3,7,8 Sometimes Monitor and Performance Traces in Support of an Online Monitor Tool
There May be a Some Overhead to Collecting Performance Information
– However, I have Not Measured it or Noticed an Impact – And, the Information Gained will be Well Worth It!!! -START TRACE(MON) IFCID(316,318)
Determining if the IFCID’s are Turned On
– You Can do an EXPLAIN STMTCACHE ALL (more info in a few slides) – If all Metrics are Zero then the IFCID’s Need Activation © YL&A 1999-2009
18
DB2 for z/OS is capable of storing performance metrics related to statements stored in the dynamic statement cache. This collection of performance information is not done automatically, but can be enabled by turning on IFCIDs 316 and 318 inside an existing trace, or by starting them in a new trace.
© YL&A 1999 - 2009
18
DB2 UDB for z/OS
9/21/2009
Collecting System Wide Performance Information
Summarized DB2 Accounting Information
– Summary Reports are Produced by Authid z
It’s Critical to Use Separate Authid’s for Each Application
– Reports are Formatted Such That They Can be Fed into Spreadsheet Software z z z
REXX is a Good Tool For This Some Reporting Software is also Very Flexible Or Sometimes Even “Cut and Paste”
Produce Daily Spreadsheet Data
– Produce a Spreadsheet by Authid/Application z z z
Number of Executions, Total Class 2 Elapsed, Number of Statements Total Class 2 CPU, Elapsed Per Execution, CPU Per Execution Elapsed Per SQL Statement, CPU Per SQL Statement
© YL&A 1999-2009
19
In order to properly performance tune you really need to start with the overall big picture of the performance of applications within a subsystem or data sharing group. I typically use DB2 accounting reports summarized by authid. This is provided that all applications are given a separate authorization id for their production SQL. By collecting this information by application you can tell which applications use the most system resources, as well as how many SQL statements are issued. So, you know who uses the most CPU, as well as which applications have the most efficient or inefficient SQL statements. Determining that can be as easy as dividing the total CPU consumed by the number of statements executed.
© YL&A 1999 - 2009
19
DB2 UDB for z/OS
9/21/2009
Explaining the Dynamic Statement Cache
There is the EXPLAIN STMTCACHE Statement in Two Forms
– EXPLAIN STMTCACHE with STMTID or STMTTOKEN z z
Will Explain a Specific Statement in the Cache into Normal Explain Tables You Need to Know the Statement Number or Token
– EXPLAIN STMTCACHE ALL z z
This Gathers the Performance Metrics Collected by IFCID 316 and 318 Populates a DSN_STATEMENT_CACHE_TABLE – You Need to Create One of These Tables in Your Own Schema (Authid) – CREATE TABLE Examples are in the DB2 Manuals
Authority Required to Run This Statement
– To Explain One Statement via STMTID or STMTTOKEN z z
Your Authid Must Match the Authid for the Cached Statement SYSADM
– For EXPLAIN STMTCACHE ALL z z
SYSADM If Not SYSADM You Only Get Information for Statements Cached with Your Authid
© YL&A 1999-2009
20
Starting with version 8, DB2 has expanded the functionality of the EXPLAIN facility greatly. Among this expansion of functionality is the ability to explain the access paths of the statements in the dynamic statement cache, as well as expose the performance metrics that are stored in the dynamic statement cache. A new statement, EXPLAIN STMTCACHE, allows access to the performance information in the dynamic statement cache, and also allows statements in the cache to be explained. Unfortunately, by default you can only explain statements in the cache that match your own authid. People with SYSADM authority can get the performance information for all the statements in the cache.
© YL&A 1999 - 2009
20
DB2 UDB for z/OS
9/21/2009
The DSN_STATEMENT_CACHE_TABLE
© YL&A 1999 - 2007
21
DB2 UDB for z/OS
9/21/2009
DSN_STATEMENT_CACHE_TABLE STMT_ID
Statement ID, EDM unique token
STMT_TOKEN
Statement token. User-provided identification string
COLLID
Collection id value is DSNDYNAMICSQLCACHE
PROGRAM_NAME
Program name, Name of package or DBRM that performed the initial PREPARE
INV_DROPALT
Invalidated by DROP/ALTER
INV_REVOKE
Invalidated by REVOKE
INV_LRU
Removed from cache by LRU
INV_RUNSTATS
Invalidated by RUNSTATS
CACHED_TS
TS Timestamp when statement was cached
USERS
Number of current users of statement. These are the users that have prepared or executed the statement during their current unit of work.
COPIES
Number of copies of the statement owned by all threads in the system
LINES
Precompiler line number from the initial PREPARE
PRIMAUTH
User ID - Primary authorization ID of the user that did the initial PREPARE
CURSQLID
CURRENT SQLID of the user that did the initial prepare
© YL&A 1999-2009
22
The DSN_STATEMENT_CACHE_TABLE table is a table that you can create under your own authid. This table contains the performance metrics for the statements in the dynamic statement cache after you execute an EXPLAIN STMTCACHE ALL statement. There is a ton of important information placed into this table for the dynamic statements in the cache. The text of the CREATE TABLE statement for the DSN_STATEMENT_CACHE_TABLE can be found in the SQL reference. A very important column on this slide is the PRIMAUTH column, which is the authid associated with the statement in the cache. This authid can be correlated to the performance information gathered at the system level from the DB2 accounting traces.
© YL&A 1999 - 2005
22
DB2 UDB for z/OS
9/21/2009
DSN_STATEMENT_CACHE_TABLE (cont..) BIND_QUALIFIER
Bind Qualifier, object qualifier for unqualified table names
BIND_ISO
ISOLATION BIND option: , 'UR' - Uncommitted Read , 'CS' - Cursor Stability , 'RS' - Read Stability , 'RR' - Repeatable Read
BIND_C
DATA CURRENTDATA BIND option: - 'Y' - CURRENTDATA(YES) - 'N' - CURRENTDATA(NO)
BIND_DYNRL
DYNAMICRULES BIND option: - 'B' - DYNAMICRULES(BIND), 'R' - DYNAMICRULES(RUN)
BIND_DEGRE
CURRENT DEGREE value: - 'A' - CURRENT DEGREE = ANY , '1' - CURRENT DEGREE = 1
BIND_SQLRL
CURRENT RULES value: ‘D' - CURRENT RULES = DB2, 'S' - CURRENT RULES = SQL
BIND_CHOLD
Cursor WITH HOLD bind option 'Y' - Initial PREPARE was done for a cursor WITH HOLD, 'N' - Initial PREPARE was not done for a cursor WITH HOLD
STAT_TS
Timestamp of stats when IFCID 318 is started
STAT_EXEC
Number of executions of statement. For a cursor statement, this is the number of OPENs
STAT_GPAG
Number of getpage operations performed for statement
STAT_SYNR
Number of synchronous buffer reads performed for statement
STAT_WRIT
Number of buffer write operations performed for statement
STAT_EROW
Number of rows examined for statement
STAT_PROW
Number of rows processed for statement
STAT_SORT
Number of sorts performed for statement
STAT_INDX
Number of index scans performed for statement
STAT_RSCN
Number of table space scans performed for statement © YL&A 1999-2009
23
Important information here includes the number of sorts processed and the various counts of the number of rows processed. A critical piece of information here is the STAT_EXEC column, which is the number of executions. With this column you can quickly tell how often the SQL statement is used, and thus determine if the other totals are due to frequency of execution or a poor or inappropriate access path, or maybe both!
© YL&A 1999 - 2005
23
DB2 UDB for z/OS
9/21/2009
DSN_STATEMENT_CACHE_TABLE (cont..) STAT_PGRP
Number of parallel groups created for statement
STAT_ELAP
Accumulated elapsed time used for statement
STAT_CPU
Accumulated CPU time used for statement
STAT_SUS_SYNIO
Accumulated wait time for synchronous I/O
STAT_SUS_LOCK
Accumulated wait time for lock and latch request
STAT_SUS_SWIT
Accumulated wait time for synchronous execution unit switch
STAT_SUS_GLCK
Accumulated wait time for global locks
STAT_SUS_OTHR
Accumulated wait time for read activity done by another thread
STAT_SUS_OTHW
Accumulated wait time for write activity done by another thread
STAT_RIDLIMT
Number of times a RID list was not used because the number of RIDs would have exceeded one or more DB2 limits
STAT_RIDSTOR
Number of times a RID list was not used because not enough storage was available to hold the list of RIDs
EXPLAIN_TS
When statement cache table is populated
SCHEMA
CURRENT SCHEMA value
STMT_TEXT
Statement text
STMT_ROWID
Statement ROWID
© YL&A 1999-2009
24
There are a lot of important columns here. The two most important are the STAT_ELAP and STAT_CPU, which are the accumulated elapsed and CPU time for the statement. Lots of other accumulated wait times can help you identify potential bottlenecks.
© YL&A 1999 - 2005
24
DB2 UDB for z/OS
9/21/2009
Case Study
The following is some actual documentation about how we performance tuned a set of dynamic applications at a customer location. Each application used dynamic SQL from local or remote servers, and each application was assigned it’s own authid.
© YL&A 1999 - 2007
25
DB2 UDB for z/OS
9/21/2009
Customer Environment
Very Large DB2 Customer Selling Stuff
– Hundred of Thousands of Product Sales per Day – Many Production Applications – Many Traditional Batch and CICS COBOL Programs – Many Newer WebSphere Java Applications
Proper Performance Monitoring Setup
– Accounting Trace Classes 1,2,3,7,8 Going to an Online Monitor and SMF – Statistics Trace Classes 1,2,3,4,5,6 Going to an Online Monitor and SMF – IFCID 316 and 318 Turned On – Each Application has It’s Own Authid – Application Authid Used for All SQL Access in a 3-Tier Environment
DB2 Accounting Information Gathered Daily
– Summarized by Authid – Stored in a DB2 Table Web Client
Application Server
SQL
DB2 for z/OS © YL&A 1999-2009
26
The customer in question was a large scale customer who had an established base of legacy CICS/COBOL programs, but was moving large volumes of applications into an new enterprise architecture. This new architecture involved object based design with modern programming languages and remote applications servers. What resulted was a large volume of remote dynamic SQL that no one could track and tune. Each application was assigned its own authid and so DB2 accounting information could be summarized at this level and reported by application. In that way we could address the application that used the most CPU first. This is what the customer was looking for; a reduction in CPU consumption as Christmas was approaching and they did not want to be CPU constrained. They also did not want to upgrade their processors.
© YL&A 1999 - 2009
26
DB2 UDB for z/OS
9/21/2009
Candidates for Tuning Identified
DATE
The Summarized Accounting Trace Information Was Sorted CPU Descending USERID NUM_OCCURSNUM_COMMIT TOT_SQL TOT_CL1_ETIME TOT_CL2_ETIME TOT_CL1_CPU TOT_CL2_CPU 8/13/2008 DMDMGMTE 739 271863 4950819 463868.28 67608.1 11316.93 9203.72 8/13/2008 ORDPAYE 271 846634 22814294 167444.04 76915.42 8474.18 5475.73 8/13/2008 ORDFLOWE 996 1687202 11789851 606859.96 87851.92 9210.24 5358.61 8/13/2008 ECR 2660 2660600 9356683 0 75955 4806.04 4259.51 8/13/2008 ORDLISTR 1101 820744 24710965 643831.35 46937.41 5842.16 4158.88 8/13/2008 CNTHSTRY 172 169399 537350 0 106305.84 3270.66 3232.81 8/13/2008 ORDDETR 768 1732214 4914508 474589.49 22508.79 3397.72 2433.64 8/13/2008 MEMBCONT 382 381398 13828999 0 23616.75 2347.35 1894.35 8/13/2008 CUSFNMGT 638 636796 4651396 0 57932.98 2095.29 1872.66 8/13/2008 EDFT 805 788417 5046995 0 12606.19 1698.2 1370.68 8/13/2008 PRICINGE 188 58394 531276 113938.73 8235.11 1502.44 1344.02 © YL&A 1999-2009
27
We collected the DB2 accounting data (class 1,2,3) from the SMF records, ran reports, and then loaded important fields from the reports into a DB2 table. Queries were used to organize the data by CPU consumption daily. We tracked the applications that used the most CPU over several months. Those applications would be the first we examine. In this report you can see that the application with the DMDMGMTE authid is a very large consumer of CPU. This was true every day.
© YL&A 1999 - 2009
27
DB2 UDB for z/OS
9/21/2009
Gather Statement Cache Statistics via EXPLAIN
A DBA with SYSADM Privilege
–Creates a DSN_STATEMENT_CACHE TABLE –Runs EXPLAIN STMTCACHE ALL
Then We Formulate a Query for our Target Authid
–Initial Query Gets Basic Information –Sorts by CPU Descending
© YL&A 1999-2009
28
Once we had an idea of which application we wanted to look at, we had the DBA create a statement cache table and issue an EXPLAIN STMTCACHE ALL statement. That same DBA granted us SELECT authority to the table, and we were ready to analyze. Our initial goal was to query the table for the authid of the leading CPU consumer (DMDMGMTE) and sort the result CPU descending. That way we see the overall most expensive statement for this application.
© YL&A 1999 - 2009
28
DB2 UDB for z/OS
9/21/2009
Statement Cache Table Simple Query
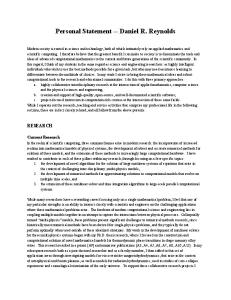
This Simple Query Does Two Things
–Identifies High Consuming Statements for an Authid –Formats the Output in an Easy to Read Form SELECT cached_ts, STAT_EXEC, dec(stat_elap,12,2) as stat_elap, dec(STAT_CPU,12,2) as stat_cpu, left(STMT_TEXT,100) as short_text from UID1.DSN_STATEMENT_CACHE_TABLE where primauth = ‘DMDMGMTE' order by stat_cpu desc
© YL&A 1999-2009
29
Here is an example of the query against the statement cache table. We filter by the authid and sort by CPU descending. Since the elapsed time and CPU time columns have a floating point data type we convert to a decimal data type to make the output a little easier to read. We also apply a built-in function to the statement text so that very long statements don’t cause trouble with our query tool’s limitations.
© YL&A 1999 - 2009
29
DB2 UDB for z/OS
9/21/2009
Statement Cache Query Example Output
Bam! Mystery Solved. We Have Found the Potential Problem Statement
© YL&A 1999-2009
30
Wow! Our application that uses the most CPU has one statement that is responsible for a very large percentage of the total CPU the application consumes. Addition investigation would show that the elapsed time for this query was about the same as the CPU time, meaning that the query ran quickly and may not have been noticed as a poor performer without this information.
© YL&A 1999 - 2009
30
DB2 UDB for z/OS
9/21/2009
Next Steps
Extract Full Text of High Consuming Statement EXPLAIN the Statement
–Optimization Service Center –SPUFI –EXPLAIN STMTCACHE STMTID 1083216 Analyze the Access Path Tune the Query
© YL&A 1999-2009
31
Now that we have discovered a single statement using a significant amount of CPU we can isolate that statement, EXPLAIN it, and see if it can be tuned, cached, or avoided!
© YL&A 1999 - 2009
31
DB2 UDB for z/OS
9/21/2009
Recommendations
Don’t Let Statement Cache Table get Too Big
– Can Get Very Large – Statement Text is a BLOB – Slows Down EXPLAIN STMTCACHE ALL – Delete Old Output or Archive It
Text Column can be Difficult
– Most Functions Don’t Work – Hard to Search for Tables – I Put Output from Query to Flat File and Search That
Put Comments in your Application’s SQL Statements
– The Comment Appears in the Statement Text Column of the Statement Cache Table – Easier to Find the Statements in Application Code – Putting a Method Name in a Comment is Quite Good © YL&A 1999-2009
32
If you put SQL comments in you statement text they will appear in the statement cache table without messing up the statement execution. Here is an example: SELECT LASTNAME –GetEmpLastName method FROM EMP WHERE EMPNO = ?
© YL&A 1999 - 2009
32
DB2 UDB for z/OS
9/21/2009
Conclusion
Explaining the Statement Cache is Very Powerful for Tuning Use This as part of a Comprehensive Tuning Effort
– “Spot” Tuning can be Wasteful
Don’t Forget to Produce Reports on the Improvement!
– Give These to Management for Your Well Deserved Raise Produce Produceaa Report Report
Performance Performance Reports Reports To Determine What to To Determine What to Tune Tune
Repeat Repeat
Implement Implementaa Tuning TuningChange Change
Performance Performance Reports Reports To Monitor the Impact to To Monitor the Impact to the Change Across All the Change Across All Applications Applications
© YL&A 1999-2009
33
Getting the performance metrics out of the dynamic statement cache can be an extremely valuable tool for performance tuning your dynamic remote applications. Please remember to make this work part of a comprehensive performance reporting and tuning effort. Also make sure you report the impact of tuning so that management understands and supports the work that you do!
© YL&A 1999 - 2009
33
DB2 UDB for z/OS
9/21/2009
Session F01 Snapping the DB2 for z/OS Dynamic Statement Cache Daniel L Luksetich
YL&A
[email protected]
© YL&A 1999-2009
34
Thank you!!!
© YL&A 1999 - 2009
34