Order Statistics in Digital Image Processing IOANNIS PITAS AND ANASTASIOS N. VENETSANOPOULOS, FELLOW, IEEE
In recent years significant advances have been made in the development of nonlinear image processing techniques. Such techniques are used in digital image filtering, image enhancement, and edge detection. One of the most important families of nonlinear image filters is based on order shztktics. The widely used median filter is the best known filter of this family. Nonlinear filters based on order statistics have excellent robustness properties in the presence of impulsive noise. They tend to preserve edge information, which is very important to human perception. Their computation is relatively easy and fast compared with some linear filters. All these features make them very popular in the imageprocessing community. Their theoretical analysis is relatively difficult compared with that of the linear filters. However, several new tools have been developed in recent years that make this analysis easier. In this review paper an analysis of their properties as well as their algorithmic computation will be presented.
I. INTRODUCTION Linear processing techniques are very important tools that are used extensively in digital signallimage processing. Their mathematical simplicity and the existence of a unifying linear systems theory make their design and implementation easy. Moreover, linear processing techniques offer satisfactory performance for a variety of applications. However, many digital image processing problems cannot be efficiently solved by using linear techniques. An example where linear digital image processing techniques fail is the case of non-Gaussian andlor signaldependent noise filtering (e.g. impulsive noise filtering). Such types of noise appear in a multitude of digital image processing applications. Impulsive noise is frequently encountered in digital image transmission as a consequence of man-made noise sources or decoding errors. Signaldependent noise is the photoelectron noise of photosensing devices and the film-grain noise of photographic films [l]. Speckle noise that appears in ultrasonic imaging and in laser imaging is multiplicative noise; i.e. it is signaldependent noise. Another example where linear techniques fail is the case of nonlinear image degradations. Such degradations occur during image formation and during image transmission through nonlinear channels [ 11, [5]. The Manuscript received August 29, 1990; revised July 22, 1992. I. Pitas is with the Department of Electrical Engineering, University of Thessaloniki, Thessaloniki 54006, Greece. A. N. Venetsanopoulos is with the Department of Electrical Engineering, University of Toronto, Toronto M5S 1A4, Canada. IEEE Log Number 9206277.
human visual perception mechanism has been shown to have nonlinear characteristics as well [2], [ 5 ] . Linear filters, which were originally used in image filtering applications, cannot cope with the nonlinearities of the image formation model and cannot take into account the nonlinearities of human vision. Furthermore, human vision is very sensitive to high-frequency information. Image edges and image details (e.g. corners and lines) have highfrequency content and carry very important information for visual perception. Filters having good edge and image detail preservation properties are highly suitable for digital image filtering. Most of the classical linear digital image filters have low-pass characteristics [3]. They tend to blur edges and to destroy lines, edges, and other fine image details. These reasons have led researchers to the use of nonlinear filtering techniques. Nonlinear techniques emerged very early in digital image processing. However, the bulk of related research has been presented in the past decade. This research area has had a dynamic development. This is indicated by the amount of research presently published and the popularity and widespread use of nonlinear digital processing in a variety of applications. Most of the currently available image processing software packages include nonlinear techniques (e.g. median filters and morphological filters). A multiplicity of nonlinear digital image processing techniques have appeared in the literature. The following classes of nonlinear digital imagehignal processing techniques can be identified at present: 1) order statistic filters 2) homomorphic filters, 3) polynomial filters, 4) mathematical morphology, 4) neural networks, and 5) nonlinear image restoration. One of the main limitations of nonlinear techniques at present is the lack of a unifying theory that can encompass all existing nonlinear filter classes. Each class of nonlinear processing techniques possesses its own mathematical tools that can provide reasonably good analysis of its performance. Cross-fertilization of these classes has been shown to be promising. For example, mathematical morphology and order statistic filters have been efficiently integrated in one class, although they come from completely different origins. In the following, we shall focus on the description of the order statistics techniques. Although such techniques have been applied to digital signal processing as well, most
0018-9219/92$03.00 0 1992 IEEE PROCEEDINGS OF THE IEEE, VOL. 80, NO. 12, DECEMBER 1992
1893
of the reported work has been applied to digital image processing. We shall focus our presentation on digital image processing applications, in order to render it more concise. We shall also give links to other nonlinear filter classes, whenever applicable. The class of filters based on order statistics is very rich. The best known filter is the median filter. It originates from robust estimation theory. It was suggested by Tukey for time series analysis [6]. Later, it became popular in digital image processing because of its computational simplicity and its good performance. Its statistical and deterministic properties have been studied thoroughly. Since its first use, several modifications and extensions of the median filter have been proposed. Many of them have solid theoretical foundations from the theory of robust statistics [7]-[9]. However, there are also filters based on order statistics that have ad hoc structures, due to the lack of a powerful unifying theory in the area of nonlinear filtering. Several efforts have been made in the past decade to provide a unifying theory in the area of order statistics filtering. Some fruitful results based on threshold decomposition (to be described later) are expected to provide useful design and implementation tools. In general, filters based on order statistics have good behavior in the presence of additive white noise or impulsive noise, if they are designed properly. Many of them have good edge preservation properties. The adaptation of order statistics filters is a very important task. It is well known that image characteristics (e.g. local statistics) change from one image region to the other. Noise characteristics usually vary with time. Thus, digital image filters based on order statistics must be spatially and/or temporally adaptive. Furthermore, the characteristics of the human visual system (e.g. edge preservation requirements, local contrast enhancement) lead to spatially adaptive digital image filter structures as well. Another reason for the adaptation of the order statistics filters has to do with the difficulties encountered in the optimal design of such filters for certain characteristics of signal and noise. Although order statistics filters are based on rich mathematical foundations, such design algorithms do not exist or are difficult to implement. One of the main reasons for the popularity and widespread use of certain filters based on order statistics is their computational simplicity. Their computation can become faster if appropriate fast algorithms are designed. Several such algorithms have appeared in the literature, especially for the fast (serial or parallel) implementation of the median filter. Another research activity is the design of special VLSI chips for order statistics filtering. A number of chips for fast median and max/min filtering have been presented in the literature. The related efforts for fast filter implementation are reviewed in this paper as well. The organization of the paper is as follows. Section I1 includes the probabilistic and the deterministic properties of the median filter and its modifications. The analysis is rather detailed, since it provides the tools and methods for the evaluation of the performance of the rest of the order 1894
statistics filters. Section 111 gives an overview of several filters that are based on order statistics. It also includes the description of certain filters that are not based on order statistics but are related to them though robust estimation theory. Adaptive order statistics filters are presented in Section IV. Algorithms and image processor architectures suitable for fast order statistics filtering are given in Section V. Conclusions are drawn in Section VI. AND ITS EXTENSIONS 11. THE MEDIANFILTER
The median filter is the most popular example of filters based on order statistics [4], [5]. Order statistics have played an important role in statistical data analysis and especially in the robust analysis of data contaminated with outlying observations, called outliers [4], [7], [8]. One of the most important applications of order statistics is robust estimation of parameters [7]-[9]. The median is a prominent example of robust estimators. In the following, a brief introduction to some concepts of robust statistics will be given. This description aims at giving some definitions that will be used in the description of the robustness properties of the median filter. Let us suppose that the random variables X i , i = l , . .. ,n, are distributed according to a known parametric probability function F(X, e).Such parameters can be the mean and the standard deviation; i.e., eT = [ p 171.The parameter vector 8 has to be estimated from the observation data X i , i = 1 , . . . ,n. Mean and standard deviation estimations correspond to location and scale estimation. The estimators have the form where T ( X 1 , . . , X n ) denotes a function of X I , . * * , X n . Often, there are some observation data (outliers) that have very different probability distributions from the model F(X, Therefore, the probability distribution model is only approximately valid. Robust estimation theory proposes estimators for approximate parametric models, which minimize the effect of the outliers. An estimator can have two robustness measures. The breakdownpoint E* (0 5 E 5 1 ) determines the percentage of the outliers, above which the estimator becomes unreliable [7], [8]. If an estimator has breakdown point E* = 1/2 (e.g. the median), it is reliable only if less than 50% of the observation data outlie from the model distribution. A formal mathematical definition of the breakdown point can be found in [7]. The influence function I F ( x ;T ,F ) of an estimator shows the effect of a single outlier on the performance of the estimator at a point 2. It is defined as follows [7]: +
e).
I F ( a ;T ,F ) = lim
T((1-t)F
+ tA,) - T ( F ). t
t-0
(2)
The gross-error sensitivity y* measures the worst effect of a contamination at any point x : y* = sup IIF(z;T ,F)I
(3)
X
with sup denoting supremum. If y* is finite, the estimator T is said to be B-robust at the distribution F . The performance of an estimator is directly related to its output PROCEEDINGS OF THE IEEE, VOL. 80, NO. 12, DECEMBER 1992
variance, V ( T ,F ) . The smaller the variance, the better the performance of the estimator. The relative efficiency of two estimators T ,S at data distribution F is measured by their asymptotic relative efficiency, ARE(T,S):
Input
(4) output
Here V ( S ,F ) , V ( T ,F ) are the variances of the estimators T , S at the distribution F . The higher A R E ( T , S ) is, the better the performance of the estimator T over the estimator S. The calculation of the ARE of various estimators and its relation to the influence function can be found in [7]. The previous description of robust estimation concepts is far from complete. The interested reader can find more details in [5]-[9]. Robust estimation has found significant applications in digital signal processing [141-[24]. An excellent review in this area is [19]. Having defined some basic notions of robust estimation, we proceed to the definition and analysis of the median filters. Let X I ,X,, . . X , be random variables. If they are arranged in ascending order of magnitude, +
)
X(1) I X(2) I . . *
IX(n) 7
(5)
X ( * )is called the ith-order statistic. The maximum and the minimum of X i , i = 1 , . . . !n are denoted by X(n),X(1) respectively. A very important order statistic is the median m e d ( X i ) , given by
..... ... .. . . ..... . ..... ..... ..... ..... . ..... . . . . e . .
. . . e .
m
.
0
.
0 . .
SQUARE
CIRCLE
CROSS
X-SHAPE
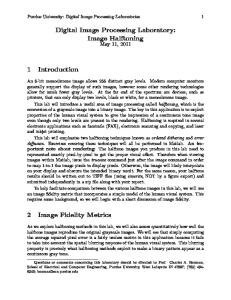
(b) Fig. 1. (a) Filtering of a three-valued sequence by a median filter of length n = 3. (b) Windows of two-dimensional median filters.
Statistical analysis presents the statistical properties of the median filter output. Deterministic analysis presents certain structural properties (e.g. the shape of signals that are invariant under median filtering).
A. Statistical Analysis If X i , i = 1,. . !n are independent identically distributed (iid) random variables having cumulative density function (cdf) P ( x ) ,the cdf of the r-th order statistic, X(,), is given by
A one-dimensional median jilter of size n, n = 2u + 1, is defined by the following relation [25]: yi = med(xi-,, . . . , xi,... , xi+v), i E 2,
(7)
where 2 denotes the set of integers. In most cases, filter windows having odd length are used, due to the simplicity of the corresponding definition, as can be seen in (6). The signal sequence is of finite extent in most practical cases. It is appended by appropriately chosen values (usually 0's) at both ends in order to accommodate boundary problems. An example of filtering a three-level sequence by a median filter (7) of length n = 3 is shown in Fig. l(a). The input sequence has been appended by one sample at the beginning and at the end, respectively, to create the necessary boundary conditions. A two-dimensional median jilter has the following definition: ~ i =j
med(xi+,,j+,; ( r ,3) E A ) , (4j)E 2'.
(8)
The set A c Z2 is the filter window. Such windows are shown in Fig. l(b). The window shape influences certain spatial properties of the median filter, e.g. edge and image detail preservation. Analog versions of the median filter have also been defined. Their definition and properties can be found in [26] and [27]. Having defined the median filter, we can proceed to the presentation of its properties. PITAS AND VENETSANOPOULOS: ORDER STATISTICS
The probability density function (pdf) fr(x)of X(,) is given by
f,(x) =
.(" -
r - 11 ) P y x ) [ 1 - P(z)],-'p(z),
(10)
where p(x) is the pdf of X i , i = 1, . . , n. The cdf and pdf of the median can be found from (9) and (10) by substituting r = v + 1. It can be easily seen from these relations that the analytic calculation of the cdf and the pdf of the median filter output is cumbersome, even for the iid case. This fact makes the theoretical analysis relatively complicated. Numerical methods for the calculation of the pdf and cdf can be found in [lo] and [ll]. Order statistic distributions have been used in optimal data sorting [12]. The interested reader is referred to [4] for the calculation of the expected values and moments of order statistics [13]. As stated previously, the output variance is of particular importance to median filter performance. The smaller the variance, the better the filter performance. It has been shown that median filters perform well for long-tailed noise distributions (e.g. Laplacian noise), whereas their performance is poor for short-tailed noise distributions (e.g. uniform noise) [7]-[9]. This fact suggests that the median filter is efficient at removing impulsive noise. The good performance of the e
1895
Table 2
Table 1 Asymptotic Relative Efficiency of the Median Filter with Respect to the Arithmetic Mean
Rate of Failure of the Median Filter in Removing Impulse Noise Window Sue
Impulse Rate
~~
Uniform Distribution
Gaussian Distribution
Laplacian Distribution
0.33
0.637
2.0
n
P
3
5
9
2.5
0.1
0.028
0.0086
0.00089
0.0000002
0.2
0.104
0.058
0.0196
0.00037
0.3
0.216
0.163
0.099
0.017
0.4
0.352
0.317
0.267
0.154
0.5
0.5
0.5
0.5
0.5
~~
ARE
~
median filter at long-tailed distributions is explained by the fact that it minimizes the L1 norm [5],[9]: a
12; - T,I i=l
-
min.
(11)
According to (ll), the median is the maximum likelihood estimate (MLE) of location for the Laplacian distribution: f(2)=
1
ne-’z’. L
of existence p in a constant image neighborhood, the probability of correct reconstruction, P ( n ,p ) , is given by 1251
Traditionally, the median filter performance is compared to the performance of the moving average filter:
(15)
The probabilities of erroneous reconstruction, 1 - P(n,p), are given in Table 2. It can be seen that a 3 x 3 median filter (n = 9) can reject impulses having 30% probability of occurrence with probability of success over 90%. Figure 2 illustrates that the median removes impulses efficiently, whereas the moving average fails to do so. The median filter has low-pass characteristics if its input is white additive noise, as can be found by examining the autocorrelation function and the power spectrum of its output [ 5 ] , [28]. The autocorrelation function can be calculated numerically by the joint pdf of the filter output [28]-[30]. In the case of nonwhite input noise, the evaluation of median filter performance is much more difficult. Its performance is certainly inferior to that of the moving average filter [25]. As stated in the introduction, edge information is very important for human perception. Therefore, its preservation and, possibly, its enhancement constitute a very important subjective feature of the performance of an image filter. Edges, by definition, contain high frequencies. Therefore, low-pass linear filters, e.g. the moving average filter, smooth them and produce images which are unpleasant to the eye. In contrast, the median filter tends to preserve the edge sharpness, owing to its robustness properties. An idealized noisy vertical edge model of height h is shown in Fig. 3(a). It is described by the following equation:
and it is unbounded. Therefore, the moving average filter is very susceptible to impulses. The breakdown point of the median is E* = 1/2. The median becomes unreliable only if more than 50% of the data are outliers. The arithmetic mean has E* = 0. Even a single outlier can destroy its performance. The statistical and robustness properties of the median make it very suitable for impulsive noise filtering. The performance of the median in impulsive noise filtering can be measured by the probability of correct signal reconstruction. If the impulses have constant value and probability
where h denotes the edge height and zij is white noise. It is clearly seen, by comparing parts (b) and (c) of Fig. 3, that the median filter preserves edges much better than the moving average filter. Figure 4 shows an image corrupted by additive Gaussian noise. The 7 x 7 median filter produces a much more pleasant output than that of a 7 x 7 moving average filter, because it does not blur edges. However, the median filter output contains more
. .
3=t--Y
which is essentially a “moving” arithmetic mean. The arithmetic mean is the MLE estimate of location for the Gaussian distribution and it minimizes the L2 norm. The asymptotic relative efficiency of the median versus the arithmetic mean ARE(med(si),Z) (4) is shown in Table 1. It can easily be seen that the median is more efficient for long-tailed distributions, whereas the arithmetic mean is more efficient for the Gaussian distribution and for shorttailed distributions. This means that the moving average filter performs better than the median filter in additive Gaussian noise removal [5], [25]. The ARE(med(zi),3 ) for various other distributions can be found in [5] and [9]. The median is a B-robust operator, because its influence function is bounded [7]:
Therefore, a single outlier (e.g. impulse) can have no effect on its performance, even if its magnitude is very large or very small. The influence function of the arithmetic mean for the Gaussian distribution is given by [7]
I F ( 2 ;3 , F ) = 2
1896
PROCEEDINGS OF THE IEEE, VOL. SO, NO. 12, DECEMBER 1992
7
--
(c)
(4
Fig. 2. (a) Original image; (b) image corrupted by salt-pepper noise; (c) 3 x 3 median filter output; (d) 3 x 3 moving average filter output.
noise in the homogeneous image regions than the moving average filter output. A quantitative analysis of the edge preservation properties of the median filter can be found in [32]-[34]. The median filter not only smooths noise in homogeneous image regions; it also tends to produce regions of constant or nearly constant intensity [35]. The shape of these regions depends on the geometry of the filter window. Usually, they are either linear patches (streaks) or blotches. These effects are undesirable because they are perceived as lines or contours, which do not exist in the original image. A theoretical analysis of the streaking effect can be found in [35]. Rabiner et al. [36] proposed postprocessing of the median filter output by short linear smoothers. However, if streaking is still a serious problem, the only solution is to use other order statistics filters, to be described later on in this section.
invariant under median filtering [37]-[39]. Median roots have found applications in speech and image coding [38], [43], [49]. Several problems are related to the median roots. The first one is the determination of the shape of a signal which is a root of a one- or two-dimensional median filter. The second problem concerns the construction and counting of the number of median roots. The third problem is the rate of convergence of a nonroot signal to a root after successive passes through the median. These three problems form the subject of the deterministic analysis of median filters. Certain concepts which are used in the deterministic analysis of a median filter of length n = 2v 1 have to be defined. A sequence xi is monotonic if xi 5 xj or xi 2 xj for every i < j. A sequence xi is locally monotonic of length m if the subsequence (xi,... , xi+m--l)is monotonic for every
B. Deterministic Analysis A very important tool in the analysis of linear systems is their steady-state behavior with sinusoidal inputs. It is known that the frequency of a sinusoid is not changed when it passes through a linear system. Only its phase and amplitude are changed. Of course, this is not valid for median filters, because they are highly nonlinear systems. Therefore, many researchers have focused on the problem of finding signals (called roots or fixed points), which are
A constant neighborhood consists of at least v 1 consecutive identically valued points. An edge is a monotonic region between two constant neighborhoods having different values. If a signal xi is a root of a median filter of length n = 2v+1 and has a monotonic segment of length v, xi is locally monotonic of length v 2 [37]. This practically means that, with the exception of certain periodic signals, a root consists of constant neighborhoods and edges. It has also
+
2.
+
+
1897
PITAS AND VENETSANOPOULOS: ORDER STATISTICS
--n
60
60
50
50-
4030-
2010
10
0
OpN--.--10
-10
- 0 2 -
0
-
50
loo
150
203
250
-
-20-
I
I
I
I
I Y)
U)
0
Fig. 3. (a) Noisy image edge. (b) Its degradation by a moving average filter. (c) Median filter output.
been shown that, for finite-length signals, a signal is a root if and only if it consists of constant neighborhoods and edges [39]. The patterns of the roots of two-dimensional medians are much more complicated. The interested reader can find more details about their shape in [37], [40]. Locally monotonic signals and their linear regression have been proposed for digital signal smoothing [41], [42]. If k-valued signals of finite length L are considered, the number of median roots is finite and depends on k, L. Therefore, they can be counted and constructed in a deterministic way [43], [46]. In the following, binary signals (k = 2 ) will be considered, because it will be shown later on that the median of a k-valued signal can be decomposed to the median of binary signals. Let us assume that the median size is n = 3 (v = 1). The binary root signal of such a median consists of constant neighborhoods of minimal length 2, i.e., (00), (11) and of transitions (edges) of the form (Ol), (10). The signal sequence 2 1 , 5 2 , . . . is padded by the sample 20 at its starting point. If the first sample, 2 1 , is assumed to be zero, the appended sample 20 has to be 0 too. They already form a constant neighborhood (00). The second sample, 2 2 , can be either 1 (forming an edge) or 0 (continuing the constant neighborhood). Therefore, ( ~ 0 2 1 2 2 )can have two allowable states (000) or (001). This process can be 1898
repeated until sequences of length L are constructed. It can be described by the tree structure, shown in Fig. 5. In this figure each path represents a signal. The nonroot signals are denoted by X. Therefore, by counting the allowable paths, the number of roots can be found. The number of roots of a three-point median, n = 3, which have length L is given by 1431
As expected, the number of roots increases very fast with their length L. A similar formula can be found for k-valued roots of medians having arbitrary window size n. Their number increases tremendously with k and n [44], [45]. Each finite length nonroot signal must converge to a root signal after consecutive passes with a median filter [39]. It has been proved [47] that a nonroot signal will converge to a root in at most 31-1 passes of a median of length n = 2v 1. Usually, fewer passes are required [45]. Convergence theorems are presented in [48]. An example of a three-level signal that converges to a root is shown in Fig. 6. Two median passes are required in this case. Several modifications and extensions of the median filters have been proposed in the literature. Some of them (e.g. stack filters) have rigorous mathematical foundations and
+
PROCEEDINGS OF THE IEEE, VOL. 80, NO. 12, DECEMBER 1992
(4
(4
Fig. 4. (a) Original image. @) Image corrupted by additive white Gaussian noise having standard deviation 100. (c) Output of the 5 x 5 moving average filter. (d) Output of a 5 x 5 median filter.
-I‘
J
V
L
Input
L
B 1
0 -
1
D
r
Fig. 6. A nonroot signal and its convergence to a root after two consecutive median passes.
Fig. 5. Tree structure for the binary mots of a median filter of length 3.
provide a unifying framework for the design of filters based on order statistics. Other (e.g. separable median filters) aim at the reduction of the computational complexity for median filter computation. Finally, certain filters (e.g. multistage median filters, median hybrid filters) have been designed PITAS AND VENETSANOPOULOS: ORDER STATISTICS
to improve the image detail preservation properties of the median filter. In the following we shall give a brief description of these filters. 1) Threshold Decomposition and Stack Filters: Median filtering of binary signals is relatively easy and fairly well understood. Its computation can be reduced to counting the 1’s inside the filter window. If their number is greater than or equal to v 1, the output of the median is 1; otherwise it is 0. Furthermore, the properties of binary signals in median filtering are fairly well understood. Therefore, it is attractive from both a practical and a theoretical point
+
1899
property. The output of a stack filter is given by M-1
yi
.. .
...
M-1
y p = Sf(
=sf(zi) = j=1
Tj(Zi)) =
j=1
Yi
j=1
Fig. 7. Threshold decomposition of a median filter
of view to reduce the median filtering of k-valued signals to median filtering of binary signals. This can be obtained by the threshold decomposition of the median filter [50]. Let xi be an M-valued signal: 0 5 xi 5 M - 1, and consider the M - 1 thresholds: 1 5 j 5 M - 1. The signal xi can be decomposed to M - 1 binary valued signals x?), 1 5 j 5 M - 1 by using a threshold decomposition function T’(zi) as follows:
These M - 1 binary valued signals can be filtered independently:
The Mth valued median output yi can be reconstructed by summing the binary output signals: M-1 j=1
A schematic diagram of the threshold decomposition of median filters is shown in Fig. 7. Threshold decomposition has both theoretical and practical significance for median filtering [50], [51]. It has been used to find the statistical distribution of the output of the median filter and of the roots of the median filter [51], [52]. It has also been used to develop architectures for fast median filtering [53]. Let us suppose that we denote the vector of the binary signals xp’ and the vector of multivalued signals x; by zz(j) = ( ~ ! 3 - ) ~ , . . . , ~ 1 1 C ) , ] ~and zz = [x;-,,...,x;+,]T respectively. We denote by f(z) a binary operator that operates on a binary vector of length n. We decompose the vector zi by threshold decomposition and we apply the binary operator f at each level j = 1, . . . , M - 1 independently. The outputs of these binary filters possess what is referred to as the stacking property if the binary output signals yi(j), 1 5 j 5 k - 1 are piled and the pile of y; at time i consists of a column of l’s having a column of 0’s on top. The filters that support the stacking property are called stack filters. Their structure is similar to the one shown in Fig. 7, where the binary medians are replaced by the binary operators f . Stack filters possess both the threshold decomposition structure and the stacking
j=1
Stack filters constitute a broad class of nonlinear filters having median filters as a special case. For example, the binary median filter operating on a binary signal xi is essentially a Boolean function f of the binary variables xi--v,. . . ,xi,. . . ,xi+,. Its form is given by the following relation for the filter length n = 3 [53]: yi = xi-12;
+
ZiZi+l
+
Zi+lZi-l,
(23)
.,+
where denote Boolean operators. Such a binary function operates in (20) on each binary signal xi(j), 1 5 j _< M - 1 obtained by the threshold decomposition. This remark greatly facilitates the VLSI implementation of the median filter based on threshold decomposition [53]. The class of stack filters is very large. Their number, when the filter window is n, grows faster than 22n’2 [58]. The problem of finding them reduces to the problem of finding stackable Boolean functions, because it is the Boolean functions that determine the properties of the decomposed filter. It has been established that a Boolean function f is stackable if and only if it contains no complements of the input variables of the form 3;. Thus, the stackable functions are also called positive Boolean functions. The binary median (23) is stackable because it does not contain complements of any of the inputs xi-1, xi,xi+l. The number of the positive Boolean functions is finite for finite filter length n. There are, respectively, 20 and 7581 such functions for n = 3 and 5. Examples of stackable functions for n = 3 are the following: y; = 2;
+
yi = xi-1x2
x;-1xi+1
+ zix;+1.
(24) (25)
The stack filters based on (24) and (25) are called asymmetric medians because they eliminate negative and positive impulses, respectively. Any composition of the stack filters can be expressed by a single stack filter, due to a similar property of the positive Boolean functions. Generalized stack filters have also been proposed [56], [57]. Such filters allow more than one binary signals to be fed to the binary filters f . Furthermore, different binary filters f; are allowed at the various thresholding levels. Recursive stack filters have also been proposed and their properties have been analyzed [60]. Great advances have been made recently in the design of stack filters [54]-[59]. An estimation approach and a structural approach have been proposed [57]. The estimation approach employs the minimum absolute error (MAE) criterion because of its robustness [54], [55]. Let us suppose that a signal si is corrupted by noise and that the observed
1900
PROCEEDINGS OF THE IEEE, VOL. 80, NO. 12, DECEMBER 1992
-----I
signal xi is produced. This signal is fed to a stack filter S f whose output is yi. The MAE is given by
E = E [ ( . s-~yiI] = E[lsi - S f ( ~ i ) = (] M-1
E(1
M-1
($1
( s p - S(Zbj)>)l].
- Sj(Tj(Si))J] = E[I
2) Separable Median Filter: A separable two-dimensional median filter of size n results from two successive applications of a one-dimensional median filter of length n along rows and then along columns of an image (or vice versa): yiJ = med(z;,j
z a j , . . . , za., j + u )
(33)
j=l
j=1
(26) It can be proved [55] that the MAE takes the form M-1
E[lsd" - f(zj")l]
E =
(27)
j=1
and it is decomposed to the sum of errors at each threshold level. Based on this reduction, a binary function f can be chosen in such a way so that it minimizes a cost function. Let zj be a binary vector of length n. The output of the binary function f ( z j ) is called the decision variable Pf(1Jzj). It can take binary values P f ( l J z j ) = 0 , l . The Boolean function f can be represented as a vector of length 2". Itsjth entry is Pf(1lzj). Let us suppose that we denote by Cj the cost incurred when the function f (zj)produces output 1. It can be shown that the MAE (27) can take the form 2"
E =
CjPf(1JZj).
(28)
j=1
This cost function must be minimized with respect to Pf ( 1J z j ) under the stacking constraint: P f ( 1 J z j ) I Pf(1lzk) if zj
5 Zk
(29)
and the zero-one constraint: Pf(1JZj) = 0 , l .
(30)
The notation z j I Zk means that each element of zj is less than or equal to the corresponding element of z k . This is a zero-one integer linear programming problem. It can be transformed to a linear programming problem [ S I , [59]: 2"
minimize
CjPf(1lzj)
(31)
The separable median filter of length n has greater output variance than a nonseparable one having n x n extent [61]. Its main advantage is its low computational complexity in comparison with that of the nonseparable median filter, because it sorts n numbers two times, whereas the nonseparable n x n median sorts n2 numbers. The deterministic analysis of the separable median filters can be found in [62] and [63]. 3) Recursive Median Filter One intuitive modification of the median filters is to use the already computed output samples yi-,,, . . . , yi-1 in the calculation of yi: yi = med(yi-,
, . . . ,yi-1, xi,. . , xi+,). *
(35)
This filter is a recursive median filter. Its output tends to be much more correlated than that of the standard median filter. This property is easily explained by the fact that the output samples yi-,,, . . . , yi-l contribute directly to the computation of yi. Recursive median filters have higher immunity to impulsive noise than nonrecursive median filters [64]. Furthermore, they have some nice deterministic properties [62]. A signal is invariant to recursive median filtering if and only if it is invariant to standard median filtering. Furthermore, any nonroot signal is reduced to a root signal after just one pass by a recursive median filter. However, this root is not necessarily the same as the root which is obtained by standard median filtering. Fast recursive algorithms for the calculation of two-dimensional median roots can be found in [65]. A variation of the recursive median filter is the separable recursive median filter:
j=1
under the constraints Pj(1lZj)
I q(1Izk) if zj I Z k 0
I Pf(1Jzj) 5 1.
(32)
The quantity Pj(1lzj) can be interpreted as the probability that the filter f will produce output 1 when its input is z j . The filter can be obtained by optimizing either (28)-(30) or (31) and (32). The resulting solutions are not necessarily unique. The computational complexity of the optimization is of the order O(n2"), whereas the direct search of the optimal solution has complexity of the order 0(22""). The above-mentioned design technique has also been used for the design of generalized stack filters [56]. Structural constraints and goals [57] have also been incorporated in the optimization problem [58]. Finally, adaptive versions of stack filters have been defined by using the MAE [59]. PITAS AND VENETSANOPOULOS: ORDER STATISTICS
Recursive separable median filters perform better than the nonrecursive ones in impulsive noise removal [66]. A deterministic analysis of the separable recursive filters can be found in [67]. 4) Weighted Median Filters: The weighted median is the estimator that minimizes the weighted L1 norm of the form n
C w i ~ x i - ~ -"m)i n .
(38)
i=l
Therefore it has close relation to the standard median according to (11). It can be proved that the minimization 1901
of (43) leads to the following explicit form of the weighted median [69]:
T, = med( w1Ox1, . . . ,wnOxn),
(39)
where wOx denotes duplication of x w times: wUx = 2 , . . . ,x
(w times).
(40)
The sum of the weights wi,i = 1,. . . ,n, must be an odd number. The weighted median filter was first introduced by Justusson [25]: yi = med(w-,Oxi-,,.
. . ,w,Ox;+,).
(41)
It is closely related to the FIR filter having the form
Fig. 8. Output distributions of the max/median filter (high curve), when the input distribution is Gaussian (low curve).
The analysis of the performance of the weighted median filter can be found in [69]-[71]. It is shown that it can outperform the median filter [71]. The connection between stack filters and weighted median filters is described in [70]. This connection is used to derive the statistical and deterministic properties of weighted median filters. Weighted median filters have been applied to image filtering and to speckle noise removal in ultrasound images [72], [73]. Finally, weighted median filters have been used in spatiotemporal image sequence filtering [77]. 5) Max-Median Filters and Multistage Median Filters: Several rather unrealistic assumptions are made in the theoretical analysis of the median filters (especially in the deterministic case), e.g. that the image consists of constant neighborhoods and edges. In reality images have fine details, such as lines and sharp comers, which are very valuable for human vision. These details are usually destroyed by medians having relatively large windows (larger than 5 x 5). It is the rank ordering process that destroys the structural and spatial neighborhood information. Thus, several efforts have been made to take into account spatial information in median filter design. Such a modification of the median leads to the max-median filters [74]: Yij
= m ~ ( z l , z 2z3,z4) ,
z2 = med(xi-,,,j, + . ,xij, . . . ,xi+,,j)
(43)
into account by the max/median filter. The max operator produces biasedness toward high intensity levels. Therefore, the m d m e d i a n filter is a biased estimator of the mean, as can be seen in Fig. 8 [74], [75]. Its performance can be improved considerably if the median operator is used to replace the max operator in (43). The resulting filter belongs to what are referred to as multistage median filters. Such filters are described by the following relation: yij = med(med(z1, z2, xij), med(z3,24, xij), xij). (48)
Multistage median filters can preserve details in horizontal, diagonal and vertical directions, because they use subfilters that have regions of support along these directions. Their theoretical analysis can be found in [76]. The use of multistage median filters in moving image processing has been described in [77], [78]. It has been proven that spatiotemporal multistage filtering outperforms both spatial and temporal filtering in terms of noise suppression. Other modifications of the max/median filter can be found in [79]. 6) Median Hybrid Filters: Hybrid filters are a combination of linear filters and median filters. The main purpose of using linear subfilters is to take into account spatial information about the image. The median hybrid filters have the following definition [go]: yi = med(%(x;), . . . , xi)),
where the filters @j(xi),j = 1,. . . , M are linear FIR or IIR filters. The structure of such a median hybrid filter, using FIR subfilters, is shown in Fig. 9. A special case of an FIR hybrid median filter is the following: (45) 1
xi-j, xi, 1
y; = med( j=1
24
= med(xi-,,j-,,
. . . ,x i j , . .. ,
(47)
The subsections of the madmedian filter span the vertical, the horizontal, and the two diagonal lines that pass through the point (i, j). Thus, spatial information is taken 1902
(49)
xi+j).
(50)
j=1
The performance of this median hybrid filter in a noisy step edge is shown in Fig. 10. The sections @ I , @3 lag and lead the edge respectively, whereas @p2 reacts at the edge. Thus spatial information is incorporated in the performance of the median filter and the edge is preserved. The performance of median hybrid filters is analyzed in [go], [Sl], and [83]. PROCEEDINGS OF THE IEEE, VOL. 80, NO. 12, DECEMBER 1992
1 Yi
Fig. 11. Regions of support for two-dimensional FIR median hybrid filters.
Fig. 9. Structure of an FIR median filter.
region of support of a version of the same filter rotated by 45' is shown in the same figure. Two-dimensional median
Xi
hybrid filters preserve fine image details fairly well [84]. However the output variance of a median hybrid filter (50) is approximately equal to that of a moving average filter of half the extent [HI. Therefore, it is less immune to additive white noise than the moving average filter. A VLSI implementation of hybrid median filter is described in [85].
t
I
I
I
1
5
10
15
20
5
10
15
20
* '
Yi 4
Fig. 10. The performance of a median hybrid filter in the presence of an edge.
Modifications of the FIR median hybrid filters with good transient response are presented in [86]. FIR median hybrid filters with predictive FIR substructures have also been designed [82]. The corresponding recursive median hybrid filter is a modification of the filter (50):
The hybrid median filters can be easily extended to two dimensions [84]. Such a filter is described by the following equation:
where zkij, IC = N(orth), S(outh), E(ast), W(est) are FIR filters whose region of support is shown in Fig. 11. The PITAS AND VENETSANOPOUMS: ORDER STATISTICS
BASEDON ORDER STATISTICS 111. FILTERS The class of filters based on order statistics is very rich. Besides the median filter and its modifications, it includes a large number of nonlinear filters. Some of them (e.g. the ranked-order filters and the max/min filters) are straightforward applications of order statistics in filtering. Other filters (e.g. a-trimmed mean filters, L-filters) come from the application of robust estimation techniques in digital signal/image filtering. They are closely related to a large class of robust estimators called L estimators [7]-[9]. This section gives a review of nonlinear filters based on order statistics. It also contains a brief description of some other nonlinear filters that stem from classes of robust estimators, namely from L estimators and R estimators. It will be seen that these filters are related to filters based on order statistics.
A. Ranked-Order Filters An rth ranked-order filter of the signal xi is the rth order statistic: yi = rth order statistic of {xi-,,,.. . xi,.. . ,xi+,,} (53)
of the signal data within the filter window. The probability distribution of the output of a rank order filter has already been described in Section 11. It can be found, by examining the output pdf (10) and the output mean, that the rth rank order filter introduces a strong bias to the estimation of the mean, when the rank is small or large. In this case, the filter tends to perform as a maximum or minimum filter respectively. The bias is even stronger when the input data have a long-tailed distribution. For long-tailed distributions, the output variance attains a minimum when the rth rank is close to the median. This fact is explained by the good performance of the median in long-tailed distributions, as has already been stated in Section 11. For 1903
Var
51i
Gaussian /
rank 4
1
1
I
I
I
8
12
16
20
24
(i)
Fig. 12. Variance of the output of the rth rank order filter.
short-tailed distributions, rth ranks that are close to min or to max give lower output variance. This behavior is illustrated in Fig. 12, where the variance of the rth-order statistic is given as a function of r for uniform and Gaussian distributions of identically distributed input data [87]. It is clear from the previous analysis that the rank r must be chosen carefully according to the input distribution and the desired filter output. Ranked-order filters have been applied as postdetection processor in radar detection systems 1881. Such filters have been shown to be consistent and biased estimators of the received signal distributions. Threshold decomposition, which has been described in the previous section, can also be applied to ranked-order filters [89]. It can be used both for their theoretical analysis and for their implementation. Such VLSI implementations have already been reported [90]-[92]. Ranked-order filters using pixel neighborhoods different from that of (53) can be found in [93]. The relation between ranked-order filters and the mean absolute error criterion is described in [54]. B. MaxIMin Filters are the two The maximum x(".) and the minimum extremes of the rank order filters. They are closely related to two morphological operations, called, respectively, dilation and erosion, of a function by a set [ 5 ] , [94]-[104]. This review paper cannot cover the entire discipline of mathematical morphology. Therefore, this section will cover only certain aspects of the relation between mathematical morphology and order statistics filters. This relation has been analyzed in [lo51 and [106]. It has been proved that any ranked-order filter can be represented as a max or min superposition of erosions or dilations respectively [105]. The maximum filter can effectively remove negative impulses (black spots) in an image, whereas the minimum filter can remove positive impulses (white spots). Both fail in the removal of mixed impulsive noise, because minimum and maximum filters tend to enhance the negative and positive spikes respectively. However, cascades of max and min filters can effectively remove such a mixed impulsive noise. A maximum filter followed by a minimum filter is the mor1904
phological filter called the closing filter [94]. A minimum filter followed by a maximum filter is the morphological filter called the opening filter [94]. A closing filter followed by an opening filter forms a close-opening (CO) filter. An opening filter followed by a closing filter forms an open-closing (OC) filter [1071. Both close-opening and open-closing filters perform relatively well in the case of impulsive noise. However, their performance is generally inferior to that of the median filter [5]. Furthermore, they are biased estimators of location in the case of additive white noise [107]. Multiscale morphological operators have also been proposed recently for nonlinear noise smoothing [log]. Both the maximum and the minimum filters have good edge preservation properties. Their disadvantage is that they tend to enhance the bright and the dark regions of the image respectively [5], as can be seen in Fig. 13. The maximum and minimum filters are very popular, especially in the context of mathematical morphology, despite their disadvantages. The main reason is their computational simplicity and the existence of fast processors for their calculation [103]. The maximumlminimum filters are related to the &-mean filters [lo91 given by n
j=1
The L,-mean filter tends to the maximum filter when p tends to infinity. The L-,-mean filter tends to the minimum filter when p tends to infinity. Therefore, if the effects arising from the highly nonlinear nature of max and min operators are not desirable (e.g. the enhancement of dark or bright regions), L,-mean or L-,-mean filters of moderate p can be used instead. L,-mean filters have relatively good noise smoothing and edge preservation properties [1091. C. a-Trimmed Mean Filters It has already been stated that the moving average filter suppresses additive white Gaussian noise better than the median filter, whereas the second is better at preserving edges and rejecting impulses. Therefore, a good compromise between the two is highly desirable. Such a filter is the a-trimmed mean filter [110]: 1
n--an n
(55)
where ~ ( ~ 1j , = 1,.. . , n are the order statistics of x i - u , . . . ,xi,.. ,xi+u. The a-trimmed mean filter rejects the smaller and the larger observation data. Data rejection depends on the coefficient a , 0 5 a < 0.5. If a is zero, no data are rejected and the filter performs as a moving average filter. If a is close to 0.5, all data but the median are rejected. Therefore, the a-trimmed mean filter can be used as a compromise between the median filter and the moving average filter. The rejected data are usually outliers. This fact explains the robustness of the a-trimmed mean filter [7]. Its robustness is controlled by the parameter a. Its 3
PROCEEDINGS OF THE IEEE, VOL. 80, NO. 12, DECEMBER 1992
(c) Fig. 13. (a) Original image. (b) Min filter output. (c) Max filter output.
breakdown point, E * , is equal to a. Therefore it can reject up to 100a% of outliers. It has also been proved that the a-trimmed mean has better performance than the moving average filters for long-tailed distributions [9]. However, for short-tailed distributions, its performance is poor. It is known that the midpoint MP:
is a very good estimator of location for short-tailed distributions (e.g. uniform distribution) [9], [lll].Therefore, the so-called complementary a-trimmed mean, which is close to the midpoint, has been proposed for short-tailed input noise distributions [110]: n
coefficients are chosen as follows:
The amount of trimming depends on the parameter 4. Data deviating strongly from the local median are trimmed out. Since such data are usually outliers, the modified trimmed mean filter has good robustness properties. A variation of (58) and (59) employs two filter windows of different sizes and is called the double window modified trimmed mean (DW MTM) filter [112]. It is known to have good robustness and edge preservation properties. Another modification is the modified nearest neighbor (MNN) filter [113], whose coefficients are given by ars =
1
A different approach to trimmed filters is to exclude the j +the ~ filter window, which differ considsamples ~ i + ~ , in erably from the local median med(xij).This is the modified trimmed mean (MTM) filter [112]:
{ 01
if Ixi+r,j+s - ~ otherwise.
I4
i j l
(60)
This filter trims out pixels deviating strongly from the central pixel. Therefore, MNN filters have good edge preservation properties. D.L Filters An important generalization of the median is the L filter (also called the order statistic filter): n j=1
(58)
The summations cover the entire filter window A . The filter PITAS AND VENETSANOPOULOS: ORDER STATISTICS
The moving average, median, rth ranked-order, a-trimmed mean, and midpoint filters are special cases of (61) if the coefficients aj , j = 1,. . . ,TI, are chosen appropriately. The 1905
Table 3 Optimal Coefficients of an L Filter Having n = 9 Coefficients for Various Input Distributions Distributions
a1 4 9
a2,aa
a3m
a49a6
as
Uniform
0.5
0.0
0.0
0.0
0.0
Normal
0.11
0.11
0.11
0.11
0.11
-0.01899
0.02904
0.06965
0.23795
0.36469
Laplacian
following choices of the coefficients give the median filter and the midpoint filter respectively: 1 j=v+l aj={o j#v+1 aj =
112 j = l , n 0 j # 1,n.
L filters are based on the theory of robust L estimators, which form one of the three major families of robust estimators [7], [8]. They have been proposed in the context of digital signal filtering only recently [114]. The filter coefficients a j , j = 1,. . . , n, can be chosen to satisfy an optimality criterion that is related to the probability distribution of the input noise. Let us consider the additive noise model y; = s; ni. The filter coefficients can be chosen in such a way that the error norm is minimized:
+
n
M S E = E[(s;- yi)’] =
E[(C
ajz(j) -
=u~Ru,
j=1
(64) where R is the n x n correlation matrix of the vector of . . . ,n(,)IT. a is the ordered noise variables n = [yl), the coefficient vector [ a l ,. . . ,a,]=. A location invariance constraint must be imposed on the estimator (61). This constraint means that a shift in the signal samples from 3; to z; c leads to a shift in the filter output from y; to y; c. The filter coefficients must satisfy the following relation in this case:
+
+
n
Caj = aTe = 1,
(65)
j=1
where e = [l,. , 1IT. The minimization of the Lagrangian function F(X,a) of the mean square error and the constraint function +
F ( X a) , =a
T + X(aTe ~ - 1)
(66)
gives the following coefficient vector:
It can be shown, by using the Cauchy-Schwartz inequality, that the corresponding mean square error is always less than or equal to that produced by the arithmetic mean [115]. Therefore, the L filter will never perform worse than the moving average filter, in the mean square sense. The filter coefficients depend entirely on the correlation matrix R, i.e., on the input noise probability function. If the 1906
input noise distribution is Gaussian, the filter coefficients are given by a j = l / n , j = 1 , . . . , n. As expected, the optimal L filter for the Gaussian noise is the moving average filter. The optimal L filter for the Laplacian distribution is close to the median, as can be seen in Table 3. The optimal L filter for the uniform distribution is the midpoint. The above mentioned analysis of L filters is basically applied to constant signals corrupted by additive noise. It can be extended to the case of arbitrary signals corrupted by additive iid noise. Structural constraints can be incorporated in the optimization function in order to design filters that are sensitive to local signal structures [116]. Similar techniques can be applied to the optimal design of L filters for dependent noise, e.g. Markov noise [117]. The ability of the L filter to have optimal coefficients for a variety of input distributions makes it suitable for a large number of applications. A further advantage of the L filter over the median is that it has no streaking effects, provided that its coefficients are not similar to that of the median filter. Its disadvantage over both the median and the moving average filter is that it has greater computational complexity, because its calculation requires additions, multiplications, and comparisons. The L filter has poor robustness properties if all its coefficients are nonzero [118], [119]. Its robustness to impulses is improved by trimming out small and large data before summation [120]. The deterministic properties of the L filters and their relation to linear filters are discussed in [123]. L filters have successfully been applied to ultrasonic image processing, where speckle noise has a Rayleigh distribution [121], [122]. It has been proved that the large observations in the filter window are weighted heavily. Its performance is better than that of other filters (e.g. median filter, moving average filter) in speckle noise removal. Generalizations of L filters can be found in [124]. One of the main disadvantages of L filters and of other filters based on order statistics is that ordering destroys time or neighborhood information. Therefore, their performance deteriorates when the filter length, n, increases beyond a certain length [125]. This poor performance is particularly evident in the case of nonstationary signals. A modification of L filters has been proposed which takes into account time information. These filters are called L1 filters [125] or C filters [126]. Their definition is the following: n
a(R(i- j
y; =
+v +
l),j)~i-j+,,+l.
(68)
j=1
The filter coefficients a(R(i - j
+ v + l),j),j
= 1 , . . . ,n
PROCEEDINGS OF THE IEEE, VOL. 80, NO. 12, DECEMBER 1992
depend on the position i - j + Y + 1of the sample xi--j+”+l as well as on the rank R(i - j v + 1)of this sample in the , . . ,xi+”. Thus C filters can be considered sample set si-,, to be time-varying L filters. Therefore, they can be easily adapted to time-varying environments [1251.
for Gaussian distributed data:
+
E. R Filters These are based on another large class of robust estimators, the so-called R estimators [7], [8], [127]. The most important R filter is the Wilcoxon filter [128]-[131]:
where ~ ( ~%(k), 1 , j , k = 1,. . . , n , are the order statistics An alternative definition of of the samples x i - v , . . . , the Wilcoxon filter is the following:
+
2 . xk yi = m e d { L , 2
i-v 5 j 5 i+v, i-v 5 k 5 i+v}. (70) Wilcoxon filters have been proved to be effective in the removal of additive Gaussian noise. However, they do not preserve edges well, because the summation in (69) uses every possible pair for 1 5 j 5 k 5 n. If the summation in (69) is restricted to a maximum distance j - k 5 D,the modified Wilcoxon filter results [130]: yi = m e d { x ( j )
+
2
x(k),
15 j 5 k 5 n,k - j < D } .
(71) By letting D range from 1 to n, the modified Wilcoxon filter ranges from the median (D = 1) to the Wilcoxon filter (D = n). The modified Wilcoxon filter has better edge preservation properties than the standard Wilcoxon filter, but it is still worse than the median filter in this respect. A further disadvantage of the Wilcoxon filter is its computational complexity. It requires the ordering of n numbers, n(n 1)/2 additions, and the ordering of n(n 1)/2 numbers. Algorithms for fast Wilcoxon filter calculation are proposed in [132]. Other modifications of the Wilcoxon filter can be found in [133] and [134]. F. M Filters M filters are not directly related to order statistics. However, they are included here because they come from one of the best known families of robust estimators: the M estimators. Their definition is the following [7], [8]:
+
+
i+v
+(Xj - Yi) = 0. j=i-v
Here +(x) is generally an odd, continuous, and signpreserving function; yi is the output; and xj, j = i v, . ,i v, are the input samples in the filter window. A special case of the M filters is the maximum likelihood filters, having
+
(73) where f(x) is the probability distribution of the data xi. The moving average filter is a maximum likelihood filter PITAS AND VENETSANOPOULOS: ORDER STATISTICS
i+V
(”j
- 92) = 0.
(74)
j=i-v
The maximum likelihood filter of Laplacian distributed iid data is the median filter, satisfying i+v
sign(z.j - ya) = 0.
(75)
Therefore, both the moving average and the median are special cases of M filters. Let us suppose that the model data cdf is F ( x ) and that the data contain E% outliers having an unknown symmetric distribution H ( z ) . In this case, the data distribution G ( x ) lies in the neighborhood PE of the distribution F ( x ) :
+ EH;H
is a symmetric distribution. } (76) The M estimator (called the Huber estimator) which minimizes the asymptotic variance V(+,G) over PE and the corresponding M filter are defined by using the following function in (72) [7], [8]:
PE= ((1
- E)F
b
+(x) = zmin(1, -). 1x1
(77)
For Gaussian distributed data, the constant b is given by an implicit equation:
where Q(z),+(z) denote the cdf and the pdf of the unit Gaussian distribution respectively [7]. The function $(x) is plotted in Fig. 14. The Huber estimator and the corresponding M filter, called the standard M filter (STM) [112], are B robust and they have breakdown point E* = 1/2; i.e. they can reject up to 50% outliers [7]. The Huber estimator tends to the median or to the arithmetic mean when b tends to zero or to infinity respectively. Therefore, the STM filter is another compromise between the median filter and the moving average filter. If all data xj, j = i - v, . , i + v, are far away from their median, all differences x~j- yi lie in the saturated region of +(x); therefore, the Huber estimator coincides with the median. On the other hand, if all data are close to their median and to each other, the differences xj - yi lie in the linear region of $(x). In this case, the STM filter coincides with the moving average filter. In the homogeneous image regions, the STM filter behaves like a moving average filter. Its performance is similar to that of the median close to image edges. Impulsive noise can be effectively removed by the STM filter, owing to its robustness properties. A detailed analysis of the performance of the STM filter can be found in [135]. A modification of the M filter, called the W filter, is described in [136]. Despite its advantages, the STM filter is not very popular because of its implicit definition, which requires iterative techniques for the calculation of its output. However, it has been observed that Newton iteration for the solution of (72) requires only five iterations with absolute error less than 0.01 [112]. 1907
-7F+ t
NETWORK SORTING
-1
Fig. 15. General nonlinear filter structure.
X
L
t-b
xa
bpr
NETWORK
XN
Fig. 16. Nonlinear order statistics filter structure.
Fig. 14. The function which is used in the definition of the Huber estimator and the corresponding M filter.
G. General Nonlinear Filter Structure
X
As described in the introduction, several nonlinear filter classes have been used in image processing, e.g. filters based on order statistics, homomorphic filters [1371, polynomial filters [138]-[146], and nonlinear mean filters [109], [ 1471. Since nonlinear filters come from different theories, their structure and properties vary widely. Therefore, a unifying nonlinear filter structure which encompasses several classes of nonlinear filters as special cases is very important. Such a filter structure is described in Fig. 15. It consists of two pointwise-nonlinear functions, g(z), f(z),a sorting network and two linear filters, L1 and L z . Filters based on order statistics, homomorphic filters, nonlinear mean filters, and morphological filters are special cases of the general nonlinear filter structure if the functions g ( s ) and f ( s )and the linear filters are chosen appropriately [148]. A special case of the general nonlinear filter structure, called the nonlinear order statistic filter (NLOS), shown in Fig. 16, can be used for signal-dependent noise filtering described by 1~ = t ( s )
+ r(s)nI + n2.
(79)
The nonlinear function g ( s ) is chosen in such a way that signal-dependent noise is transformed to additive white noise:
The coefficients a i , i = 1,. . . , n, are given by (67). The nonlinear function f ( s )is used to restore the original dynamic range of the image by choosing
f(s) = g-’[t(s)l.
(81)
The NLOS filter is a nonlinear filtering module that can perform as a median filter, L filter, a-trimmed mean filter, rth rank order filter, moving average filter, midpoint filter, erosion or dilation filter, range edge detector, or dispersion edge detector [150]. Therefore, it can be used as a versatile building block for nonlinear filtering. Such a 3 x 3 building block is shown in Fig. 17. This module 1908
Fig. 17. A 3 x 3 general nonlinear filtering module. D denotes delay. Vertical bars denote comparators.
has a very regular and parallel structure and it uses small interconnection paths. Therefore it is very suitable for VLSI implementation. Its hardware requirements are equal to the requirements of a moving average filter and a median filter. Its throughput delay is the sum of the throughput delay of a median and of a moving average filter. This is the price paid for its versatility. An analysis of the computational complexity of the nonlinear filtering module can be found in [148]. H. Multichannel Median Filters Multichannel filtering is very important in color image processing, in multiband image processing for remote sensing applications, in velocity field filtering, and in complex-valued signal filtering. Multichannel color image filtering has attracted particular attention in recent years, because color images are essentially three-channel two-dimensional signals [ 1511-[ 1551. Color images can be described as vector images. There has been a particular interest in extending nonlinear black and white image processing techniques based on order statistics to color images [156]-[ 1621. Single-channel order statistic filtering uses the notion of data ordering, which is very natural in this case. This notion cannot be extended in a straightforward way in the case of multivariate data. An excellent treatment of multivariate data ordering can be found in [164]. It is shown that there are several ways to order multivariate data. There is no unambiguous, universally agreeable total ordering of the n p-variate samples zl,. .. ,z,zi = [zli,zzi,.. . , zpiIT, i = 1,.. . ,n. The following so-called subordering principles are discussed in [ 1641: marginal ordering, reduced (aggregate) ordering, partial ordering, and conditional (sequential) ordering. PROCEEDINGS OF THE IEEE, VOL. 80, NO. 12. DECEMBER 1992
In marginal ordering, the multivariate samples are ordered along each of the p dimensions:
X2(1)
5 ~ 1 ( 2 )L . . . I x l ( n ) I X2(2) 5 . . I. 5 2 ( n )
xp(l)
5 xp(2) 5 . . . L xp(n)
XI(I)
x2
T
(82)
*
i.e., ordering is performed in each channel of the multichannel signal. The ith marginal order statistic is the vector qi) = [ x ~ (z2(i), ~ ) , . . ,~ ~ ( ~ The 1 1 cdf ~ . and the pdf of the marginal order statistics can be found in [156] and [165]-[167]. The extension of the notion of influence function to the marginal order statistics can be found in [7] and [156]. Marginal order statistics filters have been applied in color image processing [156], [157]. Their behavior in impulse noise removal is studied in [158]. The reduced ordering ( R ordering) is based on the generalized distance:
#xi
+
d = (z- ~ ) ~ r - '-( a) z
n
n
. .
=
Ai,,...,ipz(il, ...,a,),
'
i1=1
L estimators can be used in multichannel image filtering in the case of additive white noise:
(83)
of a sample z from a point a which may be either the origin or the sample arithmetic mean % or the marginal median z(,+~).r may be the identity matrix, the dispersion matrix C,or the sample dispersion matrix S . The various data zi are ordered according to their distances di from a, as shown in Fig. 18. Thus multivariate ordering is reduced to one-dimensional ordering. Reduced ordering has been used in color image filtering [168] with very promising results. It has been observed that the Mahalanobis distance (83) gives better results than the Euclidean distance (I' = I). Partial ordering (P ordering) is based on the notion of the convex hull of the points 5 1 , . . . ,zn,which is the minimum convex set which encloses all n samples [5], [169]. The conditional ordering (C ordering) is conducted on one of the marginal sets of observations conditional on ordering within the data in terms of other marginal sets of observations [164]. The definitions of L estimators can be easily extended to the p-dimensional case by using marginal order statistics. The following estimator will be called the p-dimensional marginal L-estimator [156]:
Tn
Fig. 18. R ordering of multivariate data.
(84)
ip=l
where = [ x ~ (. .~. ,~x p)( ,i p ) ] Tare the marginal order statistics and Ail,.,.,ipare p x p matrices. The performance of the marginal L estimator depends on the choice of these matrices. The marginal median, maximum, and minimum are special cases of (84) for appropriate choices of the matrices Ail,. . . , i p . The p-dimensional marginal atrimmed mean [170]:
where s is the desired signal, n is a white noise process, and z is the corrupted signal. The marginal median, which is a special case of marginal L estimators, has been studied in [156]. It has been shown that it behaves well in the case of additive white long-tailed noise and in the case of impulsive noise. Multichannel L filters have been developed for various multichannel distributions in [159] and have been compared to single channel L filters and to marginal filters (e.g. marginal median filter and marginal moving average filter). It has been found that multichannel L filters outperform single-channel filters if the signal channels are correlated to each other. Another definition of the multichannel median, called vector median, has been proposed for color image filtering [160], [162], [163]. It is the vector z m e d that minimizes the L1 error norm: n
~zi- zmed1 i=l
n
min.
(87)
n
1C1zi-zj1j = l , . . . , n , i=l
i=l zmed
PITAS AND VENETSANOPOULOS: ORDER STATISTICS
-
This definition of the multichannel median is a direct extension of the corresponding single-channel median definition. Generally, it gives results different from those of the marginal median. The vector z m e d may or may not be one of the data zi,i = 1 , . . . , n. The implicit definition (87) of the vector median makes its application difficult in color image filtering because the use of an iterative optimization algorithm is required to produce each output image pixel. The computational load is reduced if the median Z m e d is forced to belong to the set z;,i = 1 , . . . , n. In this case, = z;,i= the L1 norm (87) is computed for everyd,,z 1,. . . , n. The median is the one that minimizes [162]: CIzi-zrnedl
is another special case of the p-dimensional L estimator.
(86)
z=s+n,
E {zl,"*,zn}.
(88)
Other distance measures (e.g. Mahalanobis distance) can 1909
be used in (88) instead of the L1 norm. The statistical and deterministic properties of the vector median filters are described in [162]. Application of vector median filters in velocity filtering and in complex narrow-band signals can be found in [162] and [161] respectively. Median hybrid filters have also been extended for vector signals [1601-[162]. A comparison of the marginal median filters, vector median filters, in color image filtering is included in [158]. Marginal median filters and vector median filters have similar performance. Both of them are outperformed by the multichannel &-trimmed mean filters and the multichannel MTM and DW-MTM filters. Multichannel DW-MTM filters clearly have the best performance in all simulations done both for one-dimensional signals and for color images.
IV. ADAPTIVEORDERSTATISTIC FILTERS The nonlinear filters described in the previous chapters are usually optimized for a specific type of noise and sometimes for a specific type of signal. However, this is not usually the case in many nonlinear filtering applications, especially in image processing. Images can be modeled as two-dimensional stochastic processes, whose statistics vary in the various image regions. Images are nonstationary processes. Furthermore, noise statistics, e.g., the noise standard deviation and even the noise probability density function, vary from application to application. Sometimes, noise characteristics vary in the same application from one image to the next. This is the case in the channel noise encountered in image transmission and the atmospheric noise (e.g., the cloud noise) in satellite images. In such environments, nonadaptive filters cannot perform well, because their characteristics depend on the noise and signal characteristics, which are unknown. Therefore, adaptive filters are the natural choice in such cases. Adaptive filter performance depends on the accuracy of the estimation of certain signal and noise statistics, namely the signal mean and standard deviation and the noise standard deviation. The estimation is usually local; i.e., relatively small windows are used to obtain the signal and noise characteristics. Such an adaptive filter can be employed for additive white noise [171], [172]:
The linear minimal mean square error estimate (MMSE) of sij is given by the following formula:
where on,U,, and riz, are the local estimates of the noise standard deviation, the signal standard deviation, and the signal mean, respectively. At homogeneous image regions, the noise standard deviation is approximately equal to the signal standard deviation. In these regions, the adaptive MMSE filter (90) is reduced to the local estimate of the signal mean Bij N riz,. At edge regions, the signal standard 1910
deviation is much greater than the noise signal deviation (a,