12 Optical Coherence Tomography Findings in Diabetic Macular Edema Desislava Koleva-Georgieva University Eye Clinic, University Hospital”St. George”, Plovdiv Bulgaria 1. Introduction Diabetic macular edema (DME) is one of the main causes of visual impairment in patients with diabetic retinopathy (Williams et al., 2004). The common diagnostic tools for assessing macular edema are stereo-ophthalmoscopy and fluorescein angiography. Stereoscopic examination of the fundus at the slit-lamp or on stereoscopic color fundus photographs is the standard method, as defined by the Early Treatment Diabetic Retinopathy Study (ETDRS), for evaluating macular thickening and for starting treatment when the clinical significant macular edema level has been reached (ETDRS Report Number 10, 1991). Fluorescein angiography is a complementary method for further detecting vascular leakage. However, these methods are subjective and seem to be insensitive for small changes in retinal thickness (Hee et al., 1995; Shahidi et al., 1991). In 1991 a revolutionary device was introduced in ophthalmology – optical coherence tomography (OCT) – and it dramatically improved the diagnosis of macular pathology (Huang et al., 1991). OCT provides detailed information about retinal microstructure and measures retinal thickness with high precision and reproducibility (Diabetic Retinopathy Clinical Research Network [DRCRN], 2007; Paunescu et al., 2004; Polito et al., 2005; Puliafito et al., 1995). The recently introduced spectral-domain OCT (SD OCT) machines have numerous improvements that enhance our ability to examine retinal microstructure and obtain more reliable measurements.
2. OCT principles and interpretation 2.1 OCT principles OCT is a modern imaging technique for non-invasive and non-contact “in vivo” examination of the retina and the vitreoretinal interface on cross-section images or on a 3D image reconstruction, and for objective measurement of retinal thickness (Hee et al., 1995; Huang et al., 1991; Schuman et al., 2004). Its high resolution (5-10μm) is unobtainable for any other device. The operating principle resembles echography, but instead of ultrasound a low-coherent light signal is used. The first OCT devices are referred to as time-domain OCT (TD OCT). TD OCT technology relies on an optical technique known as Michelson low coherence interferometry (Shuman et al., 2004). The image acquisition and thickness measurements are achieved by detecting the echo time delay of the backreflected or backscattred light from internal retinal structures while it interferes with the light that has
www.intechopen.com
226
Diabetic Retinopathy
traveled a known path length. This is obtained by moving a reference mirror and the signal collection is a function of time (Brancato & Lumbroso, 2004; Schumann et al., 2004). In the past few years SD OCT technology was introduced. At present there are two techniques for SD OCT. The first uses a spectrometer for detecting and measuring the light spectrum returning from tissue and a stationary reference mirror. Here mathematical operations, called Fourier transforms, are used. Thus SD OCT is also referred to as Fourierdomain OCT. As this technology allows detecting all echoes of backreflected light simultaneously and there are no moving parts, the imaging speed and resolution of SD OCT are higher than those of TD OCT (Podoleanu, 2005; van Velthoven et al., 2007). The second SD OCT technique is called “swept source-OCT”. It uses a light source in which the emission wavelength is tuned rapidly over a broad wavelength range (Choma et al., 2003; Podoleanu, 2005). The main advantages of SD OCT over TD OCT are the increased imaging speed, the higher resolution and sensitivity, the possibility of obtaining a 3D retinal image reconstruction, more reliable thickness measurements and topographic retinal analyses. 2.2 OCT interpretation The interpretation of OCT is based on analysis of various qualitative and quantitative data (Brancato & Lumbroso, 2004; Schuman et al., 2004). Before performing these analyses, an assessment of the OCT scan quality has to be made and the presence of scan artifacts has to be detected, since they can lead to retinal thickness measurement errors and false conclusions. The artifacts may be operator-induced (defocusing, depolarization and out of range image), patient-induced (off-center fixation resulting in incorrectly centered retinal thickness maps, blink and motion artifacts) or may be due to the limitations of the imaging technique (TD OCT has lower imaging speed and frequent blink and motion artifacts). All these artifacts have been recognized to cause breakdown in the performance of the segmentation software and thus leading to incorrect automated retinal thickness measurements (Ho et al., 2009; Ray et al., 2005; Sadda et al., 2006). Several studies have pointed out that segmentation breakdown may also be possible in high quality scans if there are pathological features such as full-thickness macular hole, pigment epithelial detachment, subretinal fluid, retinal fibrosis and hard exudates (Domalpally et al., 2009; Ho et al., 2009; Krebs et al., 2009; Sadda et al., 2006). The presence of media opacities (cataract, vitreous hemorrhage, ect.) and low signal intensity (low signal-tonoise ratio) may also induce segmentation breakdown. Although much progress has been made in improving the accuracy of the segmentation software, and the SD OCT devices perform better than the TD OCT, segmentation breakdown still occurs with the current SD OCT software. There is possibility of manual correction, but still it is time consuming and not always feasible in clinical settings. At this point it seems prudent to note this limitation of the current OCT software. Thus, until improvement in the segmentation algorithm is available, the clinician may minimize possible diagnostic and therapeutic errors when working with the current OCT devices by anticipating and recognizing automated retinal thickness measurement errors. 2.2.1 OCT characteristics of normal macular morphology The interpretation of qualitative data is based on analyzing tissue reflectivity. As OCT has histological correspondence (Toth et al., 1997), the interpretation of the OCT image seems to
www.intechopen.com
Optical Coherence Tomography Findings in Diabetic Macular Edema
227
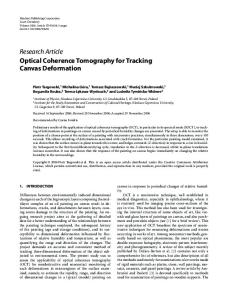
be quite intuitive. However, it should be always remembered that OCT technology depicts tissue reflectivity. It is dependent on tissue optical properties, i.e. microscopic variations in the refractive index of subcellular structures, and on the amount of light signal absorbed by the overlying tissues (Brancato & Lumbroso, 2004; Schumann et al., 2004). Normal macular histology is divided into 10 distinct layers: inner limiting membrane (ILM), nerve fiber layer (NFL), ganglion cell layer (GCL), inner plexiform layer (IPL), inner nuclear layer (INL), outer plexiform layer (OPL), outer nuclear layer (ONL), external limiting membrane (ELM), rod and cone layer, and retinal pigment epithelium layer (RPE), (fig.1). They are formed by 4 cell types: RPE, photoreceptors, bipolar and ganglion cells. The reflectivity of the various layers is represented in the OCT scans by the so called false colors (a color coded way – white and red for high reflectivity, and blue and black for low reflectivity). The ILM is the first detected layer on the OCT scan, due to the contrast between the non-reflective vitreous and the reflective retina. Immediately behind it lies the NFL. It consists of horizontal axonal structures of high optical reflectivity and is depicted on OCT scans by red color. The NFL is thicker on the nasal side, because of the density of the papillomacular bundle. The plexiform layers are of medium reflectivity and appear yellow on the scans. The nuclear layers (GCL, INL and ONL) are of low optical reflectivity and appear as blue-black. The GCL is thickest in the parafoveal area. In the fovea there is thinning of the retina with absence of the inner layers and an increase in thickness of the ONL. It is easily recognized on the scans by its characteristic depression. The RPE, which contains melanin, is highly reflective and is the outermost red layer on the OCT scan. Behind it is the medium reflective choriocapillaris.
Fig. 1. Normal macular structure – SD OCT representation of retinal layers: inner limiting membrane (ILM), nerve fiber layer (NFL), ganglion cell layer (GCL), inner plexiform layer (IPL), inner nuclear layer (INL), outer plexiform layer (OPL), outer nuclear layer (ONL), external limiting membrane (ELM), inner segments (IS) and outer segments (OS) of the photoreceptors, IS/OS junction (IS/OS), and the retinal pigment epithelium layer (RPE). In front of the RPE on Stratus TD OCT scans and on SD OCT scans there is another highly reflective (red) layer – it is the boundary between the inner segments (IS) and the outer segments (OS) of the photoreceptors. On TD OCT two highly reflective lines in the outer retina are visualized (as described above). On SD OCT there are three highly reflective lines in the outer retina – the innermost being the IS/OS junction, the outermost being the RPE, and the middle one is described to be the outermost tips of the OS, containing discs, rich in rhodopsin (Ooto et al., 2010; Srinivasan et al., 2006). On SD OCT despite these three highly reflective layers, a forth thinner high-to-medium reflective line is also visible in front of the
www.intechopen.com
228
Diabetic Retinopathy
IS/OS layer and it represents the ELM. If an OCT scan intersects a retinal blood vessel it can be identified by the increased reflectivity and shadowing of the deeper structures. 2.2.2 OCT interpretation – qualitative analysis (morphology and reflectivity) While performing qualitative analysis one should simultaneously perform morphological examination (changes in retinal profile – surface and posterior layers, and presence of abnormal structures) and reflectivity examination (hyper-reflectivity, hypo-reflectivity, and shadowing effects) (Brancato & Lumbroso, 2004). Pathological changes in retinal surface contour may represent disappearance of the normal foveal depression (in macular edema). Steepening of the foveal contour may be associated with epiretinal membranes, macular pseudoholes or lamellar holes. OCT can distinguish between lamellar holes, pseudoholes or various stages of full thickness macular holes. Pathological changes in posterior layers may be RPE detachments (form steep angles with the choriocapillaris) and neurosensory retinal detachments (form shallow angles with the RPE and protrude less). Retinal drusen produce wavy undulations of the pigment epithelium line. Abnormal intraretinal structures may be cotton wool spots (superficial hyper-reflective nodules with indistinct margins in the NFL), hard exudates (round numerous or plaque-like hyper-reflective spots usually in the inner layers, shadowing the deeper structures), choroidal neovascular membranes (nodular or rounded fusiform hyper-reflective structures in front of the RPE, or sometimes visualized as localized thickening of the RPE, choriocapillaris and OS, usually associated with edema or serous retinal detachment), fibrous scars (hyper-reflective structures in the outer retina that deform reduced in thickness retinal layers). Retinal pathological features can be associated with changes in optical properties of the tissue and thus be detected on the OCT scan as changes in reflectivity. While performing this reflectivity analysis one should always remember that the reflectivity displayed on the scan is a result from the tissue reflectivity, the amount of light absorbed by overlying structures, and the amount of light that reaches the sensor after it has been further attenuated by interposing tissues. Thus care is required in interpreting OCT images when media opacities, poor alignment of the OCT instrument while imaging, high astigmatism or poorly centered intraocular implants are present, as these may reduce signal intensity. Pathological features that can be hyper-reflective are: epiretinal and thick vitreal membranes, cotton wool spots, hard exudates, thick hemorrhages, retinal fibrosis, RPE hyperplasia or pigmented choroidal nevi, neovascular membranes, atrophy of the retina and RPE (the later cause increased reflectivity of the underlying choroid). Reduced reflectivity (hypo-reflectivity) is most often caused by fluid accumulation: intraretinal edema (it may be associated with formation of optically non-reflective cystoid spaces), or subretinal edema (serous neuroepithelial retinal detachment, serous pigment epithelial detachment). Hyporeflectivity may also be present in retinal and RPE atrophy or RPE hypopigmentation, where along with tissue hypo-reflectivity there is increase of the reflectivity of the underlying choroid. 2.2.3 OCT interpretation – quantitative analysis The quantitative analysis is a very important part of OCT interpretation. Quantitative measurements of retinal thickness, volume, and a variety of structures (i.e. retinal
www.intechopen.com
Optical Coherence Tomography Findings in Diabetic Macular Edema
229
morphometry) provide objective information for diagnosing disease, tracking disease progress, and evaluating response to therapy. The availability of highly reproducible and repeatable retinal thickness measurements (DRCRN, 2007; Paunescu et al., 2004; Puliafito et al., 1995) is prerequisite for early diagnosis of macular edema. Retinal thickness and volume are automatically calculated by the computer software and are displayed in numerical values (table format) or in color coded topographic retinal thickness maps. Retinal thickness is calculated for central fixation point, 9 ETDRS-like macular regions and total macular thickness. Retinal volume is displayed for 9 ETDRS-like macular regions and total macular volume (not all OCT devices display volume). The 9 ETDRS-like macular regions consist of one central circle of 500 μm radius (the foveal region), an inner and outer ring, each divided into four quadrants. The topographic color coded retinal thickness map (white and red for high thickness values, and blue for low thickness values) provides more graphic information that can be compared directly to the fundus image. The automatic calculation of retinal thickness is dependent on a computer image-processing algorithm called segmentation. It allows automatic detection of the inner and outer retinal boundaries. After that automatic calculation of the measurements between these boundaries is performed (Schuman et al., 2004). At this point several important notes have to be made. First, in TD OCT the retinal thickness topographic map is displayed after interpolation of the measured retinal thickness form 6 radial cross-section scans (overall 6x512=3072 Ascans, or 6x128=768 A-scans for the entire macular area). The interpolation may miss pathologic areas with increased/decreased thickness between the 6 radial lines. In SD OCT retinal thickness topographic map is displayed after performing measurements from a great number of A-scans (27 000 A-scans for Cirrus HD-OCT (Carl Zeiss Meditec) and Spectral OCT/SLO (OPKO/OTI), 40 000 A-scans for Spectralis (Heidelberg Engineering), and over 50 000 A-scans for high resolution OCT devices). Thus retinal thickness measurement with SD OCT provides more precise and reliable data. Second, the different OCT devices have different segmentation algorithms, and there is published evidence of significant differences between TD OCT and SD OCT, as well as between different SD OCT machines (Han et al., 2009; Leung et al., 2008; Wolf-Schnurrbusch et al., 2009). The difference is mainly caused by the way of delineating the outer retinal boundary (at the level of the first, second or third hyper-reflective line in the outer retina). Thus measurements from different OCT devices cannot be compared in studies, as well as in the follow-up of patients in clinical settings. Third, the segmentation algorithm may not perform correctly in the presence of scan artifacts or particular pathological features and lead to thickness measurement errors (as described in 2.2.OCT interpretation). The data base for normal retinal thickness should be different for the different OCT devices. There are a lot of studies on retinal thickness measurements in healthy eyes, and their number is even increasing with the introduction of new OCT machines. Normal values for the central point and foveal thickness according to several studies, using TD OCT and SD OCT are presented on table 1. The diversity of data for normal eyes seems to be much more confusing, than helpful. There is a general trend of measuring higher values of retinal thickness with more refined OCT technology. All measurements with SD OCT have higher values than measurements with TD OCT. The greater axial resolution of SD OCT (5-6 μm) compared to TD OCT (10 μm) and the higher precision of the software may explain the
www.intechopen.com
230
Diabetic Retinopathy
difference between TD OCT and SD OCT. The differences among the several types of SD OCT devices may also be significant and are due to the segmentation of the outer retinal boundary. The presented data on table 1 also suggest differences even in measurements with identical OCT devices. This may be due to the specific characteristics and composition of the examined populations – age, gender, race, refraction, ect.
Study Hee et al., 1995
Number of OCT device examined eyes 20 Time-domain OCT prototype
Hee et al., 1998 Otani et al., 1999 Schaudig et al., 2000 Massin et al., 2002 Paunescu et al., 2004 Chan A et al., 2006 Bressler et al., 2008 Kelty PJ et al., 2008 El-Ashry et al., 2008 Leung CK et al., 2008
73 10 25 60 10 37 97 83 200 35
Huang et al., 2009
32
Wolf-Schnurrbusch UEK et al., 2009
20
39
Koleva-Georgieva et al, 2010 Grover S et al., 2010
36
Ooto S et al., 2010
248
CFP
Fovea
147 ± 17
-
Time-domain OCT prototype Time-domain OCT 1 Time-domain OCT 1 Time-domain OCT 1 Time-domain OCT 3 (Stratus) Taim-domain OCT 3 (Stratus) Time-domain OCT 3 (Stratus) Time-domain OCT 3 (Stratus) Time-domain OCT 3 (Stratus) Time-domain OCT 3 (Stratus) Spectral OCT - Topcon 3D OCT Time-domain OCT 3 (Stratus) Spectral OCT – RTVue-100 Time-domain OCT 3 (Stratus) Spectral OCT: Spectralis OCT Spectral OCT/SLO Cirrus HD OCT SOCT Copernicus RTVue-100 Spectral OCT/SLO
152 ± 21 133 ± 9 152 ± 17 146 ± 20 164 ± 21 182 ± 23 166 ± 23 173 ± 23 155 ± 16 164 ± 26 175 ± 17 -
174 ± 18 170 ± 18 204 ± 20 212 ± 20 201 ± 22 205 ± 27 203 ± 24 196 ± 17 216 ± 12 193 ± 22 208 ± 21 213 ± 19
176 ± 17
288 ± 16 243 ± 25 276 ± 17 246 ±23 245 ± 28 198 ± 21
Time-domain OCT 3 (Stratus) Spectral OCT - Spectralis OCT Spectral OCT – 3-D OCT-1000
167 ± 21 202 ± 23 225 ± 17 271 ± 20 222 ± 19
Table 1. Normal retinal thickness measurements for central fixation point (CFP) and fovea, represented in μm (mean ± standard deviation), obtained by different OCT devices. There is not a commonly accepted opinion about the variation of retinal thickness with age. Several authors have reported a lack of relation between retinal thickness and age (Browning et al., 2008; Chan et al., 2006; Grover et al., 2010; Hee et al., 1995; Massin et al., 2002; Sanchez-Tochino et al., 2002). Others have found negative correlation between retinal thickness and age in all 9 ETDRS regions (Alamouti & Funk, 2003; Erikson & Alm, 2009), and in five of the 9 ETDRS areas not including the fovea (Ooto et al., 2010). There is a well known decrease in thickness of the NFL with age. According to Erikson and Alm the thinning of the macula with age is 20-25% due to thinning of NFL and 75-80%due to
www.intechopen.com
Optical Coherence Tomography Findings in Diabetic Macular Edema
231
thinning of other retinal layers (Erikson & Alm, 2009). Thus the reduction of retinal thickness with age cannot be contributed to thinning of NFL alone. It has been reported that men have thicker retinas than women (Browning et al., 2008; Guedes et al., 2003; Hee et al., 1995; Kelty et al., 2008; Massin et al., 2002; Ooto et al., 2010). However, Chan and coauthors and Grover and coauthors did not detect significant inter-sex difference in retinal thickness, but their studied groups had uneven sex distribution (Chan et al., 2006; Grover et al., 2010). There is published evidence of racial differences in retinal thickness. It has been reported that Blacks and Asians have thinner retinas compared with whites in age-matched groups (Asenfzadeh et al., 2007; Guedes et al., 2003; Kelty et al., 2008). Thus, race may be taken into consideration while interpreting OCT thickness measurements. The relation of macular thickness to axial length and presence of high myopia has also been described. Retinal thickness in highly myopic eyes (>6D) was higher in the fovea, but lower in the inner and outer regions compared to non-myopic eyes in a study with age-matched groups (Wu et al., 2008). Thus it may be an indication for change in retinal contour of highly myopic eyes and care is needed while interpreting macular pathology on OCT scans of such eyes. The studies of Lam and coauthors and Lim and coauthors showed negative correlation of retinal thickness and axial length (Lam et al., 2007; Lim et al., 2005). However, both studies included highly myopic eyes together with non-myopic eyes, and did not perform age-adjusted analysis. In their investigation on 248 eyes, Ooto and associates found no correlation between macular thickness and age-adjusted axial length (Ooto et al, 2010). We performed a study including 39 healthy eyes, with almost even sex distribution (21 men; 18 women), accepting refractive error of no more than ± 3D, without glaucoma and all subjects being of Caucasian descent (Koleva-Georgieva & Sivkova, 2010). The automated retinal thickness and volume measurements were obtained by Spectral OCT/SLO Combination Imaging System (OPKO/OTI). A negative correlation between age and retinal thickness and volume in all ETDRS regions, except the temporal inner and temporal outer regions was found, and this relation remained after controlling for gender. Men had thicker retinas than women, and this remained so after controlling for age. These results are in consent with some authors and in discrepancy with others. One reason may be the small sample size in many of the studies, or the heterogeneity of retinal thickness in different populations. Additional studies with larger sample sizes are needed to clarify the situation. If quantitative analysis should be meticulous the normative database for retinal thickness probably should be population-based and obtained for each OCT machine type separately. Still our findings, supported by others, indicate that age, sex, and high myopia must be considered while interpreting retinal thickness data.
3. OCT findings in DME 3.1 Retinal thickness Retinal edema is defined as any detectable retinal thickening due to fluid accumulation (ETDRS Report Number 10, 1991). Stereoscopic examination of the fundus is the standard method, as defined by the ETDRS, for evaluating macular thickening. However, it is subjective and seems to be insensitive for small changes in retinal thickness (Hee et al, 1995;
www.intechopen.com
232
Diabetic Retinopathy
Shahidi et al, 1991). The particular value of OCT is the possibility for objective, reliable and repeatable retinal thickness measurements. Since the introduction of OCT several authors have studied the possibility of OCT for early diagnosis of macular edema, and have suggested criteria to detect the so called subclinical diabetic macular edema (Hee et al., 1995, 1998; Massin et al., 2002). There are studies reporting significant differences in retinal thickness between controls and eyes with diabetic retinopathy (without clinically detectable DME) in the fovea (Sanchez-Tochino et al., 2002; Schaudig et al., 2000), superior and nasal quadrants (Schaudig et al., 2000). Difference was also found between healthy eyes and diabetics without diabetic retinopathy in the fovea (Sanchez-Tochino et al., 2002), the paramacular ring (Schaudig et al., 2000) and the superior zone (Sugimoto et al., 2005). When comparing eyes of diabetics with and without retinopathy (and no clinical evidence of macular edema) Sanchez-Tochino and coauthors did not find any significant difference (Sanchez-Tochino et al., 2002), but Schaudig and associates found statistically significant difference in the superior nasal quadrant (Schaudig et al., 2000). In a clinical study we compared retinal thickness between diabetic patients without clinical evidence of DME (1st group – 57 eyes of 29 patients without diabetic retinopathy; 2nd group – 63 eyes of 32 patients with diabetic retinopathy) and a control group (39 healthy eyes), (Koleva-Georgieva & Sivkova, 2010). All groups were age-matched and with nearly even sex distribution. The tendency of men having thicker retinas than women, and decrease of thickness with age were noted also for diabetic patients from both groups, although not reaching significance for all macular areas. We found significant differences in retinal thickness between controls and diabetics with diabetic retinopathy (group 2) in all macular regions, and also between controls and diabetics without retinopathy (group 1) in all regions except superior inner, inferior inner and nasal inner. It was present also after controlling for age and gender. The differences were present in more macular regions than detected by other authors. It might be due to the greater resolution and precision of the SD OCT that we used. So, OCT could detect early and subtle increase in retinal thickness in eyes with or even without retinopathy in comparison to healthy eyes. When comparing eyes of diabetics without retinopathy (group1) to those with diabetic retinopathy (group 2) we found significant difference in the central fixation point, fovea, superior inner, temporal inner, nasal inner regions and total retinal thickness. This indicated that SD OCT could further distinguish early macular damage in eyes with diabetic retinopathy compared to eyes without retinopathy. These early changes were more likely to develop in the central region and superior macular hemisphere (Koleva-Georgieva & Sivkova, 2010; Schaudig et al., 2000; Sugimoto et al., 2005). This evidence, published by many authors, suggests the possibility of OCT for the early detection of macular edema in diabetic patients. If we need to know whether a given diabetic patient has early macular damage, detectable by OCT, we have to apply some criteria. Ever since the pioneers of OCT have examined this possibility they have given several criteria: retinal thickness exceeding mean+3SDs (standard deviations) from normal subjects (Hee et al., 1995), retinal thickness exceeding the maximal thickness in normal eyes, difference between the right and left eyes exceeding mean difference in healthy eyes+2SDs, comparison with the database from normal population, and comparison with previous measurements (Hee et al., 1995, 1998). Hee and associates found 3 eyes (from 55 eyes) of diabetics without retinopathy with evidence of
www.intechopen.com
Optical Coherence Tomography Findings in Diabetic Macular Edema
233
early damage according to their criterion on difference between right and left eyes (Hee et al., 1998). Massin and coauthors suggested early macular edema to be present if retinal thickness of an area was greater than the mean +2SDs in the corresponding area of normal subjects (Massin et al., 2002). This will exceed the variation in 95% of the normal population. They detected early macular thickening in 12 eyes (from 70 eyes) of diabetic patients without edema on ophthalmoscopy. In our study we did not apply the criterion of difference between right and left eyes, because Spectral OCT/SLO does not give this information automatically as Stratus TD OCT does. We applied the criterion of retinal thickness exceeding mean+2SDs from normal values for both the central fixation point and the fovea (both being in the clinically significant zone) to distinguish eyes with early subclinical DME (Koleva-Georgieva & Sivkova, 2010). Thirteen eyes were detected with retinal thickness exceeding both 209.6 µm for the central fixation point (176 µm+2x16.8 µm) and 241.1 µm for the fovea (198.3 µm +2x21.4 µm). All 13 eyes had retinopathy – 12 eyes with mild non-proliferative diabetic retinopathy and 1 eye with moderate non-proliferative diabetic retinopathy. In contrast to the finding of Browning and coauthors that only eyes with late stages of retinopathy (severe non-proliferative or proliferative) with no clinically detectable edema had thicker retinas than healthy eyes (Browning et al, 2008), we detected early subclinical macular damage also in eyes with mild and moderate non-proliferative diabetic retinopathy. That’s why we believe that OCT examination could be useful in patients with any severity of diabetic retinopathy, even in the earliest stages, and this would be at least for two reasons: first – to screen for early DME and eventually consider a closer follow-up, and second – to have a baseline measurement of retinal thickness for future comparison. This evidence confirms that SD OCT can possibly detect early subclinical macular edema in eyes with diabetic retinopathy. In the clinical setting, it is not advisable to use the above reported values of normal retinal thickness due to differences in population characteristics. However, the preset criteria defining early macular damage may be used, and attention should be paid to age, gender, ethnicity and presence of high myopia. OCT is also a valuable method for quantifying treatment effects after laser photocoagulation, vitrectomy, or intravitreal application of steroid and anti-VEGF injections. The assessment of the effect of each treatment has to be judged both by the improvement of visual acuity and by the observation of structural changes induced. OCT has proved to be beyond comparison for the latter, and has the value of objectively quantifying even subtle changes in retinal thickness. The high reproducibility of retinal thickness measurements allows OCT to be used for longitudinal objective monitoring of the treatment efficacy. A change in macular thickness of more than 10% of the baseline measurement has been considered as significant and not due to the variability of the method (Massin et al., 2001; Polito et al., 2005). It is worth noting here that fluorescein angiography also has its value in verifying macular ischemia. Several studies have stated that macular ischemia is a possible explanation for the lack of functional improvement in patients with good structural outcome after conservative or surgical treatment (Massin et al., 2003; Otani & Kishi, 2000). However, OCT is becoming the mainstay of objective treatment monitoring and follow-up of patients with macular edema. It is widely accepted in trials and studies (DRCRN, 2010; Estabrook et al., 2007; Otani & Kishi, 2000; Ozdemir et al., 2005; Patel et al., 2006), as well as in clinical settings.
www.intechopen.com
234
Diabetic Retinopathy
3.2 Retinal microstructure The main characteristic OCT features of macular edema are: increased retinal thickness, reduced intraretinal reflectivity, irregularity of the layered structure, and flattening of the foveal depression (fig. 2). If edema persists, cystoid cavities may appear (Brancato & Lumbroso, 2004; Saxena & Meredith, 2006; Schumann et al., 2004). In macular edema serous fluid may be present under a detached neurosensory retina as a serous macular detachment (SMD). Hard exudates, hemorrhages and cotton-wool spots may also be present in macular tissue and their characteristics have been described (2.2.2.OCT interpretation – qualitative analysis).
Fig. 2. Simple non-cystoid diabetic macular edema: increased retinal thickness, flattening of the foveal depression, irregularity of the layered structure, hard exudates (multiple red spots with shadowing of underlying tissue), without cystoid spaces. The accumulation of intraretinal fluid leads to increase in retinal thickness and reduction of optical reflectivity. The layered macular structure becomes irregular. In our studies (KolevaGeorgieva & Sivkova, 2008; 2009), and also in others (Kim et al., 2006; Otani et al, 1999) it was described that areas with reduced reflectivity were located mainly in the outer retinal layers and the inner layers were displaced anteriorly. This was noted especially for simple macular edema, which is the beginning of retinal disruption. According to histopathologic studies of eyes with macular edema, fluid accumulation starts with intracytoplasmic swelling of Müller cells in the outer plexiform layer of Henle (Yanoff et al., 1984). Areas with reduced reflectivity on OCT images probably represent the swollen Müller cells. If macular edema persists, necrosis of Müller cells and the adjacent neurons occurs (Yanoff et al., 1984). This leads to cystoid cavity formation in the retina.
Fig. 3. Mild cystoid diabetic macular edema: intraretinal cystoid spaces with horizontal diameter < 300μm.
www.intechopen.com
Optical Coherence Tomography Findings in Diabetic Macular Edema
235
Fig. 4. Intermediate cystoid diabetic macular edema: intraretinal cystoid spaces with horizontal diameter ≥ 300μm < 600μm (star), note smaller cystoid spaces located in the inner layers (white arrowheads), epiretinal membrane with focal adhesions and distortion of retinal contour (white arrow), and posterior hyaloid detached from retinal surface (yellow arrows) with peripapillary adhesion (not shown on this scan).
Fig. 5. Severe cystoid diabetic macular edema: intraretinal cystoid spaces with horizontal diameter ≥ 600μm (star), note smaller cystoid spaces located in the inner layers (white arrowheads). On OCT images cystoid cavities appear as black non-reflective spaces, surrounded by medium-to-low reflective septa (fig. 3, 4 and 5). On en face OCT images cystoid spaces have well defined septae and, since this scan lies in the coronal plane, we may draw out additional information about the extent and location of the cystoid spaces. The cystoid cavities were observed to be located in the outer layers in newly developed edema, and to engage the inner layers in well-established edema forming large confluent cystoid cavities (Otani et al., 1999). In our study we found correlation between the size of cystoid spaces and retinal thickness and visual acuity (Koleva-Georgieva & Sivkova, 2008). We decided to subdivide cystoid DME into mild, moderate, and severe according to the size of cystoid spaces (fig. 3, 4 and 5). The mild cystoid DME presents with small cysts mainly in the outer retinal layers. The cystoid spaces in eyes with intermediate and severe cystoid DME were mainly located in the outer layers, predominantly in the fovea. Still, some of these eyes also had small cysts in the inner layers. We assume that fluid accumulation in cystoid spaces in the inner retinal layers could be a result of the progression of macular edema. With progression, disruption of cystic septae may ensue. Large confluent cystoid cavities may form to involve almost the entire thickness of the retina and give a retinoschisis appearance. In these cases a thin layer of atrophic retinal tissue remains over the retinoschisis spaces, and the eyes have profound visual loss. This probably represents the last stage of retinal disruption. The lower visual acuity in eyes with severe cystoid DME and the statistically
www.intechopen.com
236
Diabetic Retinopathy
significant difference when comparing with the milder cystoid DME types show that the subtypes of cystoid DME could be consecutive stages of macular edema progression with worsening of visual function. We recommend that the size of cystoid spaces should be analyzed when evaluating patients with DME.
Fig. 6. Serous macular detachment: a dome-shaped hypo-reflective area under the detached neurosensory retina and over the hyper-reflective layer of the pigment epithelium (white arrow), note the association with severe cystoid space (white star), confluent cystoid spaces with retinoschisis appearance (yellow stars), and the small cystoid spaces in the inner layers (arrowheads).
Fig. 7. 3D OCT image reconstruction with consequent coronal and longitudinal slicing: represents serous macular detachment (black arrow) and cystoid spaces (black arrowhead), note that the reflectivity of the serous macular detachment border (representing photoreceptor IS/OS) is more reflective than the cystoid septae. In eyes with macular edema the pattern of SMD may also be found (Alkuraya et al., 2005; Catier et al., 2005; Kaiser et al., 2001; Kim et al., 2006; Koleva-Georgieva & Sivkova, 2009; Otani et al., 1999; Panozzo et al. 2004). This feature can be detected “in vivo” only by means of OCT, as it does not show on ophthalmoscopy or fluorescein angiography. However, it has been well documented by Wolter in a histopathology study on eyes with DME (Wolter, 1981). The pathogenesis of SMD is not completely understood, and its significance still remains unknown. The most debatable factor is macular traction. Some authors point out traction as a leading cause (Kaiser et al., 2001), while others completely reject this hypothesis (Catier et al., 2005). There are statements that SMD is innocuous and transient (Ozdemir et al., 2005), while others state it is the last stage of chronic edema (Brancato & Lumbroso, 2004). On OCT scans SMD appears as a low-reflective area under the detached neurosensory retina and over the hyper-reflective line of the pigment epithelium. It is usually confined to the
www.intechopen.com
Optical Coherence Tomography Findings in Diabetic Macular Edema
237
foveal area (fig. 6). On en face OCT scans SMD appears as round area of low reflectivity, surrounded by a medium reflectivity line (fig. 7). In our study on 79 eyes with DME, we found SMD in 9 eyes (11.4%), (Koleva-Georgieva & Sivkova, 2009). This prevalence is comparable to other studies (Alkuraya et al., 2005; Kang et al., 2004; Kim et al., 2006; Otani et al., 1999). In our cohort of studied eyes, SMD was combined predominantly with cystoid edema pattern (intermediate cystoid in 5 eyes, severe cystoid in 3 eyes), and was combined with simple edema pattern only in 1 eye. The cystoid spaces were located in the outer retinal layers and the largest ones leaned to the center of fovea. In 6 eyes we also observed smaller cystoid spaces in the inner retinal layers that tended to be outside the fovea. Hard exudates were seen in 5 eyes. On fluorescein angiography the eyes with SMD presented with diffuse leakage in one eye and cystoid edema pattern in 8 eyes. Macular ischemia was found in 6 eyes. There was similarity in the distribution of macular traction types among eyes with SMD (no traction – 3 eyes, questionable – 3 eyes, and definite – 3 eyes). So, our findings may be in support of the statement that macular ischemia plays important role in the development in SMD, and that macular traction is of equivocal significance (Catier et al., 2005). The height of SMD did not correlate with retinal thickness or with best corrected visual acuity. Eyes with SMD had lower visual acuity than eyes with simple and mild cystoid DME type, and thicker retinas than eyes with simple, mild cystoid and intermediate cystoid DME. The difference was not significant between eyes with SMD and eyes with severe cystoid DME. Some authors state that SMD may be just a transient edema and leaves no functional consequences (Ozdemir et al., 2005). Our findings differ from this statement. In our cohort, SMD was predominantly accompanied by intermediate and severe cystoid edema pattern, there was macular ischemia in 6 of 9 eyes, and visual acuity was worse than that in eyes with simple non-cystoid and mild cystoid DME. On one hand it seemed that the SMD presence did not determine visual function and the low visual acuity could be due to the association of the SMD with large cystoid spaces and presence of macular ischemia. On the other hand we still observed SMD predominantly in eyes with intermediate and severe cystoid edema, which are meant to be advanced and graver types of edema and this association may be meaningful. The number of eyes with SMD in our study was too small and the published data from other studies are controversial. Further larger studies are needed to elucidate the pathogenesis and reveal the functional consequences of SMD. Nevertheless, SD OCT proved to be useful in detecting SMD and accompanying changes in retinal morphology and vitreoretinal interface. In the past few years, since the introduction of SD OCT, it became possible to accurately visualize the outer retinal layers. The integrity of these layers has has been reported to correlate with with retinal function and discussion in literature is still ongoing about its prognostic value. Several authors have found out that visual acuity has a positive correlation with the survival rate of ELM and IS/OS (Otani et al., 2010), and that the postoperative status of the photoreceptors is related to the final visual function after resolution of normal retinal morphology morphology following surgery surgery for persistent DME (Sakamoto et al., 2009) or epiretinal membrane (ERM), (Mitamura et al., 2009; Oster et al., 2010). The percentage disruption of the photoreceptor IS/OS junction layer is a significant predictor of visual acuity (Maheshwary et al, 2010). Analysis of the integrity of IS/OS and ELM on SD OCT scans should be a part of macular edema evaluation (fig. 8).
www.intechopen.com
238
Diabetic Retinopathy
Fig. 8. Outer retinal layers inner segment (IS)/outer segment (OS) and external limiting membrane (ELM): A – intact IS/OS and ELM in eye with mild cystoid diabetic macular edema, B – disturbed integrity in eye with severe cystoid diabetic macular edema. 3.3 Vitreoretinal interface and macular traction Macular traction is a factor implemented in the pathogenesis of macular edema and there is increasing evidence that releasing it via vitrectomy may be beneficial (DRCRN, 2010; Patel et al., 2006; Yanyali et al., 2007). Macular traction may be induced by vitreoretinal interface abnormalities such as incomplete posterior vitreous detachment (PVD) or ERM. In 1984 Shepens and coauthors postulate the role of incomplete PVD in the formation or progression of macular edema in susceptible eyes, such as of diabetics. Before the introduction of OCT, Hikichi and associates and Nasrallah and associates have evaluated the presence and characteristics of PVD in eyes with DME by ophthalmoscopy. They found relatively small prevalence of complete PVD (27% and 20%) and great number of eyes lacking PVD (64.6% and 77%) in diabetic eyes (Hikichi et al, 1997; Nasrallah et al., 1988). They observed incomplete PVD in 8.4% and 3% of cases and it was ophthalmoscopically detected by a thickened and taut posterior hyaloid. Such cases of thick taut and attached to the top of the raised macular surface posterior hyaloid are easily recognizable on ophthalmoscopy and indicate obvious vitreomacular traction. In other cases, when the posterior hyaloid is thin and slightly detached from the macular surface, it is not visible on ophthalmoscopy, but can be demonstrated on OCT. This type of incomplete PVD is quite common and it resembles the early stages of PVD in normal eyes (Uchino et al., 2001; Gaucher et al., 2005). The role of this type of incomplete PVD in the pathogenesis of macular edema is not fully understood. Several studies have classified the incomplete PVD in order to define its relation with macular edema (Gaucher et al., 2005; Koizumi et al, 2008; Panozzo et al., 2004).
www.intechopen.com
Optical Coherence Tomography Findings in Diabetic Macular Edema
239
Fig. 9. Questionable macular traction: incomplete posterior vitreous detachment with peripapillary adhesion, without signs of distortion of retinal contour.
Fig. 10. Questionable macular traction: incomplete posterior vitreous detachment (PVD) in severe cystoid macular edema (A – OCT B-scan, B and C – OCT en face C-scan images with fundus overlay), broad based incomplete PVD without distortion of retinal contour at points of adhesion (white arrow), cystoid space (white star), retinoschisis space (yellow stars), hard exudates (yellow arrow), note that on the en face OCT image the extent and location of the hard exudates, cystoid spaces and the retinoschisis space can be visualized.
Fig. 11. Definite macular traction caused by incomplete posterior vitreous detachment with distortion of retinal contour at points of adhesion (white arrows), A – accompanying severe cystoid macular edema, note the presence of large confluent cystoid cavity with retinoschisis appearance (star), B – accompanying mild cystoid macular edema.
www.intechopen.com
240
Diabetic Retinopathy
On OCT scans the posterior hyaloid appears as thin hyper-to-medium reflective line in the non-reflective vitreous cavity at a distance from the retinal surface (fig. 4, yellow arrows, fig. 9, 10 and 11, white arrows). In case of incomplete PVD it may have adhesions to foveal (fig. 10 and 11) or peripapillary (fig. 9) retinal tissue (Gaucher et al., 2005). The vitreomacular adhesion may be broad-based (broad) or narrow-based (focal), (Forte et al., 2007; Koizumi et al. 2008). Panozzo and coauthors have described 3 types of epimacular traction: (1) flat hyper-reflective line, adherent to the retina without significant retinal distortion, (2) continuous hyper-reflective line with multiple points of adhesion, with significant retinal distortion, and (3) antero-posterior traction with “gull wings” configuration. Types (1) and (2) resemble ERM and tangential epiretinal traction, and type (3) represents incomplete PVD with antero-posterior traction and retinal distortion. They do not speculate the cause of traction (ERM or incomplete PVD), but just stress on the presence of distortion of the retinal surface. According to this statement and our clinical findings (Koleva-Georgieva & Sivkova, 2008, 2009), we presume that it is worth to examine retinal surface on OCT scans and differentiate the presence of distortion of the retinal contour at the points of adhesion as this may indicate definite mechanical traction.
Fig. 12. Definite macular traction: epiretinal membrane (ERM) with distortion of retinal surface contour (white arrows), A – fundus image, B – OCT B-scan, C and D – 3D OCT reconstruction, E – en face C-scan, F – OCT C-scan/fundus image overlay, note the characteristic “brush-like” appearance of the ERM on en face scans. In patients with diabetic retinopathy secondary ERM may develop and cause tangential macular traction. On OCT scans ERM appears as hyper-reflective line lying on retinal surface (fig. 4, white arrow, fig. 12 B). On en face coronal OCT scan ERM has a characteristic “star-like” or “brush-like” appearance (fig. 12 C, D, E and F). It may lead to loss of foveal depression, increase in macular thickness, and formation of cystoid spaces or pseudoholes. ERMs may have global or focal adherence. Mori and coauthors have described that cases of globally adherent ERMs represent earlier stages of ERM development and are associated with less morphologic changes. ERMs with focal adhesions represent a more advanced stage with significant macular thickening, loss of foveal depression and formation of cystoid spaces (Mori et al., 2004). Secondary ERMs were more likely to have focal adhesions, whereas primary ERMs tended to be globally adherent (Mori et al., 2004). ERM with multiple points of adhesion usually cause distortion of retinal contour which is detectable on SD OCT (Koleva-Georgieva & Sivkova, 2008, 2009) and may indicate more obvious mechanical traction on retina. OCT is helpful in the detection of incomplete PVD and ERM. Since macular traction is one of the causes for the development and persistence of DME, the
www.intechopen.com
Optical Coherence Tomography Findings in Diabetic Macular Edema
241
evaluation of its presence is a substantial part in OCT macular edema assessment. OCT proves to be very useful in diagnosing these vitreoretinal interface abnormalities and follow the postoperative morphological outcome.
4. OCT classification of DME The first OCT-classification of DME (Otani et al., 1999) is based on retinal morphological changes: “sponge-like swelling”, cystoid edema, and serous retinal detachment. Other published classifications are presented by several authors (Kang et al., 2004; Kim et al., 2006; Panozzo et al., 2004). We propose and use in our clinical practice a classification, which summarizes several quantitative and qualitative OCT data: retinal thickness, retinal morphology, retinal topography, macular traction and foveal photoreceptor status. It is based on published data by previous authors and our clinical observations and studies. I. Retinal thickness: 1. 2.
3.
No macular edema – normal macular morphology and thickness not reaching the criteria for subclinical DME; Early subclinical macular edema – no clinically detected retinal thickening on ophthalmoscopy, OCT measured retinal thickness exceeding normal +2SDs for central fixation point and fovea; Established macular edema – retinal thickening and evident morphological characteristics of edema.
II. Retinal morphology: 1.
2.
3.
Simple non-cystoid macular edema – increased retinal thickness, reduced intraretinal reflectivity, irregularity of the layered structure, flattening of the foveal depression, without presence of cystoid spaces (fig. 2); Cystoid macular edema – the above criteria, associated with presence of well defined intraretinal cystoid spaces 2.a mild cystoid macular edema – cystoid spaces with horizontal diameter < 300μm (fig.3) 2.b intermediate cystoid macular edema – cystoid spaces with horizontal diameter ≥ 300μm < 600μm (fig. 4) 2.c severe cystoid macular edema – cystoid spaces with horizontal diameter ≥ 600μm, or large confluent cavities with retinoschisis appearance (fig. 5, 10, and 11 A); Serous macular detachment – any of the above, associated with serous macular detachment (hypo-reflective area under the detached neurosensory retina and over the hyper-reflective line of the pigment epithelium), (fig. 6 and 7).
III. Retinal topography: 1. 2.
Non-significant macular edema; Clinically significant macular edema, as defined by ETDRS and evaluated on the OCT retinal topography map.
IV. Presence and severity of macular traction (incomplete PVD and/or ERM): 1.
No macular traction – presence of complete PVD (Weiss ring detected on ophthalmoscopy), or no PVD (no visible posterior hyaloid line on SD OCT), and no ERM (fig. 2, 5, and 6);
www.intechopen.com
242 2.
3.
Diabetic Retinopathy
Questionable macular traction – incomplete PVD with perifoveal or peripapillary adhesion and/or globally adherent ERM without detectable distortion of retinal surface contour at the points of adhesion (fig. 9 and 10); Definite macular traction – incomplete PVD with perifoveal adhesion and/or focal ERM with detectable distortion of retinal contour at the points of adhesion (fig. 4, white arrow, 11, and 12).
V. Retinal outer layers integrity (IS/OS and ELM): 1. 2.
IS/OS and ELM intact (fig. 8 A); IS/OS and ELM with disrupted integrity (fig. 8 B).
5. Future developments in OCT In 2001, Drexler and associates introduced Ultrahigh Resolution OCT (Drexler et al., 2001). The technology is similar to standard resolution OCT, but the light source is replaced by a broadband Ti:Sapphire short pulse laser. It generates axial resolution of 3 μm in the eye. The advantage of Ultrahigh Resolution OCT is the improved delineation of all retinal layers, more detailed structure imaging and more precise measurements. In 1997 Podoleanu and associates pioneered the development of a different OCT imaging approach – en face OCT, or scanning the coronal plane (Podoleanu et al., 1997). En face OCT is possible with TD OCT or SD OCT, but the scanning regime has changed from fast scanning in the Z-axis to fast scanning in the XY plane. The axial resolution of en face OCT is similar to conventional OCT, but the transverse resolution is better, leading to a subjectively higher image resolution. En face OCT is combined with confocal Scanning Laser Ophthalmoscopy (SLO), using a single light source. The images in the confocal and the OCT channels are produced simultaneously using the same light source and are therefore in strict pixel-to-pixel correspondence. The SLO provides a high quality fundus image. The exact correspondence allows obtaining of an OCT – SLO fundus image overlay (fig. 10 B and C; fig. 11 F). Analyzing C-scan OCT images is more difficult than B-scan retinal images, but it offers complementary information. The en face plane is the conventional plane of ophthalmoscopy, so analyzing retinal pathology on en face C-scans and on OCT Cscan/SLO fundus image overlays provides additional information about the size, extent and location of pathological features. OCT C-scans may be overlaid with other en face imaging or functional diagnostic methods (fluorescein angiography, ICG angiography, microperimetry, and multifocal electroretinography) thus offering a complex approach to the diagnostic evaluation of macular pathology. In 2002, Dubois and coworkers reported the development of the ultrahigh resolution fullfield en face OCT, which achieves 0.8 μm axial and 1.8 μm transverse resolution (Dubois et al., 2002). It has been used for ex vivo microscopic imaging of subcellular details of animal ocular tissues. In the recent years much research progress has been done in developing adaptive optics to OCT machines. Conventional OCT has good axial resolution (5μm for SD OCT), but low transverse resolution (15-20 μm). It is because of the numerous aberrations of the optics of the system and the eye itself. Adaptive optics corrects these aberrations by wavefront detection and modulation (van Velthoven et al., 2007). Functional OCT methods are also under development, such as polarization-sensitive OCT (combines OCT with tissue birefringence analysis for precise examination of NFL), color Doppler OCT (for
www.intechopen.com
Optical Coherence Tomography Findings in Diabetic Macular Edema
243
supplementary evaluation of retinal blood flow), retinal optophysiology on Ultrahigh Resolution OCT scans (detects changes in the optical properties during a provoked action potential), molecular contrast OCT and nanoparticle based molecular contrast OCT (analyzing tissue or cell structures by use of specific targeted molecules or nanoparticles).
6. Conclusion OCT is a novel imaging modality that has made significant impact in the diagnostic evaluation of patients with DME. It was a complementary device to stereo-ophthalmoscopy and fluorescein angiography, and now it has become a new imaging standard in retinal diagnostics. The major contribution of OCT is the possibility of obtaining objective and reliable retinal thickness measurements along with “in vivo” visualization of retinal and vitreo-retinal microstructure. The early diagnosis of DME, precise estimation of the different morphologic patterns and presence of macular traction are of uppermost significance in determining the therapeutic approach and prognosis. OCT has proved to achieve these requirements and to ensure objective monitoring of treatment results.
7. References Alamouti, B. & Funk, J. (2003) Retinal thickness decreases with age: an OCT study. Br J Ophthalmol, Vol. 87, No. 7 (July 2003), pp. 899-901 Alkuraya, H., Kanagave, D. & Abu El-Asrar, A.M. (2005). The correlation between optical coherence tomography features and severity of retinopathy, macular thickness, and visual acuity in diabetic macular edema. Int Ophthalmol, Vol. 26, No. 3 (June 2005), pp.93-99 Asefzadeh, B., Cavallerano, A.A. & Fisch, B.M. (2007). Racial differences in macular thickness in healthy eyes. Optom Vis Sci, Vol. 84, No. 10 (Oct. 2007), pp. E941-E945 Brancato, R. & Lumbroso, B. (1st ed.). (2004). Guide to optical coherence tomography interpretation, I.N.C., Roma, Italy Browning, D.J., Fraser, C.M. & Clark, S. (2008). The relationship of macular thickness to clinically graded diabetic retinopathy severity in eyes without clinically detected diabetic macular edema. Ophthalmology, Vol. 115, No. 3 (March 2008), pp. 533-539 Catier, A., Tadayoni, R., Paques, M., Erginay, A., Haouchine, B., Gaudric, A. & Massin, P. (2005). Characterisation of macular edema from various etiologies by optical coherence tomography. Am J Ophthalmol, Vol. 140, No. 2 (August 2005), pp. 200-206 Chan, A., Duker, J.S., Ko, T.H., Fujimoto, J.G. & Schuman, J.S. (2006) Normal macular thickness measurements in healthy eyes using Stratus optical coherence tomography. Arch Ophthalmol, Vol. 124, No. (February 2006), pp. 193-198 Choma, M., Sarunic, M., Yang, C. & Izatt, J. (2003). Sensitivity advantage of swept sourse and Fourier domain optical coherence tomography. Opt Express, Vol. 11, No. 18 (September 2003), pp. 2183-2189 Diabetic Retinopathy Clinical Research Network. (2007). Reproducibility of macular thickness and volume using Zeiss optical coherence tomography in patients with diabetic macular edema. Ophthalmology, Vol. 114, No. 8 (August 2007),pp.1520-1525 Diabetic Retinopathy Clinical Research Network. (2008). Retinal thickness on Stratus optical coherence tomography™ in people with diabetes and minimal or no diabetic retinopathy. Am J Ophthalmol, Vol. 145, No. 5 (May 2008), pp. 894-901
www.intechopen.com
244
Diabetic Retinopathy
Diabetic Retinopathy Clinical Research Network Writing Committee. (2010). Vitrectomy outcomes in eyes with diabetic macular edema and vitreomacular traction. Ophthalmology, Vol. 117, No. 6 (June 2010), pp. 1087-1093 Domalpally, A., Danis, R.P., Zhang, B., Myers, D. & Kruse, C.N. (2009) Quality issues in interpretation of optical coherence tomograms in macular diseases. Retina, Vol. 29, No. 6 (July 2009), pp.775-781 Drexler, W., Morgner, U., Ghanta, R.K., Kaertner, F.X., Schuman, J.S. & Fujimoto,J.G. (2001). Ultrahigh-resolution ophthalmic optical coherence tomography. Nat Med, Vol. 7, No. 4 (April 2001), pp. 502-507 Dubois, A., Vabre, L., Boccara, A.C. & Beaurepaire, E. (2002). High-resolution full-field optical coherence tomography with a Linnik microscope. Appl Opt, Vol. 41, No. 4 (February 2002), pp. 805-812 Early Treatment Diabetic Retinopathy Study Research Group. (1991). Grading diabetic retinopathy from stereoscopic color fundus photographs – an extension of the modified Airlie house classification. ETDRS report number 10. Ophthalmology, Vol. 98, No. 5 Suppl (May 1991), pp. 786-806 El-Ahsry, M., Hedge, V., James, P. & Pagliarini, S. (2008). Analysis of macular thickness in British population using optical coherence tomography (OCT): an emphasis on interocular symmetry. Curr Eye Res, Vol. 33, No. 8 (August 2008), pp. 693-699 Eriksson, U. & Alm, A. (2009). Macular thickness decreases with age in normal eyes. A study on the macular thickness map protocol in the Stratus OST. Br J Ophthalmol, Vol. 93, No. 11 (November 2009), pp. 1448-1452 Estabrook, E.J., Madhusudhana, K.C., Hannan, S.R. & Newsom, R.S.B. (2007). Can optical coherence tomography predict the outcome of laser photocoagulation for diabetic macular edema? Ophthalmic Surg Lasers Imaging, Vol. 38, No. 6 (November/ December 2007), pp. 478-483 Gaucher, D., Tadayoni, R., Erginay, A., Haouchine, B., Gaudrich, A. & Massin, P. (2005). Optical coherence tomography assessment of the vitreoretinal relationship in diabetic macular edema. Am J Ophthalmol, Vol. 139, No. 5 (May 2005), pp. 807-813 Grover, S., Murthy, R.K., Brar, V.S. & Chalam, K.V. (2010). Comparison of retinal thickness in normal eyes using Stratus and Spectralis Optical Coherence Tomography. Invest Ophthalmol Vis Sci, Vol. 51, No. 5 (May 2010), pp. 2644-2647 Guedes, V., Schuman, J.S., Hertzmark, E., Wollstein, G., Correnti, A., Mancini, R., Lederer, D., Voskanian, S., Velazquez, L., Pakter, H.M., Pedut-Kloizman, T., Fujimoto, J.G. & Mattox, C. (2003). Optical coherence tomography measurement of macular and nerve fiber thickness in normal and glaucomatous human eyes. Ophthalmology, Vol. 110, No. 1 (January 2003), pp. 177-189 Han, I.C. & Jaffe G.J. (2009). Comparison of spectral- and time-domain optical coherence tomography for retinal thickness measurements in healthy and diseased Vol. 147, No. 5 (May 2009), pp. 847-858 Hee, M.R., Puliafito, C.A., Wong, C., Duker, J.S., Reichel, E., Rutledge, B., Schuman, J.S., Swanson, E.A. & Fujimoto, J.G. (1995). Quantitative assessment of macular edema with optical coherence tomography. Arch Ophthalmol, Vol. 113, No. 8 (August 2008), pp. 1019-1029
www.intechopen.com
Optical Coherence Tomography Findings in Diabetic Macular Edema
245
Hee, M.R., Puliafito, C.A., Duker, J.S., Reichel, E., Coker, J.G., Wilkins, J.R., Schuman, J.S., Swanson, E.A. & Fujimoto, J.G. (1998). Topography of diabetic macular edema with optical coherence tomography. Ophthalmology,Vol.105, No.2 (Febr 1998), pp.360-370 Hikichi, T., Fujio, N., Akiba, J., Azuma, Y., Takahashi, M. & Yoshida, A. (1997). Association betweeen the short-term natural history of diabetic macular edema and vitreomacular relationship in type II diabetes mellitus. Ophthalmology, Vol. 104, No. 3 (March 1997), pp.473-478 Ho, J., Sull, A.C., Vuong, L.N., Chen, Y., Liu, J., Fujimoto, J.G., Schumann, J.S. & Duker, J.S. (2009) Assessment of artifacts and reproducibility across spectral- and time-domain optical coherence tomography. Ophthalmology, Vol. 116, No. 10 (October 2009), pp. 1960-1970 Huang, D., Swanson, E.A., Lin, C.P., Schuman, J.S., Stinson, W.G., Chang, W., Hee, M.R., Flotte, T., Gregory, K., Puliafito, C.A. (1991) Optical coherence tomography. Science, Vol. 254, No. 5035, pp. 1178-1181 Izatt, J.A., Kulkarni, M.D., Yazdanfar, S., Barton, J.K. & Welch, A.J. (1997). In vivo bidirectional color Doppler flow imaging of picoliter blood volumes using optical coherence tomography. Opt Lett, Vol. 22, No. 18 (September 1997), pp. 1439-1441 Kaiser, P.K., Riemann, C.D., Sears, J.E. & Lewis, H. (2001). Macular traction detachment and diabetic macular edema associated with posterior hyaloidal traction Am J Ophthalmol, Vol. 131, No. 1 (January 2001), pp. 44-49 Kang, S.W., Park, C.Y. & Ham, D.I. (2004). The correlation between fluorescein angiographic and optical coherent tomographic features in clinically significant diabetic macular edema. Am J Ophthalmol, Vol. 137, No. 2 (February 2004), pp. 313-322 Kelty, P.J., Payne, J.F., Trivedi, R.H., Kelty, J., Bowie, E.M. & Burger, B.M. (2008). Macular thickness assessment in healthy eyes based on ethnicity using Stratus OCT optical coherence tomography. Invest Ophthlamol Vis Sci, Vol. 49, No. 6 (June 2008), pp. 2668-72 Kim, B.Y., Smith, S.D. & Kaiser, P.K. (2006). Optical coherence tomographic patterns of diabetic macular edema. Am J Ophthalmol, Vol. 142, No. 3 (Sept. 2006), pp. 405-412 Koizumi, H., Spaide, R.F., Fisher, Y.L., Freund, K.B., Klancnik, J.M.Jr. & Yanuzzi, L.A. (2008). Three-dimensional evaluation of vitreomacular traction and epiretinal membrane using spectral-domain optical coherence tomography. Am J Ophthalmol, Vol. 145, No. 3 (March 2008), pp. 509-517 Koleva-Georgieva, D.N. & Sivkova, N.P. (2008). Types of diabetic macular edema assessed by optical coherence tomography. Folia Med (Plovdiv), Vol. 50, No. 3, (JulySeptember 2008), pp. 30-38 Koleva-Georgieva, D. & Sivkova, N. (2009). Assessment of serous macular detachment in eyes with diabetic macular edema by use of spectral-domain optical coherence tomography. Graefes Arch Clin Exp Ophthalmol, Vol. 247, No. 11 (November 2009), pp. 1461-1469 Koleva-Georgieva, D.N. & Sivkova, N.P. (2010) Optical coherence tomography for the detection of early macular edema in diabetic patients with retinopathy. Foia Med (Plovdiv), Vol. 52, No. 1 (January-March 2010), pp. 40-48 Krebs, I., Falkner-Radler, C., Hagen, S., Haas, P., Brannath, W., Lie, S., Ansari-Shahrezaei, S. & Binder, S. (2009) Quality of the threshold algorithm in age-related macular
www.intechopen.com
246
Diabetic Retinopathy
degeneration: Stratus versus Cirrus OCT. Invest Ophthalmol Vis Sci, Vol. 50, No. 3 (May 2009), pp. 995-1000 Lam, D.S., Leung, K.S., Mohamed, S., Chan, W.M., Palanivelu, M.S., Cheung, C.Y., Li, E.Y., Lai, R.Y. & Leung, C.K. (2007). Regional variations in the relationship between macular thickness measurements and myopia. Invest Ophthalmol Vis Sci, Vol. 48, No. 1 (January 2007), pp. 376-382 Lim, M.C., Hoh, S.T., Foster, P.J., Lim, T.H., Chew, S.J., Seah, S.K. & Aung, T. (2005). Use of optical coherence tomography to assess variations in macular retinal thickness in myopia. Invest Ophthalmol Vis Sci, Vol. 46, No. 3 (March 2005), pp. 974-978 Leung, C.K., Cheung, C.Y., Weinreb, RN.., Lee, G., Lin, D., Pang, C.P. & Lam, D.S.C. (2008). Comparison of macular thickness measurements between time domain and spectral domain optical coherence tomography. Invest Ophthalmol Vis Sci, Vol. 49, No. 11 (November 2008), pp. 4893-4897 Maheshwary, A.S., Oster, S.F., Yuson, R.M.S., Cheng, L., Mojana, F. & Freeman, W.R. (2010). The association between percent disruption of the photoreceptor inner segment/outer segment and visual acuity in diabetic macular edema. Am J Ophthalmol Vol. 150, No. 1 (May 2010), pp. 63-67 Massin, P., Erginay, A., Haouchine, B., Mehidi, A.B., Paques, M. & Gaudrich, A. (2002). Retinal thickness in healthy and diabetic subjects measured using optical coherence tomography mapping software. Eur J Ophtlamol, Vol.12, No. 2 (March-April 2002), pp.102-108 Massin, P., Duguid, G., Erginay, A., Haouchine, B. & Gaudric, A. (2003). Optical coherence tomography for evaluating diabetic macular edema before and after vitrectomy. Am J Ophthalmol, Vol. 135, No. 2 (February 2003), pp. 169-177 Mitamura, Y., Hirano, K., Baba, T. & Yamamoto S. (2009). Correlation of visual recovery to presence of photoreceptor inner/outer segment junction in optical coherence images after epiretinal membrane surgery. Br J Ophthalmol, Vol. 93, No. 2 (February 2009), pp. 171-175 Mori, K., Gelbach, P.L., Sano, A., Deguchi, T. & Yoneye, S. (2004) Comparison of epiretnal membranes of differing pathologies using optical coherence tomography. Retina, Vol. 24, No. 1 (January 2004), pp. 57-62 Nasrallah, F.P., Jalkh, A.E., Van Coppenolle, F., Kado, M., Trempe, C.L., McMeel, J.W. & Schepens, C.L. (1998). The role of the viteous in diabetic macular edema. Ophthalmology, Vol. 95, No. 10 (October 1988), pp.1335-1339 Ooto, S., Hangai, M., Sakamoto, A., Tomidokoro, A., Araie, M., Otani, T., Kishi, S., Matsushita, K., Maeda, N., Shirakashi, M., Abe, H., Takeda, H., Sugiyama, K., Saito,H., Iwase, A. & Yoshimura, N. (2010). Three-dimensional profile of macular retinal thickness in normal Japanese eyes. Invest Ophthalmol Vis Sci, Vol. 51, No. 1 (January 2010), pp. 465-473 Oster, S.F., Mojana, F., Brar, M., Yuson, R.M., Cheng, L. & Freeman, W.R. (2010). Disruption of the photoreceptor inner segment/outer segment layer on spectral domainoptical coherence tomography is a predictor of poor visual acuity in patients with epiretinal membranes. Retina, Vol. 30, No. 5 (May 2010), pp. 713-718 Otani, T., Kishi, S. & Maruyama, Y. (1999). Patterns of diabetic macular edema with optical coherence tomography. Am J Ophthalmol Vol. 127, No. 6 (June 1999), pp. 688-693
www.intechopen.com
Optical Coherence Tomography Findings in Diabetic Macular Edema
247
Otani, T. & Kishi, S. (2000). Tomographic assessment of viteous surgery for diabetic macular edema. Am J Ophthalmol, Vol. 129, No. 4 (April 2000), pp.487-494 Otani, T., Yamaguchi, Y & Kishi, S. (2010). Correlation between visual acuity and foveal microstructural changes in diabetic macular edema. Retina, Vol. 30, No. 5 (May 2010), pp. 774-780 Ozdemir, H., Karacorlu, M. & Karacorlu, S.A. (2005). Regression of serous macular detachment after intravitreal triamcinolone acetonide in patients with diabetic macular edema. Am J Ophthalmol, Vol. 140, No. 2 (August 2005), pp. 251-255 Ozdemir, H., Karacorlu, M. & Karacorlu. S. (2005). Serous macular detachment in cystoid diabetic macular edema. Acta Ophthalmol Scand, Vol. 83, No.1 (Feb. 2005), pp.63-66 Panozzo, G., Parolini, B., Gusson, E., Mercanti, A., Pinackatt, S., Bertoldo, G. & Pignatto, S. (2004). Diabetic macular edema: an OCT-based classification. Semin Ophthalmol, Vol. 19, No. 1-2 (March-June 2004), pp. 13-20 Patel, J.I., Hykin, P.G., Schadt, M., Luong, V., Fitzke, F. & Gregor, Z.J. (2006). Pars plana vitrectomy for diabetic macular oedema: OCT and functional correlations. Eye, Vol. 20, No. 6 (June 2006), pp. 674-680 Paunescu, L.A., Schuman, J.S., Price, L.L., Stark, P.C., Beaton, S., Ishikawa, H., Wollstein, G. & Fujimoto, J.G. (2004) Reproducibility of nerve fiber thickness, macular thickness, and optic nerve head measurements using Stratus OCT. Invest Ophthalmol Vis Sci, Vol. 45, No. 6, (June 2004), pp. 1716-1724 Podoleanu, A.G., Dobre, G.M., Webb, D.J. & Jackson, D.A. (1997). Simultaneous en-face imaging of two layers in the human retina by low-coherence reflectometry. Opt Lett, Vol. 22, No. 13 (July 1997), pp. 1039-1041 Podoleanu, A. G. (2005) Optical coherence tomography. Br J Radiology, Vol. 78, pp. 976-988 Polito, A., Del Borrello, M., Isola, M., Zemella, N. & Bandello, F. (2005). Repeatability and reproducibility of fast macular thickness mapping using Stratus optical coherence tomography. Arch Ophthalmol, Vol 123, No. 10 (October 2005), pp.1330-1337 Puliafito, C.A., Hee, M.R., Lin, C.P., Reichel, E., Schuman, J.S, Duker, J.S., Izatt, J.A., Swanson, E.A. & Fujimoto, J.G. (1995). Imaging of macular diseases with optical coherence tomography. Ophthalmology, Vol. 102, No.2 (February 1995), pp.217-229 Ray, R., Stinnett, S.S. & Jaffe, G.J. (2005) Evaluation of image artifacts produced by optical coherence tomography of retinal pathology. Am J Ophthalmol, Vol. 139, No. 1 (January 2005), pp. 18-29 Sadda, R.S., Wu, Z., Walsh, A.C., Richine, L., Dougall, J., Cortez, R. & LaBree, L.D. (2006) Errors in retinal thickness measurements obtained by optical coherence tomography. Ophthalmology, Vol. 113, No. 2 (February 2006), pp. 285-293 Sakamoto, A., Nishijima, K., Kita, M., Oh, H., Tsujikawa, A. & Yoshimura, N. (2009). Association between foveal photoreceptor status and visual acuity after resolution of diabetic macular edema by pars plana vitrectomy. Graefes Arch Clin Exp Ophthalmol, Vol. 247, No. 10 (October 2009), pp. 1325-1330 Saxena, S. & Meredith, T.A. (1st ed). (2006). Optical coherence tomography in retinal diseases. Jaypee Brothers Medical Publishers (P) Ltd., New Delhi, India Schaudig, U.H., Glaefke, C., Scholz, F. & Richard G. (2000). Optical coherence tomography for retinal thickness measurement in diabetic patients without clinically significant macular edema. Ophthalmic Surg Lasers, Vol. 31, No. 3 (May-June), pp. 182-186
www.intechopen.com
248
Diabetic Retinopathy
Schepens, C.L., Avila, M.P., Jalkh, A.E. & Trempe, C.L. (1984). Role of the vitreous in cystoid macular edema. Surv Ophthalmol Vol. 28, Suppl (May 1984), pp. 499-504 Schuman, J.S., Puliafito, C.A., Fujimoto, J.G. (2nd ed.). (2004). Optical coherence tomography of ocular diseases. SLACK Inc., Thorofare, NJ, USA Shahidi, M., Ogura, Y., Blair, N.P., Rusin, M.M. & Zeimer, R. (1991). Retinal thickness analysis for quantitative assessment of diabetic macular edema. Arch Ophthalmol, Vol. 109, No. 8 (August 1991), pp. 1115-1119 Srinivasan, V.J., Wojtkowski, M., Witkin, A.J., Duker, J.S., Ko, T.H., Carvalho, M., Schuman, J.S., Kowalczyk, A. & Fujimoto, J.G. (2006). High-definition and 3-dimensional imaging of macular pathologies with high-speed ultrahigh-resolution optical coherence tomography. Ophthalmology, Vol. 113, No. 11 (November 2006), pp. 2054.e1-2054.14 Toth, C.A., Narayan, D.G., Boppart, S.A., Hee, M.R., Fujimoto, J.G., Birngruber, R., Cain, C.P., DiCarlo, C.D. & Roach, W.P. (1997). A comparison of retinal morphology viewed by optical coherence tomography and by light microscopy. Arch Ophthalmol, Vol.115, No. 11 (November), pp. 1425-1428 Uchino, E., Uemura, A. & Ohba, N. (2001). Initial stages of posterior viteous detachment in healthy eyes of older persons evaluated by optical coherence tomography. Arch Ophthalmol, Vol. 119, No. 10 (October 2001), pp. 1475-1479 van Velthoven, M.E.J., Faber, D.J., Verbraak, F.D., van Leeuwen, T.G & de Smet, M.D. (2007). Recent developments in optical coherence tomography for imaging the retina. Prog Retin Eye Res, Vol. 26, No. 1 (January 2007), pp. 57-77 Williams, R., Airey, M., Baxter, H., Forrester, J., Kennedy-Martin, T. & Girach, A. (2004). Epidemiology of diabetic retinopathy and macular edema: a systematic review. Eye, Vol. 18, No. 10 (October 2004), pp. 963-983 Wolf-Schnurrbusch, U.E.K., Cekic, L., Brinkmann, C.K., Iliev, M.E., Frey, M., Rothenbuehler, S.P., Enzmann, V. & Wolf, S. (2009). Macular thickness measurements in healthy eyes using six different optical coherence tomography instruments. Invest Ophthalmol Vis Sci, Vol. 50, No. 7 (July 2009), pp. 3432-3437 Wolter, J.R. (1981). The histopathology of cystoid macular edema. Albrecht Von Graefes Arch Klin Exp Ophthalmol, Vol. 216, No. 2, pp. 85-101 Wu, P.C., Chen, Y.J., Chen, C.H., Shin, S.J., Yang, H.J. & Kuo, H.K. (2008). Assessment of macular retinal thickness and volume in normal eyes and highly myopic eyes with third generation optical coherence tomography. Eye, Vol. 22, No. 4 (April 2008), pp. 551-555 Yanoff, M., Fine, B.S., Brucker, A.Y. & Eagle, R.C.Jr. (1984). Pathology of human cystiod macular edema. Surv Ophthalmol, Vol. 28, No. Suppl (May 1984), pp.505-511 Yanyali, A., Horozoglu, F., Celik, E. & Nohutcu, A.F. (2007). Long-term outcomes of pars plana vitrectomy with internal limiting membrane removal in diabetic macular edema. Retina, Vol. 27, No. 5 (June 2007), pp.557-566
www.intechopen.com
Diabetic Retinopathy
Edited by Dr. Mohammad Shamsul Ola
ISBN 978-953-51-0044-7 Hard cover, 356 pages Publisher InTech
Published online 24, February, 2012
Published in print edition February, 2012 The aim of this book is to provide a comprehensive overview of current concepts in pathogenesis, diagnosis and treatments of diabetic retinopathy. It provides a collection of topics written by excellent authors, covering discussions on advances in understanding of pathophysiology, immunological factors and emerging concepts, relating to clinical aspects and treatment strategies. The contents of the book will not only provide a resource for our knowledge but also improve diagnosis and treatment options for those patients who suffer vision loss due to diabetic retinopathy.
How to reference
In order to correctly reference this scholarly work, feel free to copy and paste the following: Desislava Koleva-Georgieva (2012). Optical Coherence Tomography Findings in Diabetic Macular Edema, Diabetic Retinopathy, Dr. Mohammad Shamsul Ola (Ed.), ISBN: 978-953-51-0044-7, InTech, Available from: http://www.intechopen.com/books/diabetic-retinopathy/optical-coherence-tomography-findings-in-diabeticmacular-edema
InTech Europe
University Campus STeP Ri Slavka Krautzeka 83/A 51000 Rijeka, Croatia Phone: +385 (51) 770 447 Fax: +385 (51) 686 166 www.intechopen.com
InTech China
Unit 405, Office Block, Hotel Equatorial Shanghai No.65, Yan An Road (West), Shanghai, 200040, China Phone: +86-21-62489820 Fax: +86-21-62489821