19th International Conference on Production Research
OPERATING STRATEGIES FOR PRODUCTION PLANNING OF SEASONAL PRODUCTS A.Regattieri, F.Bindi, F.Lolli, R.Manzini, A.Persona
§
Department of Industrial and Mechanical Plants, University of Bologna, Viale Risorgimento, 2, Bologna, Italy § Department of Management and Engineering, University of Padova, Stradella San Nicola, 3 Vicenza – Italy Abstract As a type of demand, seasonal demand is extremely common but is difficult to manage efficiently. There are several studies in the literature investigating this problem. However, they introduce very complex policies or constraints not particularly close to real operating conditions (e.g. they consider a fixed profile of seasonality). As a result, companies manage this kind of demand using only their experience, usually applying stock based policies and consequently obtaining high storage levels. This paper presents a first set of results dealing with the performance study of two production planning methods that are effective in seasonal conditions: Anticipatory stock policy - (ASP) and Increased ratio policy - (IRP). These two methodologies are studied and compared using different seasonal demand patterns: three multilevel factors and twenty-four scenarios are investigated. Interesting observations about their real performance and suitability are presented. Keywords: production planning, operating strategies, seasonal product, seasonal pattern, ASP, IRP
1 INTRODUCTION A fundamental problem currently faced by a great many producers is the seasonal demand for their products. This problem is very common and concerns a wide variety of manufacturers who produce many different items, e.g. those significantly related to the weather (such as clothing or sunglasses), foodstuffs, Christmas season items and many others applications. The seasonal demand issue is difficult to assess for both the theorist and the practitioner. The problem requires the optimal combination of inventory and production rates for each product in each time period to be found: the principal question is to determine the product quantity in each period so as to minimize the discounted costs of production, inventory storage, and lost sales. This type of demand usually creates more complex problems than stationary demand because firms usually have insufficient capacity to meet demand in high demand periods (Fair [1], Krane et al. [2]). The academic literature provides some guidelines. Closedform optimal approaches are presented and were found to be very complicated, and consequently robust conclusions cannot be drawn. The simplest problem solved is the well-known one product, one period, unlimited capacity, stochastic demand problem otherwise known as the `newsvendor’ problem. With an increase in complexity from the newsvendor problem, the one product, multiple period, unlimited capacity, seasonal demand problem has been solved for each time period (Karlin [3], Zipkin [4]). Furthermore, the one product, multiple period, unlimited capacity, stationary demand (Federgruen and Zipkin [5],[6], Tayur [7]) and seasonal demand (Kapuscinski and Tayur [8]) problems have also been solved. Moving on to the management of multiple products, the multiple period, unlimited capacity, stationary demand problem is studied by Evans [9], Ciarallo and Akella [10], as well as Ciarallo et al. [11]. The subject of this study is
the problem created by adding seasonality to the problems studied by Evans [9] and Ciarallo et al. [11]. Other related studies regard the problem of a single time period with multiple products and stochastic demand under a capacity constraint. For example, they have been addressed by El Agizy [12]. However, none of the above techniques can be extended quickly in order to manage multiple time periods. Hodges and Moore [13] develop a heuristic approach to the seasonal demand case: their method can only be used when capacity is less than the sum of expected demand for all products. Metters [14] proposes a workable heuristic for the single product, seasonal stochastic demand problem: it can be extended to the multiple product environment, but the complexity of the multiple product algorithm precludes practical use (Metters [15]. Bush and Cooper [16] and Buxey [17] underline that in practice firms do not usually define planning methods. Instead, they generally use too much inventory, but they pay heavy stock-out costs in some situations. In conclusion, because of the complexity problem Metters [18] suggests 5 “practical” rules for production planning in seasonal environment. He specifically defines the following advice: minimize overcommitment risk; store capacity cheaply; production can be seasonal regardless of demand; produce the sure-things first; when the plan fails, produce the money-makers. The state of research means companies do not use methods proposed in the literature because they are too complicated and they require great effort in terms of both knowledge and computational complexity. Companies need simple formulations: they frequently have constraints on production ratio (e.g. it could be constant for all planning periods) and computational effort must not be too expensive i.e. low cost. For all these reasons two well-known approaches have been applied and were found to be very effective: anticipatory policy and increased ratio policy. The first policy requires the construction and management of
inventory system, in agreement with the average production rate, during low demand periods in anticipation of high later demand. The second policy is based on an increased ratio dinc (respecting average production), starting at the same time as first consumption and finishing before last consumption. A further significant observation applies to seasonal demand: in real applications seasonal demand patterns could be very different between high and low demand level in terms of shape, duration and gap. Production planning seems to be very conditioned by seasonal parameters, but there are no significant studies in the literature dealing with production planning faced with different kinds of seasonality (authors usually choose only one demand pattern). The aim of this study is to evaluate the performance of the two different methodologies proposed (anticipatory stock policy and increased ratio policy) faced with different seasonal demand patterns for a single product in terms of global costs along the whole supply chain. The final result is a “convenience table” which explains the difference between these two methods in terms of convenience based on the measure of global costs (inventory and stock-out costs) which are strongly related to different characteristics of seasonality (shape, levels and duration). To reach this result, the study is split into 2 different dedicated sections. The first section is related to the evaluation of the two policies under “no stock-out” condition: this hypothesis is very close to real behavior of companies. In fact, it is very difficult to persuade companies that production planning problem is a trade-off optimization between inventory and stock-out costs: they all prefer to build inventory systems. The final section enlarges this evaluation by introducing stock-out costs: this approach is based on a complete costs function. The following section presents the adopted global cost function, and its simplified version used for the first step of research. Models and hypothesis relating to two policies are also formulated. Section 3 discusses demand pattern. In particular, relevant characteristics of seasonal pattern are defined and the results of factorial analysis research are formalized. Results and related design of experimental test are presented in section 4. Conclusions are clarified and suggestions for further work are presented in the final section. 2 MODELS OF COST AND PRODUCTION POLICIES The performance of proposed production planning policies are evaluated through a costs function which is based on same definitions introduced by Metters (1998): t time period t = 1,2,…..n hp holding cost per period p
lost sales cost per unit production cost revenue per unit demand of product p in period t inventory on hand at the beginning of period t inventory on hand after production, before demand
cp vp xtp itp ytp ytp≥itp tp(x)
Ct Ctot C’tot
probability density function of xtp total cost for period t global cost (ref. n period cycle) simplified global cost function (only storage costs)
The total cost for each period t can be evaluated by calculating revenue minus cost of production, inventory and lost sales: yp
Ct
cp ( y tp
i tp )
[h p ( y p
x) vp x]
tp ( x )
x 0
[ p (x
(1)
yp) vp yp]
tp ( x )
x yp
It is assumed that the demand distribution varies periodically following a cycle of n periods. The total cost is: n
Ctot
Ct
t 1
n
yp
cp ( y tp
i tp )
t 1
[ p (x
[h p ( y p
x) vp x]
tp ( x )
x 0
yp) vp yp]
tp ( x )
(2 )
x yp
Note that hp, p, cp and vp do not depend on t; production cost does not include setup costs and there is no disposal or deterioration of inventory. 3
INITIAL RESEARCH AND SIMPLIFIED COST FUNCTION This study attempts to draw some conclusions for a condition very close to usual industrial behavior. After that, some hypotheses are determined: Single product Production planning with at minimum 1 period time horizon Production ratio constant for all periods No stock-out In these conditions the global cost function (2) is simplified. In particular, the storage costs function is able to evaluate the performance of proposed strategies. Following this, a new global cost function formulation is presented: n
C 'tot
t 1
yp
cp ( y tp
i tp )
[h p ( y p
x) vp x]
tp ( x )
(3 )
x 0
3.1 Production planning strategies Anticipatory stock policy (ASP) and increased ratio policy (IRP) appear to be suitable for companies which have to manage a seasonal demand with simple and robust methods. Nomenclature: di demand per period i
d dmax k(peak) t dinc k(end)
average demand per n periods difference between cumulative demand and cumulative production at the average ratio period when d is maximum advance of start production point (Anticipatory stock policy) [periods] increased ratio of production (Increased ratio policy) period when increased production stops
Anticipatory stock policy - (ASP) The main philosophy is production following the average ratio and anticipating the production for a number of
19th International Conference on Production Research
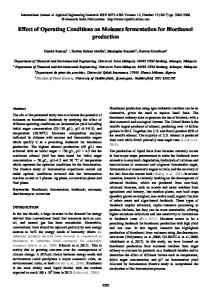
Research investigates the performance of the proposed methods for different seasonal demand patterns. Table 1 and figure 2 respectively show demand factors and the analyzed profiles.
periods ( t in figure 1) that permits stock in high demand period to be exploited. n
d
dj n
j 1
[pz/period]
Table 1: Product demand factors k
d
(4 )
dj
max
d k
k 1,2,...,n
shape 1 - demand generally low with high demand in some periods shape 2 - demand generally high with demand deficits in a few periods Levels values of demand, the notation is < high value / low value > number of periods with high level demand (shape 1) Duration and with low level demand (shape 2)
(5 )
Shape
j 1
d corresponds to period k(peak) in agreement with the following: k (peak )
d
dj
d k(peak )
(6)
shape 1
shape 2
d
j 1
d
high value
The advance in production t in terms of periods is related to:
d t
d
dj d
d k(peak )
j 1 n
d
j 1
(7)
dj n
Increased ratio policy - (IRP) The production starts at first period following the increased ratio dinc and stops at period k(end) (k(end)≤n). k (peak )
d inc
dj
(8)
k(peak )
j 1
The production stops at period k(end) in agreement with the following: n
dj j 1
(9)
dinc
Figure 1 explains fundamental principles which distinguish the two proposed policies. Anticipatory stock policy (ASP)
Increased ratio policy (IRP)
D
duration
Table 2: framework for the analysis of a single scenario
Demand Shape Levels Duration
dinc
d n
d K(peak)
4
t
D t di
t
low value
t
Figure 2: seasonal demand pattern In accordance with the definitions previously introduced 24 different configurations are evaluated and compared. First 4 column of table 3 summarize the parameters of different configurations. For each combination of parameters the two production planning schedules derived by the application of the two different policies are evaluated. In particular, the estimation of performance is based on the storage costs function (3), and in practice this goal is still further simplified by the simple estimate of storage levels (in terms of pieces). The set of parameters introduced for the evaluation process is: DCUM Total amount of real demand (for all n periods) [pieces] DASP Total amount of stored product (over real demand) with ASP policy [pieces] DIRP Total amount of stored product (over real demand) with IRP policy [pieces] Finally DASP/ DIRP, DASP/ DCUM and DIRP/ DCUM are assumed to be performance indicators. Table 2 presents an example of the typical framework designed to analyze the generic scenario, particularly test values situation characterized by shape 2, levels 100/30 and duration 6 months. All parameters linked to two different policies and linked to final performance evaluation are shown.
k (peak )
k(end )
low value duration
Consequently, t is explained by the following:
t
high value
t
d
n
K(peak) K(end )
Figure 1: ASP and IRP policies
SEASONAL DEMAND SPECIFICATIONS AND FACTORIAL ANALYSIS Through the definition “seasonal” we consider a demand with a cyclic profile usually characterized by 2 different levels. But “seasonality” can be very different in terms of shape, absolute value and time duration of levels.
t
-3
-2
-1
1 100
2 100/30 6
2 100
d
3 100
4 30
5 30
6 30
7 30
8 30
9 30
10 100
11 100
12 100
780
DCUM
65 [pz/period] d 36,6 [pz/period] d / d 0,6
Anticipatory stock policy - ASP 65 [pz/period] Δd 105 [pz/period] Δt 2 [periods]
d
Increased ratio policy - IRP dinc 100 [pz/period] k(end) 8 [period] stock level ASM stock level IRP
65
DASP/ DIRP
1,11
DASP/ DCUM
2,00
DIRP/ DCUM
2,22
130
95
60
25
60
95
130
165
200
235
200
100
0
1560 DASP
0
0
0
70
140
210
280
350
320
220
120
20
1730
DIRP
After the demand values setting framework automatically
Duration is not important: performances are not influenced by this factor. IRP policy has a bell-shaped curve with minimum rate for external values of duration (2 and 8 periods). This remark applies to all levels (100/30; 80/30; 60/30); for increasing duration gaps between curves tend to increase, as does the DIRP/DCUM rate
defines ASP and IRP fundamental parameters (e.g d , t), and works out cumulative demands DASP and DIRP. Lastly, platform shows an evaluation of ratios D ASP/DIRP, DASP/ DCUM and DIRP/ DCUM . 5 TEST RESULTS AND FACTORIAL ANALYSIS The performance of the two proposed policies was evaluated for all 24 simulated scenarios. Before the explanation of results, there seems to be an interesting observation: the first policy provides a production advance and a corresponding anticipated stop; the second strategy starts at the same time of demand but with an increased ratio. Consequently, IRP also anticipates the stop. As a result of the application of these techniques a condition is required: companies may re-direct production capacity. In the case of ASP policy companies can use plants for other products, in the case of IRP policy companies must have possibility to increase production rate. The last condition could be met thanks to the outsourcing of production capacity. In this context IRP policy allows the maximum economic cost of outsourcing policy to be evaluated (compared to the ASP policy). The Anticipatory Stock Policy cost (in terms of number of stocked pieces) is a multiple of the real demand: this is a direct effect of the production planning based on complete time horizon periods.
Shape 1 analysis Interaction Plot - Data Means for DASP/ DIRP 30 0/ 10
0 /3 60
0 /3 80
2
4
6
8 3,5
Levels 80/30 2,5 60/30
1,5
100/30
3,5
Duration 8 2,5 6 4 1,5
2
Figure 3: shape 1 – Interactions plot for DASP/DIRP
Table 5: results of different scenarios test A B C D E F G H I L M N O P Q R S T U V Z X Y W
Shape 1 1 1 1 1 1 1 1 1 1 1 1 2 2 2 2 2 2 2 2 2 2 2 2
Levels 100/30 80/30 60/30 100/30 80/30 60/30 100/30 80/30 60/30 100/30 80/30 60/30 100/30 100/60 100/80 100/30 100/60 100/80 100/30 100/60 100/80 100/30 100/60 100/80
Duration 2 2 2 4 4 4 6 6 6 8 8 8 2 2 2 4 4 4 6 6 6 8 8 8
D CUM 500 460 420 640 560 480 780 660 540 920 760 600 1060 1120 1160 920 1040 1120 780 960 1080 640 880 1040
Table 3 shows the results of the evaluation of 24 different scenarios. An ANOVA approach based on the analysis of the whole set of system configurations permits some interesting observations. Interaction plots are an excellent method to support this analysis. Figure 3 reveals that the IRP model is better than ASP model in terms of stocked pieces. In particular, D ASP/DIRP is always greater than one. Greatest values of this ratio correspond to the superior value of duration (8 months), and secondly to major differences between levels (100/30 and 80/30). Figure 4 shows that advance in production for the analyzed demand curves is constant as is the DASP/DCUM ratio: common value is always 2 except for scenarios with levels 60/30, in these cases value is 1.
D ASP 1000 920 420 1280 1120 480 1560 1320 540 1840 1520 600 1060 1120 1160 1840 1040 1120 1560 960 1080 1280 880 1040
D IRP 500 420 240 715 595 345 833,3 586,7 340 642 450 312 810 520 260 1520 940 520 1730 1260 680 2140 1480 940
D ASP / D IRP 2,00 2,19 1,75 1,79 1,88 1,39 1,87 2,25 1,59 2,87 3,38 1,92 1,31 2,15 4,46 1,21 1,11 2,15 0,90 0,76 1,59 0,60 0,59 1,11 30 0/ 10
D ASP / D CUM 2,00 2,00 1,00 2,00 2,00 1,00 2,00 2,00 1,00 2,00 2,00 1,00 1,00 1,00 1,00 2,00 1,00 1,00 2,00 1,00 1,00 2,00 1,00 1,00
D IRP / D CUM 1,00 0,91 0,57 1,12 1,06 0,72 1,07 0,89 0,63 0,70 0,59 0,52 0,76 0,46 0,22 1,65 0,90 0,46 2,22 1,31 0,63 3,34 1,68 0,90
Interaction Plot - Data Means for DASP/ DCUM 0 /3 60
0 /3 80
2
4
6
8
2,0
Levels 80/30 1,5 60/30
100/30
1,0 2,0
Duration 8 6
1,5
4 2
Figure 4 - Shape 1 – Interactions plot for DASP/DCUM
1,0
19th International Conference on Production Research Shape 1- interactions plot for DIRP/ DCUM 30 0/ 10
0 /3 60
0 /3 80
2
4
6
8
Levels 1,00 80/30
60/30
0,75
100/30
0,50
Duration
1,00
8 6 0,75 4 2
0,50
Figure 5: shape 1 – Interactions plot for DIRP/DCUM Shape 2 analysis Interaction Plot - Data Means for DASP/ DIRP 30 0/ 10
60 0/ 10
80 0/ 10
2
4
6
When only the “depth of seasonality” is varied ASP has a constant performance in all scenarios except for the tests based on level value 100/30: for duration 2 months DASP/DCUM is 1, otherwise it goes to 2, which is the typical value for all others scenarios. Figure 8 shows that for constant duration the IRP presents storage costs that directly follow the depth, so if it increases, costs also increase. This effect is amplified for long duration value (e.g. 6 and 8 periods). Some final observations: • In all evaluated policies the storage costs increase when duration increases. The ASP model is based on an even higher number of stocked pieces than real consumption, while in IRP strategy this factor floats between 0.2 and 3 in agreement with different demand curves. • In terms of storage costs the ASP model is only suitable when demand curve assumes specific characteristics: shape 2, very different levels (100/30 and 100/60) (100/30 and 100/60) and high duration (6 and 8 periods). For other “seasonality”, IRP model has lower costs (between 90% and 25%) than ASP model.
8
Levels
4,0
Interaction Plot - Data Means for DIRP/ DCUM
30 0/ 10
60 0/ 10
80 0/ 10
2
4
6
8
100/80
3,0
Levels 2,5
100/80
100/60
1,0
1,5
100/60
100/30
Duration
4,0
100/30 0,0
8
Duration 2,5
6 4
6
1,5
1,0 2
4
Figure 6: shape 2 – Interactions plot for DASP/DIRP
2 0,0
Figure 6 shows that for shape 2 the convenience between the proposed models depends on demand curve. In conclusion, in shape 2 the IRP model is superior for 100/80 demand curves; this model is interesting for 100/60 and 100/30 curves for low duration (2 and 4 periods). In these two latter conditions for high duration (6 and 8 periods), ASP is cheaper. 30 0/ 10
Interaction Plot - Data Means for DASP/ DCUM 60 0/ 10
80 0/ 10
2
3,0
8
4
6
8
2,0
Levels 100/80 1,5
Figure 8: shape 2 – Interactions plot for DIRP/DCUM In order to introduce a supporting decision instrument, “convenience tables” has been designed. These tables represent a robust operating instrument that makes a rapid and effective choice possible between two different policies so as to manage seasonal demand of products in accordance with their demand profile. The generic cell identifies an operating configuration and the best policy using “*” if performance superiority measured by DWORST/DBEST (WORST and BEST are ASP and IRP in agreement with single instance best and worst policy) is less then 1.50. The label “**” identifies ratios between 1.50 and 2, label identifies “***” ratios greater than 2. Table 6: operating convenience tables – shape 1
100/60
Shape 1 100/30
1,0 2,0
Levels Duration
8 6
Duration 100/30
80/30
60/30
2
IRP **
IRP ***
IRP **
2
4
IRP **
IRP **
IRP *
4
6
IRP **
IRP ***
IRP **
6
8
IRP ***
IRP ***
IRP **
8
Duration 1,5
4 2
Figure 7: shape 2 – Interactions plot for DASP/DCUM
1,0
Table 7: operating convenience tables – shape 1 Shape 2 Levels Duration 60/30
100/30
100/60
100/80
IRP **
2
IRP *
IRP ***
IRP ***
IRP *
4
IRP *
IRP *
IRP ***
IRP **
6
ASP *
ASP *
IRP **
IRP **
8
ASP **
ASP **
IRP *
6 CONCLUSIONS Nowadays the production planning problem under seasonal demand is a very critical issue because on the one hand it is very frequent, and on the other it has a considerable impact on company costs. In recent years different theoretical approaches have been developed, frequently using very sophisticated solutions, but they often require great resources of calculus and provide very pressing constraints which are never in line with real company operating needs. Consequently, at the time of writing, the larger part of manufacturing and distribution companies only implement stock policies based on their own experience: the principal result is a large storage cost with unexpected and expensive stock-out cost. The authors have developed research centered on the study and comparison of the performance of 2 simple policies called Anticipatory stock policy - (ASP) and Increased ratio policy - (IRP), in response to different demand characteristics (seasonal profiles). These 2 policies proved very easy to implement. This paper discusses the performance evaluation of policies in the “no stock-out condition” under 24 different seasonal demand profiles. The no stock-out condition is very close to traditional company targets, and to firms focused on customer requirements, and tends to avoid stock-outs. For this reason a simplified costs function is considered, with terms only linked to storage costs. The results of multi-scenario analysis and a factorial analysis were interesting for both strategies. Generally speaking, in terms of storage costs, the Increased ratio policy performs best. Anticipatory stock policy - (ASP) is suitable in several conditions e.g. when many periods are based on low demand values and large difference between low and high demand levels. Besides this general conclusions, more detailed interesting observations can be obtained (carried out in results section). In conclusion, a convenience table is presented in order to guide the choice of the best operating policy in a rapid and robust manner. The introduction of stock-out possibility and the consequent evaluation of the performance of two proposed policies were achieved and remain the object of further studies. The principal problem now becomes how to determine the optimal level of production in relation to a trade-off between storage costs and stock-out costs.
7 REFERENCES [1] Fair, R., 1989, The production smoothing model is alive and well. Journal of Monetary Economics, 24 (3), 353 - 370. [2] Krane, S.D., and Braun,S.N., 1991, Production smoothing evidence from physical product data. Journal of Political Economy, 99 (3), 558 - 581. [3] Karlin, S., 1960, Optimal policy for dynamic inventory process with stochastic demands subject to seasonal variations. SIAM Journal on Applied Mathematics, 8, 611 - 629. [4] Zipkin, P. H., 1989, Critical number policies for inventory models with periodic data. Management Science, 35 (1), 71 - 80. [5] Federgruen, A., and Zipkin, P. H., 1986a, An inventory model with limited production capacity and uncertain demands, I: The average cost criterion. Mathematics of Operations Research, 11 (2), 193 207. [6] Federgruen, A., and Zipkin, P. H., 1986b, An inventory model with limited production capacity and uncertain demands, II: The discounted cost criterion. Mathematics of Operations Research, 11 (2), 208 216. [7] Tayur, S., 1993, Computing the optimal policy for capacitated inventory models. Communications in Statistics and Stochastic Models, 9 (4), 585 - 598. [8] Kapuscinski, R., and Tayur, S., 1995, A capacitated production-inventory model with periodic demand. Working paper, Carnegie Mellon University, Pittsburgh, PA. [9] Evans, R., 1967, Inventory control of a multiproduct system with a limited production resource. Naval Research Logistics Quarterly, 14, 173 -184. [10] Ciarallo, F. W., and Akella, R., 1993, Planning Production of Multiple Items with Uncertain Capacity and Uncertain Demand. Working paper, University of Arizona, Tuscon, AZ. [11] Ciarallo, F. W., Akella, R., and Morton, T. E., 1994, A periodic review, production planning model with uncertain capacity and uncertain demand and optimality of extended myopic policies. Management Science, 40 (3), 320 - 332. [12] El Agizy, M., 1967, Two-stage programming under uncertainty with discrete distribution function. Operations Research, 15 (1), 55 - 70. [13] Hodges, S., and Moore, P., 1970, The product-mix problem under stochastic seasonal demand. Management Science, 17 (2), B107 - 114. [14] Metters, R., 1993, Production Scheduling with Stochastic Seasonal Demand, Capacitated Production and Linear Costs. Unpublished PhD t hesis, University of North Carolina, Chapel Hill, NC. [15] Metters, R., 1997, Production planning with stochastic seasonal demand and capacitated production. IIE Transactions 29, 1017 – 1029. [16] Bush, C. M., and Cooper, W. D., 1988, Inventory level decision support. Production and Inventory Management Journal, 29 (1), 16 - 20. [17] Buxey, G., 1993, Production planning and scheduling for seasonal demand. International Journal of Operations and Production Management, 13 (7), 4 21. [18] Metters, R., 1998, General rules for production planning with seasonal demand. International Journal of Production Research, 36 (5), 1387 – 1399.