OpenSees Beam on Nonlinear Winkler Foundation Modeling of Pile Groups in Liquefied and Laterally Spreading Ground in Centrifuge Tests Scott J. Brandenberg and Ross W. Boulanger ABSTRACT Beam on Nonlinear Winkler Foundation (BNWF) analyses of pile groups in liquefied and laterally spreading ground were performed using the Open Source for Earthquake Engineering Simulation (OpenSees). Two new commands, PySimple1Gen and TzSimple1Gen, were implemented into OpenSees to generate properties for PySimple1 and TzSimple1 materials. A new problem-type was developed for GiD, the finite element pre- and post-processor, to help define finite element meshes for BNWF analyses. Piles were modeled using elastic beam-column elements, and soil-pile interaction was modeled using p-y, t-z and q-z elements. The free-ends of the p-y elements were assigned displacements to simulate the lateral spreading of a liquefied soil profile. Results of the analyses were compared with data measured during dynamic model tests on a 9-m-radius centrifuge, and parameters that most significantly influence analysis results are discussed.
Scott J. Brandenberg, Graduate Student, University of California, Davis, One Shields Avenue, Davis, CA, 95616, USA Ross W. Boulanger, Professor, University of California, Davis, One Shields Avenue, Davis, CA, 95616, USA
INTRODUCTION Loads imposed on pile foundations by laterally spreading ground during earthquakes have been a major cause of past damages and are consequently a major concern in design practice. The cost can be very large to construct a new pile foundation, or retrofit an existing pile foundation, to resist the expected loads from laterally spreading ground, especially when a relatively strong surface layer is spreading over an underlying liquefied layer. However, dynamic interaction between piles and laterally spreading soil is not clearly understood, and design methods could benefit from validation with case studies and model tests. One such design method, the Beam on Nonlinear Winkler Foundation (BNWF) approach, in which p-y, t-z and q-z elements are used to model soil-pile interaction, is commonly used in design practice. Analysis of pile groups in lateral spreads using the BNWF method can be performed in a number of different numerical modeling platforms. However, the emergence of performance-based earthquake engineering design requires multidisciplinary collaboration, which is complicated by incompatibility of calculation tools used in different disciplines. The Open Source for Earthquake Engineering Simulation (OpenSees), developed by the Pacific Earthquake Engineering Research Center (PEER center) is a powerful tool for numerical modeling that is tailored to performancebased earthquake engineering design. Soil-pile interaction materials to model p-y, t-z and q-z behavior were implemented into OpenSees (Boulanger, 2003), which enables static and dynamic BNWF modeling of pile foundations in liquefied ground using OpenSees. This paper demonstrates the application of BNWF analysis methods to pile foundations in liquefaction-induced lateral spreads, and presents two new OpenSees commands developed to generate material properties for PySimple1 and TzSimple1 materials. First, the new PySimple1Gen and TzSimple1Gen commands and calculation tools are presented. Second, the centrifuge model testing program is described, and sample data showing various components of the soil-pile and soilpile cap interaction are presented and discussed. Finally, example analyses of a pile group foundation from one of the centrifuge tests is presented, and compared with the centrifuge test data to provide a comparison between the loading mechanics assumed in the BNWF analysis and those measured in the centrifuge test. DEVELOPMENT OF NEW OPENSEES COMMANDS AND MESH GENERATION TOOLS Two new commands, PySimple1Gen and TzSimple1Gen, have been developed to generate the material properties for PySimple1 and TzSimple1 materials in OpenSees. Typically, p-y and t-z elements are closely-spaced along a pile, and each requires its own unique set of input parameters (e.g. material capacity) to accurately model the stress-dependent soil-pile interaction. Generating the large number of material properties that might be required for a BNWF analysis by hand can be tedious, time-consuming, and potentially error-prone. Using the PySimple1Gen and TzSimple1Gen commands automates the material generation to help reduce the time to set up an analysis and to reduce the potential for errors. The commands require user input of certain parts of the finite element mesh and some additional input about the soil and pile properties, and generate an output file containing PySimple1 or TzSimple1 materials that can be sourced directly into OpenSees. The prototype for using the commands in OpenSees is: PySimple1Gen “File1”? “File2”? “File3”? “File4”? “File5”? TzSimple1Gen “File1”? “File2”? “File3”? “File4”? “File5”?
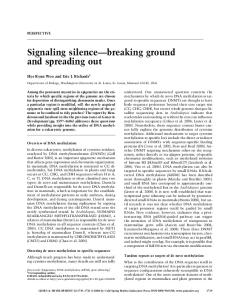
The commands receive either five or six arguments, all of which are file names. File1 through File4 are input files, and File5 and File6 are output files that are written when the command is executed. File1 contains information about the soil and pile properties, and optional information about the load or displacement patterns. File2 contains the nodes. File3 contains the zeroLength elements to which PySimple1 or TzSimple1 materials will be assigned. File4 contains the pile elements. File5, which is written when the command is executed, contains the PySimple1 or TzSimple1 materials. File6, which is written when the command is executed, is optional and contains load or displacement patterns to apply to the pile nodes or free-ends of the zeroLength elements, respectively. Complete documentation of the commands can be found at the OpenSees website at http://opensees.berkeley.edu. The finite element meshes were generated using the pre- and post-processor GiD. An evaluation version can be downloaded free from http://gid.cimne.upc.es. GiD was customized for BNWF pushover analyses by defining a problem-type called OpenSees_pyPushover.gid, which outputs the various components of an OpenSees finite element analysis, including nodes, elements, constraints, and recorders, as tcl files that can be sourced directly into OpenSees. The problem type is currently still under development, and will eventually be made publicly available. CENTRIFUGE MODEL TESTING Model Configurations The centrifuge tests were performed on the 9-m radius centrifuge at the University of California at Davis. All tests were performed in a flexible shear beam container with centrifugal accelerations ranging from 36 to 57 g. Results are presented in prototype units. A schematic cross-section of one centrifuge model is shown in Figure 1. The soil profile consisted of a nonliquefied crust overlying loose sand (Dr ≈ 21-35%) overlying dense sand (Dr ≈ 69-83%). The crust layer sloped gently toward a river channel carved in the crust at one end of the model. The nonliquefiable crust consisted of reconstituted San Francisco Bay mud (liquid limit ≈ 88, plasticity index ≈ 48) that was mechanically consolidated with a large hydraulic press, and subsequently carved to the desired slope. The sand layers beneath the crust consisted of uniformly graded Nevada Sand (Cu = 1.5, D50 = 0.15 mm). A thin layer of coarse Monterey sand was placed on the surface of the Bay mud for some of the models. The six-pile group for the model in Figure 1 consisted of 1.17-m diameter piles with a large pile cap embedded in the nonliquefied crust. The pile cap provided fixed-head restraint at the connection with the piles. Some tests contained a single-degree-of-freedom superstructure fixed to the top of the pile cap, and superstructures with various natural periods were tested. A pile group without a superstructure will be discussed in this paper. Each test was shaken with a number of simulated earthquakes conducted in series with sufficient time between shakes to allow dissipation of excess pore pressures. The simulated earthquakes were scaled versions of the acceleration recordings either from Port Island (83-m depth, north-south direction) during the Kobe earthquake, or from the University of California, Santa Cruz (UCSC/Lick Lab, Channel 1) during the Loma Prieta earthquake. These earthquake motions were chosen because they contain different frequency content and shaking characteristics. Generally, the shake sequence applied to the models was a small event (amax,base = 0.1g to 0.2g) followed by a medium event (amax,base= 0.3g to 0.5g) followed by one or more large events (amax,base= 0.7g to 1.0g).
Pore pressure transducer
0
200 mm - Model
Accelerometer
0
11.4 m - Prototype
Displacement Transducer
2x3 Pile Group
Monterey Sand Clay
Loose Sand
Dense Sand
Figure 1: Schematic model layout of centrifuge test SJB03.
Details for these centrifuge experiments are summarized in a series of data reports available from the web site for the Center for Geotechnical Modeling at http://cgm.engr.ucdavis.edu (e.g. Brandenberg et al., 2003). These data reports include detailed explanations of model construction, data acquisition procedures, data organizational structure, post-earthquake model dissection measurements, and all instrument recordings. Sample Test Data The dynamic responses of the centrifuge models were well defined by about 100 instruments in each model, including accelerometers, pore water pressure transducers, displacement transducers, and strain gauge bridges on the piles, as schematically illustrated in Figure 1. In addition, time series of various load components were obtained by processing the raw instrumentation recordings. For example, dynamic subgrade reaction loads were estimated by numerically double differentiating the moment distributions with depth along the piles according to elastic beam theory. Details of data processing methods are presented by Boulanger et al. (2003). Time series are shown in Figure 2 for various components of the dynamic response from model SJB03. This particular set of time series is for a large Kobe earthquake event (amax,base = 0.67 g), which was preceded by a small Santa Cruz event (amax,base = 0.13 g), a medium Santa Cruz event (amax,base = 0.35 g) and a large Santa Cruz event (amax,base = 0.67 g). These time series illustrate a number of important features of dynamic response: •
•
ru near the center of the liquefiable sand layer (at 6.8-m depth) reached a value near 1 at about time = 8 s. Later in shaking, ru transiently dropped to smaller values near 0.5, which were accompanied by transient increases in effective stress, and hence increases in strength and stiffness of the sand. The critical cycle that produced the peak bending moment (-8838 kN⋅m) and peak lateral load from the clay crust (6384 kN) occurred at about time = 13 s, when ru near the center of the
liquefiable sand was at a local minimum of 0.5 in spite of having been near 1 previously, and returning to near 1 later during strong shaking. • The middle of the liquefiable sand layer (6.7 m below the ground surface) provided a large upslope resisting load (-400 kN/m) to the piles during the critical loading cycle. • The peak lateral load from the crust occurred at about time = 13 s, but the peak relative displacement between the pile cap and the free-field crust occurred near the end of shaking. Certain aspects of the loading mechanics observed during the centrifuge tests are different from assumptions that are commonly made in design practice. For example, the liquefiable sand provided a large up-slope resisting load during the critical loading cycles, which is contrary to the common assumption that liquefied sand imposes a small down-slope loading on the piles in the direction of soil displacement. As an example, the Japan Road Association (2002) suggests using p = 0.3·σv·b, where p is the lateral load exerted by the liquefied sand per unit depth. Near the center of the liquefiable sand in the centrifuge tests, 0.3·σv·b = 41 kN/m, which is an order of magnitude
6000
Moment in south 0 east pile 2.7 m below ground -6000 surface (kN-m)
∆+
-12000 10000
Lateral load 5000 from clay 0 crust (kN) -5000 6000
p+
Pile cap 3000 inertia 0 (kN) -3000 -6000 200
p on south 0 east pile 6.7 m below ground -200 surface (kN/m) -400 -600
V+ M+
1
ru at 6.8 m below ground 0.5 surface 0
-0.5 4 3 Displacement 2 (m) 1 0 -1 1
Crust Pile Cap
Base 0.5 acceleration 0 (g) -0.5 -1
0
10
20
30
40
50
Time (s)
Figure 2: Selected time series from centrifuge test SJB03 during a large Kobe motion.
different from and opposite in sign from the measured p-value during the critical loading cycle (p = -400 kN/m). In addition, the peak lateral load from the clay crust occurred during the time of strong shaking, even though the greatest relative cap-soil displacement occurred toward the end of shaking. This observation is important to the development of guidelines on how to combine kinematic and inertial load components in simplified design procedures. BEAM ON NONLINEAR WINKLER FOUNDATION ANALYSES OF SIX-PILE GROUP FROM CENTRIFUGE TEST SJB03 Three BNWF analyses were performed to demonstrate the influence of several design assumptions on the analysis results. The analyses utilized the peak measured crust load (6384 kN) to develop properties for the p-y elements, and the measured pile cap inertia (5295 kN) as an applied force on the pile cap. Analysis 1 utilized the measured soil displacement profile and excess pore pressure (ru) distribution, while Analysis 2a and Analysis 2b used soil displacement profiles and ru values that might reasonably be used in design. Using measured data in the analyses does not replicate the assumptions that must be made in real design situations. The measured quantities would not be known for designing real pile foundations, and the designer would need to predict them. While future work will focus on recommendations for making such predictions, the measured data are used in these analyses for two reasons: 1. 2.
To demonstrate the accuracy and limitations of an analysis in which the input parameters closely match the measurements. To isolate the influence of some of the various assumptions commonly made in design practice.
Pile Group Geometry The analyses were two-dimensional, so the six-pile group was modeled as a three-pile group, and the stiffness of the piles, and stiffness and capacity of the p-y, t-z and q-z elements were doubled such that the three-pile group simulates a six-pile group. The geometries of the pile groups are summarized in Table 1. The model piles were made from aluminum with a Young’s modulus of 68.9 GPa and a yield stress of 216 MPa in uniaxial tension. Table 1. Geometries of the pile foundation from centrifuge test SJB03. Pile length (m)
Pile diameter (m)
Wall thickness (m)
23.5
1.17
0.051
Center-toCenter Pile Spacing (m) 4.6
Pile Cap Height (m)
Pile Cap Width (m)
Pile Cap Length (m)
2.2
9.2
14.3
Soil Displacement Profiles For Analysis 1, the soil displacement profile that was recorded at the time that the peak bending moment occurred in the piles was used as input. During the test, relatively small displacements were observed in the loose sand layer, but a large displacement discontinuity occurred at the interface between the crust and liquefied sand resulting in large crust displacements. The discontinuity was likely caused by weakening of the top of the loose sand layer due to upwardseeping pore water becoming trapped beneath the low-permeability clay crust. Such discontinuities have also been observed in shake table tests (Kokusho and Kojima, 2002) and centrifuge tests (Malvick et al., 2004) designed to study strain localization. While such displacement discontinuities have been observed, a reliable method for predicting whether they will occur and for predicting the magnitude of the discontinuity has not emerged. Hence, a designer might use a soil displacement profile without a displacement discontinuity for designing pile foundations. Furthermore, the strains observed in the loose sand layer are likely smaller than would be predicted for design. Hence, the soil profiles in Analysis 2a and Analysis 2b have no displacement discontinuity at the sand / clay interface, and were assigned a large uniform strain in the liquefied sand such that the ground surface displacement is the same as in Analysis 1 (2.5 m). Strain in the dense sand was assumed to be zero for Analysis 2a since that layer did not liquefy, though some small strains in the dense sand were measured, and are included in Analysis 1. Some strain was applied in the dense sand layer in Analysis 2b to observe the influence of deep strains on the response of the pile group. Excess Pore Pressures The excess pore pressures that were measured at the time that the peak bending moments were observed in the piles had transiently dropped to small values near 0.5 in the loose sand layer and about 0.0 in the dense sand layer. These transient drops are caused by the sand changing from incrementally contractive to incrementally dilative, which is manifested as a drop in excess pore pressure and increase in effective stress during undrained loading. For Analysis 1, the measured ru values were used. However, the small ru values that were observed during the critical cycles in the centrifuge test contrast with the typical design assumption that liquefied sand exerts a small downslope pressure as it spreads past a pile. Hence, for Analysis 2a and Analysis 2b, ru in the loose sand was assumed to be 1.0, and ru in the dense sand was assumed to be 0.6, which correspond to assumptions that might be made in design. P-y Elements on Pile Cap The capacities of the p-y elements on the pile cap were estimated based on calculations of passive earth pressure on the up-slope face of the cap plus friction between the crust and the pile cap. A coulomb-based analysis that takes into account soil layering was used to estimate the passive pressure. The friction force between the sides of the cap and the clay was calculated using the equation Fclay = α cu Asides_clay, where α is the adhesion coefficient, cu is the undrained shear strength, and Asides_clay was the contact area between the clay and the pile cap. The friction force between the sides of the pile cap and the Monterey sand was calculated using the equation Fsand = ½ γ KoH1 tan(δ) Asides_sand where Ko, the coefficient of earth pressure at rest, was taken as 1-sin(φ′), δ is the interface friction angle, H1 is the depth to the bottom of the Monterey sand, and Asides_sand is the contact area between the Monterey sand and the pile cap. Friction between the base
of the pile cap and the clay was calculated using the equation Fbase = α Rbase cu Abase where α is the adhesion coefficient, Rbase is an empirical reduction factor to account for loss of contact along some portion of the base of the cap, cu is the undrained shear strength and Abase is the area of the base of the pile cap. The properties for the clay were cu = 44 kPa, γ = 16 kN/m3 and α = 0.5, and properties for the Monterey sand were estimated to be γ = 17 kN/m3, φ′ = 36o, δ = 22o, and c′ = 0. By setting Rbase = 0.05, the predicted lateral load closely matches the peak measured lateral crust load, hence Rbase was taken as 0.05 for estimating p-y capacities on the pile cap for the BNWF analyses. Backcalculation of the various components of loading imposed by the laterally spreading crust was presented in detail by Boulanger et al. (2003). Observations of soil-pile cap interaction and ground deformation patterns are presented by Brandenberg et al. (2004). P-y Elements on Piles The capacities of the p-y elements on the portions of the piles in contact with the clay crust were calculated using Matlock’s (1970) bearing factors for soft clay. The drained capacities of the p-y elements in contact with the sand were calculated using the API (1993) sand equations, and were subsequently softened to account for the influence of liquefaction. The fully-liquefied capacities of the p-y elements were calculated by assuming a nominal residual strength for the sand (S), and using the equation pu = 9 S b to estimate the ultimate capacity. The capacities for p-y elements for sand with intermediate ru values were linearly interpolated between the drained capacity (assumed the same as the capacity with ru = 0) and the undrained capacity with ru = 1, as described by Dobry et al. (1995). This method provides a convenient means of assigning a nominal capacity to the p-y elements in fully-liquefied sand, and for estimating capacities for intermediate ru values. The p-y elements used in the BNWF analyses were in units of force, and represent the integral of the calculated p-y capacities in force per unit length over the tributary length along the pile. T-z Elements on Pile Cap The t-z elements on the pile cap represent vertical friction loads at the interface between the pile cap and the crust, and the capacities of the t-z elements were calculated based on the interface friction stresses times the tributary area. The interface friction stresses were estimated using the same properties as for estimating the horizontal friction component for the p-y elements on the pile cap, as described earlier. T-z Elements on Piles The capacities of the t-z elements on the pile segments in contact with the clay were estimated using the same equation that was used to estimate friction stresses between the pile cap and the clay. Friction stress transfer between piles and liquefied sand has not been clearly characterized from test observations, and is not well understood. As an approximation, the t-z capacities were assumed to degrade with ru from the drained capacity (ru = 0) to a nominal undrained capacity with ru = 1, in the same manner as for the p-y elements.
Q-z Elements at Pile Tips The influence of increased excess pore pressure on the end-bearing resistance of piles in sand is not well understood. Again, for a given ru value the end-bearing resistance was interpolated between the ru = 0 condition (assumed the same as drained) and ru = 1 condition. The end-bearing resistance for sand with ru = 0 was estimated using the bearing capacity factors given by Meyerhof (1976). The end bearing resistance in sand with ru = 1 was represented using the equation Qu = 9 S Atip, where 9 is the bearing factor for φ = 0 material, S is the mobilized undrained shear strength for liquefied sand, and Atip is the cross-sectional tip area. Results of BNWF Analysis 1 and Analysis 2a Soil displacement, pile displacement, bending moment and subgrade reaction (p) from Analysis 1 and Analysis 2a are compared with the centrifuge test data measured at the time that the peak bending moment occurred in the piles in Figure 3. The pile displacement, moment and p distributions are for an up-slope pile in the six-pile group, as shown in the schematic to the left of the data plots. The peak bending moment occurred during the large Kobe motion, which was preceded by a small, medium and large Santa Cruz motion. Residual pile displacements existed after each motion. However, pile groups are typically designed for a single earthquake motion rather than a series of motions. Hence, two measured pile displacements are plotted in Figure 3 for comparison purposes. The total pile displacement includes the residual displacement that existed prior to the large Kobe motion, and the incremental displacement reflects displacements that
∆+
0
Incremental
Total
Depth (m)
p+
10
V+ M+
20
30
0 1 2 3 Soil Displacement (m)
Measured Data Analysis 1 Analysis 2a -0.2 0 0.2 0.4 0.6 Pile Displacement (m)
-10 -5 0 5 10 3 Moment (10 kN-m)
-2000 0 2000 p (kN/m)
Figure 3: Results of BNWF Analysis 1 and Analysis 2a, and centrifuge data measured at the same time that the peak bending moment occurred.
occurred only during the large Kobe motion. Taken at the depth where the peak bending moment was measured from the centrifuge test data, the bending moment from Analysis 1 was -10350 kN⋅m, and from analysis 2a was -10260 kN⋅m, which have 17% larger magnitude and 16% larger magnitude than the peak measured bending moment (-8838 kN⋅m), respectively. The reasonable predictions of bending moment result from the close match between the applied crust load and the peak measured crust load, and demonstrate that the properties of the sand layers do not contribute significantly to the peak bending moments for Analysis 1 and Analysis 2a. The peak pile head displacement from Analysis 1 was 0.46 m, and from Analysis 2 was 0.31 m, which are 10% larger and 36% smaller than the measured total pile head displacement (0.42 m), respectively. Compared with the incremental measured pile head displacement (0.25 m), the head displacement from Analysis 1 is 84% larger and from Analysis 2 is 28% larger. Analysis 1 overestimates the pile head displacements primarily because the displacements in the dense sand layer were over-predicted. Two counter-balancing errors contribute to the reasonable prediction of pile head displacement for Analysis 2a. The displacements deep in the soil profile are under-predicted due to the assumption of zero strain in the dense sand layer, which contrasts with the transient strains that were measured in the dense sand in the centrifuge test. The displacements in the loose sand layer are over-predicted due to the small down-slope pressure exerted on the pile in the loose sand layer in Analysis 2a, which contrasts with the large up-slope resisting pressure that was observed in the loose sand layer in the centrifuge test. Results of BNWF Analysis 2a and Analysis 2b Results of Analysis 2a and Analysis 2b are compared with the centrifuge test data measured at the time that the peak bending moment occurred in the pile in Figure 4. Taken at the depth where the peak bending moment was measured from the centrifuge test data, the bending moment from Analysis 2b was -11460 kN⋅m, which is about 30% larger in magnitude than the peak measured bending moment. The predicted pile head displacement was 0.65 m, which is 55% larger than the measured total pile head displacement, and more than double the pile head displacement predicted in Analysis 2a. The reason for the increase in pile displacement is the strain that was applied in the dense sand for Analysis 2b.
∆+
0
Incremental
Total
Depth (m)
p+
10
V+ M+
20
30
0 1 2 3 Soil Displacement (m)
Measured Data Analysis 2a Analysis 2b -0.2 0 0.2 0.4 0.6 0.8 Pile Displacement (m)
-10 -5 0 5 10 Moment (103 kN-m)
-2000 0 2000 p (kN/m)
Figure 4: Results of BNWF Analysis 2a and Analysis 2b, and centrifuge data measured at the same time that the peak bending moment occurred.
CONCLUSIONS Results of centrifuge tests on pile groups in liquefied and laterally spreading ground were compared with pseudo-static Beam on Nonlinear Winkler Foundation (BNWF) analyses performed in the Open Source for Earthquake Engineering Simulation (OpenSees). The analyses utilized two new OpenSees commands, PySimple1Gen and TzSimple1Gen, to generate material properties for the p-y and t-z elements, and the finite element meshes were constructed using GiD. These calculation tools help automate BNWF analyses, and can be a valuable tool for multi-disciplinary performance-based earthquake engineering design since OpenSees contains a good library of geotechnical and structural material models. The BNWF analyses reasonably predicted the measured peak bending moments because the loads from the crust and the inertia of the cap applied in the analyses closely matched the peak measured loads. Hence, predicting loads from a nonliquefied laterally spreading crust can be a firstorder effect for accurately predicting bending moments. Note that the pile cap inertia was 5295 kN, which was nearly equal to the load exerted on the pile group by the laterally spreading crust. Neglecting the cap inertia for the analyses would have resulted in a significant under-prediction of bending moments. Pile cap displacements were predicted from about 36% smaller to about 55% larger than the measured total pile cap displacement, and applying some small strain in the dense sand layer resulted in more conservative predictions of pile cap displacement.
ACKNOWLEDGEMENTS Funding was provided by Caltrans under contract numbers 59A0162 and 59A0392 and by the Pacific Earthquake Engineering Research (PEER) Center, through the Earthquake Engineering Research Centers Program of the National Science Foundation, under contract 2312001. The contents of this paper do not necessarily represent a policy of either agency or endorsement by the state or federal government. Recent upgrades to the centrifuge have been funded by NSF award CMS-0086566 through the George E. Brown, Jr. Network for Earthquake Engineering Simulation (NEES). Center for Geotechnical Modeling (CGM) director, Bruce Kutter, facility manager, Dan Wilson, and staff Tom Kohnke, Tom Coker and Chad Justice provided assistance with centrifuge modeling. UC Davis graduate students Dongdong Chang and Priyanshu Singh oversaw some of the centrifuge tests and performed some data processing. REFERENCES API, 1993. Recommended Practice for Planning, Design, and Constructing Fixed Offshore Platforms. API RP 2A WSD, 20th ed., American Petroleum Institute. Boulanger, R. W., Kutter, B. L., Brandenberg, S. J., Singh, P., and Chang, D, 2003. Pile foundations in liquefied and laterally spreading ground during earthquakes: Centrifuge experiments and analyses. Report UCD/CGM-03/01, Center for Geotechnical Modeling, Univ. of California, Davis, CA, 205 pp. Brandenberg, S. J., Boulanger, R. W., Kutter, B. L., Wilson, D. W., and Chang, D., 2004. “Load transfer between pile groups and laterally spreading ground during earthquakes.” 13th World Conference on Earthquake Engineering, Vancouver, B.C., Paper 1516. Brandenberg, S. J., Chang, D., Boulanger, R. W., and Kutter, B. L., 2003. “Behavior of piles in laterally spreading ground during earthquakes – centrifuge data report for SJB03.” Report No. UCD/CGMDR-03/03, Center for Geotechnical Modeling, Department of Civil Engineering, University of California, Davis. Dobry, R., Taboada, V, and Liu., L. (1995). “Centrifuge modeling of liquefaction effects during earthquakes.” Proc. 1st Intl. Conf. On Earthquake Geotechnical Engineering, K. Ishihara, ed., Tokyo, Japan, Vol. 3, pp. 1291-1324. JRA, 2002. Specifications for highway bridges. Japan Road Association, Preliminary English Version, prepared by Public Works Research Institute (PWRI) and Civil Engineering Research Laboratory (CRL), Japan, November. Kokusho, T., and Kojima, T. 2002. “Mechanism for postliquefaction water film generation in layered sand.” J. Geotech. Engrg., ASCE 129(2), pp 129-137. Malvick, E. J., Kutter, B. L., Boulanger, R. W., and Feigenbaum, H. P., 2004. “Post-shaking failure of sand slope in centrifuge test.” Proc., 11th SDEE and 3rd ICEGE, Berkeley, CA. Matlock, H. (1970). “Correlations of design of laterally loaded piles in soft clay.” Proc. Offshore Technology Conference, Houston, TX, Vol 1, No.1204, pp. 577-594. Meyerhof, G. G. 1976. “Bearing Capacity and Settlement of Pile Foundations,” J. Geotech. Engrg., ASCE 102(GT3), pp 197-228.