This article was downloaded by: [Mittuniversitetet] On: 17 December 2010 Access details: Access Details: [subscription number 773444283] Publisher Routledge Informa Ltd Registered in England and Wales Registered Number: 1072954 Registered office: Mortimer House, 3741 Mortimer Street, London W1T 3JH, UK
Scandinavian Journal of Hospitality and Tourism
Publication details, including instructions for authors and subscription information: http://www.informaworld.com/smpp/title~content=t713712926
Estimating International Tourism Demand for Selected Regions in Sweden and Norway with Iterative Seemingly Unrelated Regressions (ISUR) A. Khalik Salmana; Leif Arnessona; Anna Sörenssona; Ghazi Shukurb a Department of Social Sciences, Mid Sweden University, b Department of Economics and Statistics, Jönköping University and Centre of Labour Market Policy Research (CAFO), Linnaeus University, Sweden Online publication date: 13 December 2010
To cite this Article Khalik Salman, A. , Arnesson, Leif , Sörensson, Anna and Shukur, Ghazi(2010) 'Estimating
International Tourism Demand for Selected Regions in Sweden and Norway with Iterative Seemingly Unrelated Regressions (ISUR)', Scandinavian Journal of Hospitality and Tourism, 10: 4, 395 — 410 To link to this Article: DOI: 10.1080/15022250.2010.484221 URL: http://dx.doi.org/10.1080/15022250.2010.484221
PLEASE SCROLL DOWN FOR ARTICLE Full terms and conditions of use: http://www.informaworld.com/terms-and-conditions-of-access.pdf This article may be used for research, teaching and private study purposes. Any substantial or systematic reproduction, re-distribution, re-selling, loan or sub-licensing, systematic supply or distribution in any form to anyone is expressly forbidden. The publisher does not give any warranty express or implied or make any representation that the contents will be complete or accurate or up to date. The accuracy of any instructions, formulae and drug doses should be independently verified with primary sources. The publisher shall not be liable for any loss, actions, claims, proceedings, demand or costs or damages whatsoever or howsoever caused arising directly or indirectly in connection with or arising out of the use of this material.
Scandinavian Journal of Hospitality and Tourism, Vol. 10, No. 4, 395–410, 2010
Downloaded By: [Mittuniversitetet] At: 13:38 17 December 2010
Estimating International Tourism Demand for Selected Regions in Sweden and Norway with Iterative Seemingly Unrelated Regressions (ISUR) A. KHALIK SALMAN*, LEIF ARNESSON*, ANNA SÖRENSSON* & GHAZI SHUKUR** *Department of Social Sciences, Mid Sweden University, and **Department of Economics and Statistics, Jönköping University and Centre of Labour Market Policy Research (CAFO), Linnaeus University, Sweden
ABSTRACT This paper estimates the demand for tourism to Sweden and Norway from five countries: Denmark, the United Kingdom, Switzerland, Japan, and the United States. For each visiting country, and for selected regions in Sweden and Norway, we specify separate equations by including relative information. We then estimate these equations using Zellner’s Iterative Seemingly Unrelated Regressions (ISUR). The benefit of this model is that the ISUR estimators utilize the information present in the error correlation of the cross regressions (or equations) and hence are more efficient than single equation estimation methods such as ordinary least squares. Monthly time series data from January 1993 to December 2006 are used. The results show that the consumer price index, some lagged dependent variables, and several monthly dummies (representing seasonal effects) have a significant impact on the number of visitors to the SW6 region in Sweden and Tröndelag in Norway. We also find that, in at least some cases, relative prices and exchange rates have a significant effect on international tourism demand. Scandinavian 10.1080/15022250.2010.484221 SJHT_A_484221.sgm 1502-2250 Original Taylor 02010 00
[email protected] GhaziShukur 000002010 & and Article Francis (print)/1502-2269 Francis Journal of Hospitality (online) and Tourism
KEY WORDS: Tourism demand, significant factors, Iterative Seemingly Unrelated Regressions (ISUR)
Introduction The theory of demand constitutes a central topic in economics, and modern formalized economic theory has dealt with consumer demand for some time. This has led the way towards econometric applications and statistical evaluations, and their application to tourism demand is the theme of this paper. A common deficiency in many Correspondence Address: Ghazi Shukur, Department of Economics and Statistics, Jönköping University and Centre of Labour Market Policy Research (CAFO), Växjö University, Sweden. E-mail:
[email protected] 1502-2250 Print/1502-2269 Online/10/040395–16 © 2010 Taylor & Francis DOI: 10.1080/15022250.2010.484221
Downloaded By: [Mittuniversitetet] At: 13:38 17 December 2010
396 A.K. Salman et al. applied econometric studies is the absence of statistical diagnostic testing. This is important because a model is only as good as the assumptions used, and if these assumptions are incorrect then the model can be worthless. Nowadays we pay increasing attention to model selection and specification procedures, especially in modeling dynamic relationships, with numerous test statistics and diagnostic checks suggested as tools in model selection strategies. During the past decade or so, the tourism literature includes a number of different econometric models used to identify the relationships between tourist arrivals in a particular country and the factors that influence these arrivals. In international tourism demand modeling, most previous studies have used a demand function approach to identify the quantitative relationships. However, in econometric modeling, a trend term is often included to capture those factors considered to cause upward or downward trends in the demand variable, and this does not take into account any possible correlations between the residuals from the different equations. Many external and internal factors influence tourism demand. In turn, tourism generates physical and financial flows that have potentially strong economic and environmental impacts. Consequently, there is a broad group of stakeholders in tourism arising from both the private and public sector. From these has emerged a widely felt need for tourism analysis in the wider context of the national account that is nationally and internationally comparable with measures of other economic activities. Importantly, in existing econometric studies of tourism in Scandinavia (particularly Sweden and Norway), factors such as relative income and relative/substitute price have not been important determinates in international tourism demand models (Hultkrantz, 1995; Hultkrantz & Olsson, 1997; Jorgensen & Solvoll, 1996), with relatively more emphasis on seasonal effects. The aim of this paper is to estimate international tourism demand to selected regions in Sweden and Norway from five countries: namely, Denmark, the United Kingdom (UK), Switzerland, Japan, and the United States (US). For each visiting country, and Sweden and Norway, we specify a separate equation with the relative information included in each equation. Previous Scandinavian studies have not compared tourism demand for Sweden and Norway. Further, previous studies of Norwegian tourism demand have not considered the relative price and substitution effect, the real and nominal exchange rate, and personal income. Yet other factors that influence demand for tourism include climate, cultural values, natural attractions, and government travel regulations, many of which are difficult to quantify. The purpose of this paper is to use Iterative Seemingly Unrelated Regressions (ISUR) to estimate the relationship between monthly tourist arrivals to Sweden and Norway from Denmark, the UK, Switzerland, Japan, and the US and the factors that influence arrivals. To this end, we employ a demand function approach to tourism flow modeling. There is no previous application of this technique to tourism demand modeling. With the ISUR technique, we estimate the entire system of equations by taking into account any possible correlations between the residuals from the different equations. Moreover, the ISUR technique provides parameter estimates that converge to unique maximum likelihood parameter estimates. In the former types of tourism econometric studies, factors such as income, relative price, real and nominal exchange rates, and the prices of substitutes or complements
Downloaded By: [Mittuniversitetet] At: 13:38 17 December 2010
Estimating International Tourist Demand with ISUR 397 have not been considered as the most important determination for the international tourism demand models. Special events have been considered as the most important determinants for tourism demand models in the Scandinavian former studies (Hultkrantz, 1998; Hultkrantz & Olsson 1997). Additionally, microeconomic theory suggests that the prices of substitutes or complements may be important determinants of the demand. Consequently, the previous studies have not even considered the substitute/complement prices variable as a determinant for the Scandinavian tourism demand. Other factors that also influence the demand for tourism includes climate, cultural values, natural attractions and government travel regulations, some of which were difficult to quantify. The remainder of the paper is organized as follows. Section 2 discusses tourism demand for Nordic countries and the data used. Section 3 presents the estimation and testing methodology and Section 4 provides the results. The paper concludes with a brief summary and conclusion in Section 5. Background and Data The objective of this section is to analyze how the following macroeconomic and microeconomic variables and seasonal (monthly) conditions influence the demand for tourism for the Objective 6 region in Sweden (SW6) and Tröndelag in Norway: (1) The Swedish Consumer Price Index (CPI) represents the inflation rate and cost of living in Sweden and is in natural logarithms. The CPI has several advantages for this purpose: it is familiar to the public and is the most widely used measure of inflation in Sweden (Andersson & Berg, 1995). We adjust the CPI for any changes in indirect taxes and subsidies. (2) We use dummy variables for January to November to proxy for seasonal effects (December is the base category). (3) The exchange rate (EX) between the Swedish/Norwegian currencies and the visitors’ country of origin currency are included in natural logarithms. (4) The relative price (Pr) reflects opportunity cost. This represents the cost of living in relative terms for Norway and Sweden and a substitute price for an origin country tourist. These are also in natural logarithms. The north of Sweden is an important tourist destination, with the yearly demand for tourism in this part of Sweden and Norway consistently following an upward trend. However, interruption to these trends has taken place on a number of occasions due to economic conditions and/or international events. For example, September 11 and the Gulf War had a detrimental effect on tourism demand in both Sweden and Norway. A common model used in tourism demand studies is a single equation with demand explained by the tourist’s income in their country of origin, the cost of tourism in their chosen and alternative destinations, and a substitute price (Witt & Martin, 1987). To start with, the demand for tourism can be expressed in a variety of ways. The most appropriate variable to represent demand explained by economic factors is consumer expenditure or receipts (Grouch, 1992). Other measures of demand are potentially the nights spent by the tourist or their length of stay. However, due to the lack of data on monthly GDP, personal income (GDP/Population) is not included in this analysis.
Downloaded By: [Mittuniversitetet] At: 13:38 17 December 2010
398 A.K. Salman et al. The tourism price index (the price of the holiday) is also an important determinant of the decision a potential tourist makes. We can divide this into two components: (i) the cost of living for the tourist at the destination, and (ii) the cost of travel or transport to the destination. We divide the cost of living into two components: (i) the CPI in relative price form assuming that tourists have the option of spending their vacation in either SW6 or Tröndelag, and (ii) tourist consumer expenditure, real consumer expenditure, real income, and per capita income (Salman, 2003)1. In this paper, CPI represents the cost of living. However, we measure transport costs by the weighted mean prices according to the transport mode used by tourists to reach the destination. Changes in travel costs, particularly airfares, can have a major impact on tourism demand. Unfortunately, data on economy class airfares between Stockholm and the capital cities of the countries of origin were not consistently available, so we could not use these in construction of the variables. Moreover, one should also take into account the small proportion of tourists who arrive in Sweden using charter flights destined for regional airports closer to the main tourist resorts, as the airfares for these may differ considerably from those to the capital city’s airport. Therefore, in the absence of a suitable proxy, we exclude travel costs from our demand system (Lathiras & Siriopoulos, 1998). Following previous research, we can specify the price of tourism at the destination in a variety of ways. For instance, we can represent prices in either absolute or relative terms. In this study, we employ the relative price as an opportunity cost. We define this as the ratio of the CPI of the host country (CPISwe) to the country of origin adjusted by the relative exchange rate (Rit) to obtain a proxy for the real cost of living (Salman, 2003). Therefore, the real cost of tourism in Sweden and Norway are the relative CPIs given by:
Rp jt =
CPIit EX ijt CPI jt
,
(1)
where, i is the host country (Sweden or Norway), j is the visiting (or foreign) country, and t is time. Rpit is the relative CPI for country i in time t, CPIit is the CPI for Sweden or Norway, CPIjt is the CPI for the foreign country, and EXijt is the exchange rate between the Swedish krona/Norwegian krone and the foreign currency. In addition to the price variable, the exchange rate is a relevant factor in determining tourism demand. The rationale behind incorporation of the exchange rate as a separate explanatory variable is that tourists may be more aware of the relative exchange rate than the specific cost of tourism at the destination. A question that arises is whether the exchange rate should be included in our model system as an explanatory variable together with the price variable. In an attempt to find a variable to represent a tourist’s cost of living, Salman et al. (2007) concluded that the CPI (either alone or with the exchange rate) is a reasonable proxy of the cost of tourism. We define the exchange rate variable as the foreign exchange rate of the Swedish krona or Norwegian krone to the currency of the origin country. This variable represents the relationship between tourism demand and the international money market and international economic events (including recessions and financial crises).
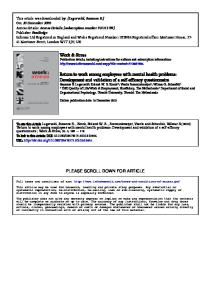
Estimating International Tourist Demand with ISUR 399 As microeconomic theory suggests, the price of other goods influences the demand for a particular good. In the case of tourism, the identification and separation of substitute products is very difficult to achieve on an a priori basis. In our case, tourists consider Tröndelag (in the mid of Norway) an alternative destination to the Objective 6 region (in the north of Sweden). These destinations are popular destinations in Scandinavia, at least in terms of arrivals, for tourists from the origin countries under consideration (see Figures 1 and 2). In this paper, we attempt to explain international flows to SW6 and Tröndelag from Denmark, the UK, Switzerland, Japan, and the US. Therefore, we define the substitute and opportunity cost effects as the ratio of the CPI of the host country (CPISwe and CPINor) to the country of origin (CPI) adjusted by the relative exchange rate (Rit). This provides a proxy for the real cost of living. We define the real cost of tourism in Sweden and Norway by relative CPISwe and CPINor as follows along with the cost of living or substitute effect (in relative prices):
Downloaded By: [Mittuniversitetet] At: 13:38 17 December 2010
Figure 2. 1. The Tröndelag Objective 6region regionininNorway Swedenisisthe thelightly lightlyshaded shadedpart areainatthe themiddle top andoftop-left the map. of the map.
Relative price of tourism for Denmark =
Relative price of tourism for the UK =
CPI Swe / EX SEK / DKK . CPI Nor / EX NOK / DKK
CPI Swe / EX SEK / GBP . CPI Nor / EX NOK / GBP
Relative price of tourism for Switzerland =
CPI Swe / EX SEK / CHF . CPI Nor / EX NOK / CHF
(2 )
( 3)
( 4)
Relative price of tourism for Japan =
CPI Swe / EX SEK / JPY . CPI Nor / EX NOK / JPY
(5)
Relative price of tourism for the US =
CPI Swe / EX SEK /USD . CPI Nor / EX NOK /USD
(6 )
where: CPISwe: CPINor: EXSEK/DKK: EXSEK/GBP: EXSEK/CHF: EXSEK/JPY: EXSEK/USD:
CPI in Sweden (1998 = 100). CPI in Norway (1998 = 100). An index of the Swedish krona per unit of Danish krone (1998 = 100). An index of the Swedish krona per unit of British pound (1998 = 100). An index of the Swedish krona per unit of Swiss franc (1998 = 100). An index of the Swedish krona per unit of Japanese yen (1998 = 100). An index of the Swedish krona per unit of US dollar (1998 = 100).
A lagged dependent variable may also be included to account for habit persistence and supply constraints. As for the signs of the explanatory variables, we expect a negative sign for the relative price variable and a positive sign for the exchange rate
Downloaded By: [Mittuniversitetet] At: 13:38 17 December 2010
400 A.K. Salman et al.
Figure 1. The Objective 6 region in Sweden is the lightly shaded area at the top and top-left of the map.
variable. In this study, monthly dummies represent seasonal effects on the number of arrivals from the origin countries. All variables are in natural logarithms, and the data are in index form (1998 = 100). All economic data employed in this study are from
Downloaded By: [Mittuniversitetet] At: 13:38 17 December 2010
Estimating International Tourist Demand with ISUR 401
Figure 2. map.
The Tröndelag region in Norway is the lightly shaded part in the middle of the
Statistics Sweden (Statistiska Centralbyrån) and Statistics Norway (Statistisk sentralbyrå). Estimation is with the STATA Ver. 10 and EViews Ver. 5.1 statistical program packages. We examine monthly time series data from 1993:01 to 2006:12.
Methodology Statistical Assumptions and the Problem of Misspecification In the common stochastic specification of econometric models, the error terms are assumed to be normally distributed with mean zero, constant variance and serially uncorrelated. These assumptions must be tested and verified before we can have any confidence in the estimation results or conduct any specification tests, including standard t tests of parameter significance or tests of theoretical restrictions. Because misspecification testing is a vast area of statistical/econometric methodology, we
Downloaded By: [Mittuniversitetet] At: 13:38 17 December 2010
402 A.K. Salman et al. confine ourselves to a brief description of the methods used in this study with additional details in the cited references. The methodology used in this paper for misspecification testing follows Godfrey (1988) and Shukur (2002). To test for autocorrelation, we apply the F-version of the Breusch (1978) and Godfrey (1978) test. We use White (1980) test (including cross products of the explanatory variables) to test for heteroscedasticity and Ramsey’s (1969) RESET test to test for functional misspecification (Ramsey, 1969). We also apply the Engle (1982) Lagrange Multiplier (LM) test for the possible presence of Autoregressive Conditional Heteroscedasticity (ARCH) in the residuals. Finally, we apply the Jarque and Bera (1987) LM test of nonnormality to the residuals in model (4). When building an econometric model, the assumption of parameter consistency is widely used because of the resulting simplicity in estimation and ease of interpretation. However, in situations where a structural change may have occurred in the generation of the observations, this assumption is obviously inappropriate. Particularly in the field of econometrics where data are not generated under controlled conditions, the problem of ascertaining whether the underlying parameter structure is constant is of paramount interest. However, to test for the stability of the parameters in the models, and in the absence of any prior information regarding possible structural changes, we conduct a cumulative sum (CUSUM) test following Brown et al. (1975). The CUSUM test is in the form of a graph and is based on the cumulative sum of the recursive residuals. Movement in these recursive residuals outside the critical lines is suggestive of coefficient instability. Systemwise Estimation In this paper, we aim to estimate the number of visitors to two selected regions in Sweden and Norway from five countries (Denmark, the UK, Switzerland, Japan, and the US). For each visiting country, we specify a separate equation with the relative information included in each equation. We do this for both regions. For this purpose, we follow a simple strategy on how to select an appropriate model by successively examining the adequacy of a properly chosen sequence of models for each country separately using diagnostic tests with known good properties. The methodology used for misspecification testing in this paper follows Godfrey (1988) and Shukur (2002). We apply their line of reasoning to the problem of autocorrelation, and then extend it to other forms of misspecification. If we subject a model to several specification tests, one or more of the test statistics may be so large (or the p-values so small) that the model is clearly unsatisfactory. At that point, one has either to modify the model or search for an entirely new model. Our aim is to find a well-behaved model that satisfies the underlying statistical assumptions, which at the same time agrees with aspects of economic theory. Given these models or equations, we estimate the whole system using Zellner’s ISUR. The ISUR technique provides parameter estimates that converge to unique maximum likelihood parameter estimates. Note that conventional seemingly unrelated regressions (SUR) does not have this property if the numbers of variables differ between the equations, even though it is one of the most successful and efficient methods for estimating SUR. The resulting model has stimulated countless theoretical and empirical
Estimating International Tourist Demand with ISUR 403 results in econometrics and other areas (see Zellner, 1962; Srivastava & Giles, 1987; Chib & Greenberg, 1995). The benefit of this model for us is that the SUR estimators utilize the information present in the cross regression (or equations) error correlation and hence it is more efficient than other estimation methods such as ordinary least squares (OLS). Consider a general system of m stochastic equations given by:
Downloaded By: [Mittuniversitetet] At: 13:38 17 December 2010
Yi = X i Bi + ei , i = 1, 2,...M,
( 7)
where Yi is a (T × 1) vector of dependent variables, ei is a (T × 1) vector of random errors with E(ei) = 0 , Xi is a (T × ni) matrix of observations on ni exogenous and lagged dependent variables including a constant term, Bi is a (ni × 1) dimensional vector of coefficients to be estimated, M is the number of equations in the system, T is the number of observations per equation, and ni is the number of rows in the vector Bi. The m system of equations can be written separately as: Y1 = X 1β1 + e1, Y2 = X 2 β 2 + e2 , Ym = X m β m + em ,
and then combined into a larger model written as: Y1 X 1 0 0 0 β1 e1 Y 0 X 0 0 β e 2 . 2 + 2 . 2 = K 0 0 K 0 ... ... Ym 0 0 0 X m β m em
(8)
This model can be rewritten compactly as: Y = XB + e,
( 9) M
where Y and e are of dimension (TM × 1), X is of dimension (TM × n), n =
∑ n , and i
i =1
B is of dimension (K × 1). At this stage, we make the following assumptions: (a)Xi is fixed with rank ni. (b) P 1im 1 ( X ' X ) = Q is nonsingular with finite and fixed elements, i.e. invertible. i i ii T 1 (c)In addition, we assume that P 1im ( X i' X j ) = Qij is also nonsingular with finite T and fixed elements.
404 A.K. Salman et al. (d) E ( ei ei, ) = σ ij I T , where σij designates the covariance between the ith and jth equations for each observation in the sample. The above expression can be written as:
Downloaded By: [Mittuniversitetet] At: 13:38 17 December 2010
σ 11 σ 12 σ σ 22 E(e) = 0 and E(ee’) = Σ ⊗ IT = Ψ, where ∑ = 12 M σ M 1 σ M 2
L σ 1M L σ 2M is an M × M O L σ MM
positive definite symmetric matrix and ⊗ represents the Kronecker product. Thus, the errors at each equation are assumed homoscedastic and not autocorrelated, but there is contemporaneous correlation between corresponding errors in different equations. The OLS estimator of B in (9) is:
βˆOLS = ( X ′X ) −1 X ′Y , with the variance Var ( βˆ ) = ( X ′X ) −1 X ′ΨX (X ′X) −1. OLS
The SUR Generalized Least Squares (GLS) estimator of B is given by:
(
βˆGLS = X ′( ∑ −1 ⊗ I T ) X
)
−1
X ′( ∑ −1 ⊗ I T )Y , and the variance is given by:
( ) (
V βˆGLS = X ′( ∑ −1 ⊗ I T ) X
)
−1
.
However, the system of the five equations for Sweden and Norway are as follows: Yit = α i + Si + X it B i + Yit −q Φiq + e it , i = 1, 2,...5; q = 1,2...12,
(10 )
where Yit is a T × 1 vector of observations on the dependent variable, eit is a T × 1 vector of random errors with E(et) = 0, and Si are monthly dummy variables that take values between 1 and 11 (the 12th month is the base). Xit is a T × ni matrix of observations on ni nonstochastic explanatory variables, and Bi is an ni × 1 dimensional vector of unknown location parameters. T is the number of observations per equation, and ni is the number of rows in the vector Bi. Φiq is a parameter vector associated with the lagged dependent variable for the respective equation. The dependent variables Yi are the natural logarithms of the number of monthly visitors from Denmark, the UK, Switzerland, Japan, and the US to either of the selected regions in Sweden or Norway. The matrix Xi is the natural logarithm of three vectors that contains monthly information about the CPI in Sweden (or Norway), the exchange rate (Ex) in Sweden (or Norway), and relative price (Rp) for Sweden (or Norway) with respect to each of the abovementioned countries. Another objective of this study is to test for the existence of any contemporaneous correlation between the three generations’ equations. If such correlation exists and is statistically significant, then least squares applied separately to each equation are not efficient and there is need to employ another estimation method that is more efficient.
Estimating International Tourist Demand with ISUR 405 The SUR estimators utilize the information present in the cross regression (or equations) error correlation. In this paper, we estimated our model in equation (4) by equation using the OLS method to achieve the best specification of each equation. We estimate the whole system using ISUR. Tables 1 and 3 present the results. The ISUR technique provides parameter estimates that converge to unique maximum likelihood parameter estimates. To test whether the estimated correlation between these equations is statistically significant, we apply Breusch and Pagan’s (1980) LM statistic. If we denote the covariances between the different equations as σ12, σ13…σ45, the null hypothesis is:
Downloaded By: [Mittuniversitetet] At: 13:38 17 December 2010
H 0 : σ 12 = σ 13 ... = σ 45 = 0, against the alternative hypothesis, H1: at least one covarianceis nonzero.
In our three equations, the test statistic is:
λ = N (r 212 + r 213 + ...r 2 45 ), where r 2 ij is the squared correlation, r 2 ij = σ 2 ij / σ iiσ jj.
Under H0, λ has an asymptotic χ2 distribution with five degrees of freedom. We may reject H0 for a value of λ greater than the critical value from a χ2(10) distribution (i.e. with 10 degrees of freedom) for a specified significance level. In this study, the calculated χ2 value for Sweden is equal to 24.599 (p-value = 0.006). For Norway, the calculated χ2 value is 33.842 (p-value = 0.000). These results, reported respectively in Tables 2 and 4 for Sweden and Norway, suggest rejection of H0 at any conventional significance level. This implies that the residuals from each ISUR estimation are significantly “positively” or “negatively” correlated with each other that might stand for the relation between these equations and the countries thereafter. For the case of Norway, the results also suggest a rejection of H0 at any conventional significance level and we interpret this in the same manner as Sweden. Results In this section, we present our most important results using ISUR to model international tourism demand to SW6 in Sweden and Tröndelag in Norway. We first conduct single equations estimation on model (10) for the five equations for Sweden and the five equations for Norway, separately. We specify these equations according to a battery of diagnostic tests. We then select the five most appropriate equations for Sweden and Norway and include them separately in ISUR estimation to achieve the best possible efficiency. We first present the results for the three economic variables and then discuss the results for the seasonal dummy variables (with December as the base month), followed by the lagged dependent variables. Note that the macro variables are in logarithmic form and so we can interpret the estimated parameters as elasticities. The estimated coefficients are included even if they are not significant. For the dummy and lagged dependent variables, only coefficients significant at least
406 A.K. Salman et al. at the 10% level in the single equation estimation are included in the ISUR estimation.
Downloaded By: [Mittuniversitetet] At: 13:38 17 December 2010
Results for Sweden Table 1 shows that the CPI parameter for Denmark is negative and small in magnitude but not statistically significant, indicating Swedish CPI has no effect on the demand for tourism by Denmark. This could be due to low travel costs, whereas countries of origin that are more distant generally have higher price elasticity. The estimated CPISwe elasticity is −6.283 and greater than that for Japan. This indicates that a 1% increase in CPISwe results in a 6.3% decrease in tourist arrivals to SW6 from Japan. The low CPISwe elasticity for the US could be a reflection of the depreciation of the Swedish krona against the US dollar. The estimated elasticity of the relative (substitute) price ranges from 1.9% to 2.3% and is greater than one for Japan and Switzerland. This indicates that a 1% rise in the relative price level (price of tourism in Sweden relative to Norway) causes a more than 1% fall in tourist arrivals from Japan and Switzerland. These estimates indicate that tourist arrivals in Sweden from these countries are elastic with respect to the relative price variable. This implies that Sweden must maintain its international price competitiveness to maintain high growth in tourist inflow. The estimated relative price level elasticity ranges from 0.2% to 0.8% and is less than one for Denmark and the US. These suggest that a 1% increase in the relative price results in a 0.2% and 0.8% decrease in tourist arrivals to SW6 from Denmark and the US, respectively. The low exchange rate elasticity for Japan and the US may also be a reflection of the depreciation of the Swedish krona against the Japanese yen and US dollar. As expected, the estimated elasticities of CPISwe for the UK, Switzerland, and the US are positive. In the case of the UK, we find that all dummies are significant, indicating clear seasonality in the demand for tourism. The demand in December is the highest for the year. We also find lags 4 and 12 are statistically significant. Note that the sign of lag 4 is negative while it is larger and positive for lag 12. For Switzerland, only the summer dummies are large, positive, and statistically significant, meaning that the Swiss are relatively more interested in summer tourism. The remaining dummies are either insignificant or small in magnitude. The estimated parameters of lags 1 and 12 are positive and significant. In general, the lags of the dependent variable for the months of January and December are also significant, supporting the hypothesis of a habit-forming or word-ofmouth effect. Some of the monthly dummies as proxies for seasonal effects are also significant, including January, March, May, June, July, September, October, and November. Estimates of the Denmark dummy show a clear seasonal variation in the pattern of Danish tourism demand in Sweden, such that demand in January, February, March, and July is higher than in December, with lower demand in other months. Results for Norway Table 3 provides estimates of the monthly arrivals from Denmark, Japan, and the US to Tröndelag in Norway. The estimated Norwegian CPI (CPINor) elasticity ranges
Estimating International Tourist Demand with ISUR 407 Table 1.
ISUR estimation results for Sweden.
Sweden
Downloaded By: [Mittuniversitetet] At: 13:38 17 December 2010
Parameters Constant CPI EX Rp D1 D2 D3 D4 D5 D6 D7 D8 D9 D10 D11 Y(t−1) Y(t−3) Y(t−4) Y(t−11) Y(t−12) R2
Equations Denmark
UK
0.155 (0.940) −0.278 (0.730) 1.810 (0.027) −0.178 (0.271) 0.570 (0.000) 0.610 (0.000) 0.272 (0.076) −0.363 (0.005) −0.973 (0.000) −0.237 (0.000) 0.293 (0.001) −0.352 (0.004) − 0.738 (0.000) −0.794 (0.000) −0.857 (0.000)
−6.726 (0.058) 2.879 (0.037) 0.834 (0.035) 0.548 (0.380) −0.377 (0.000) −0.257 (0.000) −0.411 (0.000) −0.440 (0.000) −0.707 (0.000) −0.090 (0.090) −0.304 (0.000) −0.399 (0.000) −0.674 (0.000) −0.507 (0.000) −0.328 (0.000) 0.592 (0.000)
Japan
US
−1.178 (0.802) 16.370 (0.00) −0.222 (0.959) 2.868 (0.047) −6.283 (0.000) 0.432 (0.789) −1.200 (0.170) 0.216 (0.502) 0.248 (0.486) −1.912 (0.038) −2.260 (0.004) −0.769 (0.367) 0.158 (0.004) 0.083 (0.133) 0.138 (0.006) −0.197 (0.001) −0.233 (0.000) −0.118 (0.047) −0.141 (0.013) −0.113 (0.027) 0.477 (0.000) 0.113 (0.066) 0.354 (0.000) 0.806 (0.000) 0.483 (0.000) −0.243 (0.000) −0.363 (0.000) −0.227 (0.000) 0.297 (0.000) 0.282 (0.000) −0.123 (0.028) 0.095 (0.082) 0.561 (0.000) 0.182 (0.005) 0.224 (0.000)
−0.154 (0.000) 0.110 (0.144) 0.101 (0.159) 0.941 Table 2.
Denmark UK Switzerland Japan US
Switzerland
0.247 (0.000) 0.902
0.153 (0.006) 0.825
0.587 (0.000) 0.854
0.743
Matrix of correlations between the residuals for Sweden.
Denmark
UK
1.0000 0.0538 0.2517 −0.0356 −0.1454
1.0000 −0.1346 0.1454 −0.0835
Switzerland
1.0000 0.0143 0.1433
Japan
US
1.0000 0.0457
1.0000
Breusch–Pagan test of independence: Chi-square (10) = 24.599, p-value = 0.006.
from 0.5% to 0.8% and is lower than that for Denmark, Japan, and the US. The estimated CPISwe coefficients suggest that a 1% increase in CPINor results in 0.5%, 0.49%, and 0.8% decreases in tourist arrivals to Norway from Denmark, Japan, and the US, respectively. The low CPINor elasticity for Japan and the US may be a reflection of the depreciation of the Norwegian krone against the Japanese yen and the American dollar.
408 A.K. Salman et al. Table 3.
Downloaded By: [Mittuniversitetet] At: 13:38 17 December 2010
Parameters Constant CPI Ex Rp D1 D2 D3 D4 D5 D6 D7 D8 D9 D10 D11 Y(t−1) Y(t−2) Y(t−3) Y(t−6) Y(t−7) Y(t−9) Y(t−10) Y(t−11) Y(t−12) R2
Denmark
UK
Switzerland
1.949 (0.026) −2.278 (0.088) −0.013 (0.996) −0.532 (0.239) 2.324 (0.000) 2.681 (0.000) 0.233 (0.694) −0.688 (0.041) −1.200 (0.149) 0.211 (0.721) −1.387 (0.018) −0.166 (0.011)
0.158 (0.002) −0.135 (0.027) 0.308 (0.000) 0.265 (0.000)
0.212 (0.000)
0.178 (0.000) 0.216 (0.000)
0.486 (0.000) 0.446 (0.000) 0.318 (0.000)
0.497 (0.000) 1.340 (0.000) 1.346 (0.000) 0.734 (0.000)
−0.331 (0.000) −0.221 (0.000) 0.025 (0.625) 0.167 (0.000)
−0.135 (0.001) −0.116 (0.004) 0.144 (0.000) −0.127 (0.005)
Japan
US
−2.095 (0.232) 2.214 (0.136) −0.820 (0.275) −0.487 (0.414) − 0.462 (0.128) 0.0792 (0.719) −1.127 (0.141) −0.551 (0.349) 0.112 (0.033) 0.162 (0.008) 0.177 (0.002) −0.473 (0.000) −0.150 (0.025) 0.374 (0.000) 0.239 (0.000) 0.506 (0.000) 0.441 (0.000) 0.416 (0.000) −0.227 (0.000) 0.204 (0.002) −0.269 (0.000) 0.171 (0.002) 0.451 (0.000)
0.364 (0.000) −0.143 (0.036)
−0.188 (0.000)
−0.135 (0.001) 0.278 (0.000) 0.363 (0.000) 0.924 Table 4.
0.292 (0.000) 0.794
0.950
0.199 (0.000) 0.263 (0.000) 0.808
0.244 (0.000) 0.850
Matrix of correlations between the residuals for Norway.
Denmark Denmark UK Switzerland Japan US
ISUR estimation results for Norway.
1.0000 −0.0220 0.0170 0.1514 −0.0091
UK
1.0000 0.1060 −0.0446 0.3856
Switzerland
1.0000 0.1531 −0.0883
Japan
1.0000 −0.0033
US
1.0000
Breusch-Pagan test of independence: Chi-square (10) = 33.842, p-value = 0.000.
The estimated elasticities of the relative price variable for Switzerland and the US are less than one (0.17% and 0.6%, respectively), indicating that a 1% rise in the relative price (price of tourism in Norway relative to Sweden) causes about a 1% fall in tourist arrivals from Switzerland and the US. The estimated elasticity of the relative
Estimating International Tourist Demand with ISUR 409 price variable for the UK and Japan are greater than one, indicating that the arrival of tourists in Norway from these countries is elastic with respect to the relative price variable. This implies that Norway must also maintain its international price competitiveness to maintain high growth in tourist inflows. Yet again, the low exchange rate elasticity for Denmark, Japan, and the US can be a reflection of the depreciation of the Norwegian krone against the Danish krone, the Japanese yen, and the US dollar.
Downloaded By: [Mittuniversitetet] At: 13:38 17 December 2010
Summary and Conclusions The main purpose of this paper is to estimate the demand for tourism to selected regions in Sweden and Norway from five different countries: namely, Denmark, the UK, Switzerland, Japan, and the US. Monthly time series data from January 1993 to December 2006 is collected from Statistics Sweden for this purpose. For each visiting country, we specify a separate equation with the relative information included in each equation. We conduct several diagnostic tests in order to specify the five equations for Sweden and Norway. We then estimate these equations using Zellner’s ISUR that takes into consideration any possible correlation between the equations and hence is more efficient than other single equations estimation methods such as OLS. The results show that CPI, some lagged dependent variables, and several monthly dummy variables representing seasonal effects have a significant impact on the number of visitors to SW6 in Sweden and Tröndelag in Norway. The results also show that the relative price and exchange rate have a significant effect on international tourism demand for some countries. However, although we could view this conclusion as supporting a theoretical framework that describes tourism demand model variable relationships, our demand system lacks a travel cost variable. Nonetheless, our results could also have important implications for the decision-making process of government tourism authority agencies in both countries when considering influential factors in their long-term planning. Note 1.
We use the value of industrial output as a proxy for monthly GDP.
References Andersson, K., & Berg, C. (1995). The inflation target in Sweden. In A.G. Haldane (Ed.), Targeting inflation. London: Bank of England. Breusch, T.S. (1978). Testing for autocorrelation in dynamic linear models. Australian Economic Papers, 17, 334–355. Breusch, T.S., & Pagan, A.R. (1980). The Lagrange-Multiplier test and its applications to model specification in econometrics. Review of Economics Studies, 47, 239–253. Brown, R.L., Durbin, J., & Evans, J.M. (1975). Techniques for testing the constancy of regression relationships over time. Journal of the Royal Statistical Society, 37, 149–192. Chib, S., & Greenberg, E. (1995). Hierarchical analysis of SUR model with extensions to correlated serial errors and time varying parameter models. Journal of Econometrics, 68, 339–360. Godfrey, L.G. (1978). Testing for higher order serial correlation in regression equations when the regressors include lagged dependent variables. Econometrica, 46, 1303–1310. Godfrey, L.G. (1988). Misspecification tests in econometrics. Cambridge: Cambridge University Press.
Downloaded By: [Mittuniversitetet] At: 13:38 17 December 2010
410 A.K. Salman et al. Grouch, G.I. (1992). Effect of income and price on international tourism to Australia. Tourism Management, June, 196–208. Hultkrantz, L. (1995). Dynamic price response of inbound tourism guest nights in Sweden. Tourism Economics, 1(4), 357–374. Hultkrantz, L. (1998). Mega-event displacement of visitors, the world championship in Athletics. Göteborg, GTS. Working paper No. 7. Hultkrantz, L., & Olsson, C. (1997). Chernobyl effect on domestic and inbound tourism in Sweden. Environment & resources economics, 9, 239–258. Jarque, C.M., & Bera, A.K. (1987). A test for normality of observations and regression residuals. International Statistical Review, 55, 163–172. Jorgensen, F., & Solvoll, G. (1996). Demand models for inclusive tour charter: The Norwegian Case. Tourism Management, 17(1), 17–24. Lathiras, P., & Siriopoulos, C. (1998). The demand for tourism to Greece: A cointegration approach. Tourism Economics, 171–281. Ramsey, J.B. (1969). Test for specification error in classical linear least squares regression analysis. Journal of the Royal Statistical Society (b), 31, 350–371. Salman, A.K. (2003). Estimating tourist demand through cointegration analysis: Swedish Data. Current Issues in Tourism, 6(4). Salman, A., Shukur, G., & Bergmann-Winberg, M. (2007). Comparison of econometric modelling of demand for domestic and international tourism: Swedish data. Current Issues in Tourism, 10(4). Shukur, G. (2002). Dynamic specification and misspecification in systems of demand equations; a testing strategy for model selection. Applied Economics, 34, 709–725. Srivastava, V., & Giles, D. (1987). Seemingly unrelated regression equations models. New York: Marcel Dekker. White, H. (1980). A heteroskedasticity-consistent covariance matrix estimator and a direct test for heteroskedasticity. Econometrica, 48, 817–838. Witt, S.F., & Martin, C.A. (1987). Deriving a relative price index for inclusion in international tourism demand estimation models: Comment. Journal of Travel Research, 25(3), 38–40. Zellner, A. (1962). An efficient method of estimating seemingly unrelated regressions and tests for aggregation bias. Journal of the American Statistics Association, 57, 348–368.