International Journal of Business and Economics, 2013, Vol. 12, No. 1, 1-14
On Teaching Price Elasticity of Demand and Change in Revenue due to Price Change -A Synthesis with and without Calculus Jong-Shin Wei Department of International Business Administration, Wenzao Ursuline College of Languages, Taiwan
Abstract Price elasticity of demand measures how much, in terms of percentage change, the quantity demanded responds to a change in price. In this pedagogical note, first we intuitively introduce the very first notion of price elasticity, which is a directional measure because it describes the impact of an arbitrary change in price from one to another on the percentage change in quantity demanded. Next, we show how this measure becomes “point” price elasticity of demand when demand is linear. Finally, with help from calculus, we show how it leads to the development of (point) price elasticity of demand in general. At each stage, qualitative results concerning changes in total revenue and price are given and compared with what are in textbooks. A quantitative result regarding predicting the percentage change in total revenue from the price elasticity of demand and the percentage change in price is also given for the case of linear demand. By working progressively from the directional measure to the linear case followed by the general case, and from non-calculus approach to calculus approach, with precise definitions and 6 propositions, we intend to provide a unified framework for teaching the notion and applications of price elasticity in principles of economics as well as intermediate microeconomics. Flaws in textbooks are identified and resolved as well. Key words: elasticity; revenue; demand function JEL classification: A22; B41; D00; C00
1. Introduction It is not so much what we don't know, but what we think we know that obstructs our vision. -- Krister Stendahl (a Harvard theologian)
Correspondence to: Department of International Business Administration, Wenzao Ursuline College of Languages, TAIWAN. Email address:
[email protected]. Constructive comments on a draft version from Chih-Min Pan and Vey Wang are acknowledged. The usual disclaimer applies.
2
International Journal of Business and Economics
Often heard in a public debate, increasing tax rates does not necessarily increase tax revenue. By the same token and even more obviously, increasing the price surely cannot guarantee the increase in sales revenue (i.e., price multiplied by quantity demanded). As taught in principles of economics, the law of demand asserts that price and quantity demanded move in the opposite direction, hence sales revenue does not necessarily go up when we increase the price. Price elasticity of demand is the percentage change in the quantity (of some good) demanded that results from a 1 percent change in its price. [See Frank (2012, p.111).] It is, just like the notion of opportunity cost, a basic concept appearing in literally all textbooks on (principles of) economics. Are we really satisfied with the textbook treatment? Robert H. Frank wrote in a course syllabus, “The opportunity cost concept, so central to our understanding of what it means to think like an economist, is but one among hundreds of concepts that go by in a blur.” which was quoted in Ferraro and Taylor (2005). Inspired by the survey documented in Ferraro and Taylor (2005) as well as the interesting inquiry by Daskin (1992), we would like to kick off this pedagogical synthesis by proposing the following 8 seemingly trivial questions in the true or false format to see if the concept of price elasticity of demand also goes by in a blur. 1. If the (point) price elasticity of demand is −1 (currently), then any (non-zero) change in price will leave total revenue unchanged, i.e., ΔTR ΔP = 0. 2. If the demand curve is linear and (currently) the price elasticity of demand is −1/3, then price and total revenue will move in the same direction, i.e., ΔTR ΔP > 0. 3. If the demand curve is linear and the price elasticity of demand is −2, then any increase in price will reduce total revenue. 4. The notion of price elasticity of demand cannot be taught without using calculus. 5. If the demand curve is linear and the price elasticity of demand is −1/3, then a 50% increase in price will lead to an increase in total revenue by 25%. 6. If the demand curve is linear and the price elasticity of demand is −1/3, then a 150% increase in price will lead to an increase in total revenue by 25%. 7. If the demand curve is linear and the price elasticity of demand is −1/3, then a 200% increase in price will leave total revenue unchanged. 8. It is impossible to have a downward-sloping demand curve with constant price elasticity of demand everywhere (on the demand curve) while price and total revenue always move in the opposite direction. As we move on, we shall see why only statements in questions 1, 2, 4, and 8 are false. Often authors of economics textbooks avoid calculus for good reasons. For instance, Mankiw (2012, p.91) defines the price elasticity of demand as the percentage change in quantity demanded divided by the percentage change in price. Yet, judging from exercises in his text, we know that the notion of elasticity in his text (and in many others) is meant to be a “directional” measure, that is, describing what happens to the quantity demanded, proportionately speaking, while moving from the current price to some new price. To be specific, when the price changes from Po to Po + ΔP (hence the quantity demanded changes from Q o to Qo + Q ), we
Jong-Shin Wei
3
define (Po ,ΔP) := { [(Qo + ΔQ) Qo ] Qo } {[(Po +ΔP) Po ] Po } = (ΔQ ΔP)(Po Qo ) as the price elasticity of demand when the price changes from Po to Po + ΔP. This is the so-coined price elasticity of demand as a directional measure. Students can easily get confused in five directions. First, given several ordered pairs of (Q, P) as the discrete data (called the demand table), the price elasticity of demand when the price changes from Po to P1 may not be the same as the price elasticity of demand when the price changes from Po to P2 .1 Yet, the choice of destination, such as P1 and P2 , makes no influence should these ordered pairs be drawn from a linear demand. Second, students might wonder how much they can learn about price elasticity without relying on calculus. Third, many textbooks state a popular result concerning predicting qualitative effect on total revenue due to a price change by using price elasticity. For instance, after providing demand curves that are linear, rectangular hyperbola, and downward-sloping strictly convex toward the origin, Mankiw (2012, p.96) gives general rules: when the elasticity is greater (resp. less) than −1, price and revenue move in the same (resp. opposite) direction; when the elasticity is −1, revenue remains constant no matter how the price changes.2 [Similar treatments can be found in Krugman and Wells (2009), Katz and Rosen (1998, p.79), among many others.] Yet, on one hand, these so-called general rules fail even for the case of linear demand. On the other hand, with help from calculus, students can learn the correct version of those rules. Fourth, for a well-known constant-revenue demand such as Q = 9/P, from P = 2 to P = 3, the price elasticity (2, 1) is −2/3 > −1; from P = 2 to P = 1, we have (2, −1) = −2 < −1. Once students know calculus, they will be surprised to see that the point price elasticity of demand (to be defined later) is −1 everywhere on this curve. Finally, we feel that there has been no systematic way in teaching the notion of elasticity from arbitrarily discrete change to continuous change; from linear to the general case; from non-calculus approach to calculus approach. An example can be found in Pindyck and Rubinfeld (2005, p.35), stating that the price elasticity of demand is the price elasticity at a particular point on the demand curve. This definition is annoying as we recall that the original and well-received definition of price elasticity is a directional measure, not a point measure per se. Therefore, a progressive and unified treatment is called for. In this pedagogical synthesis, we begin in Section 2 with the classical approach, which is computing (without using calculus) the resulting change in total revenue divided by the change in price, from which we see intuitively how we get the idea of defining the aforementioned price elasticity of demand when the price changes from one to another. Again, through simple algebra we can see how far this notion can lead us to predict the qualitative change in total revenue due to a price change. In Section 3 where linear demand is assumed, we show how this directional measure is simplified to be a point price elasticity of demand. Still, without calculus, we obtain a qualitative result regarding the change in price and the resulting change in total revenue. Another result can help us, given the knowledge of the current point price elasticity of demand, predict the percentage change in total revenue for any percentage change in price. Incidentally, answers to all 8 questions but the last one
4
International Journal of Business and Economics
can be found at the end of Section 3. Finally, with help from calculus and without confining ourselves to linearity, we demonstrate, in Section 4, how the notion of price elasticity of demand (as a directional measure) inspires the point price elasticity of demand. We maximize total revenue (as a function of price) by choosing price. First-order and second-order conditions are carefully examined, identifying common flaws in textbooks and elsewhere. The family of demand curves with constant point price elasticity of demand is also discussed, which also answers question 8 raised in Section 1. 2. Preliminaries Assume throughout that demand curve is continuous (in shape) and downward-sloping. Consider the initial position as ( Q o , Po ) on the demand curve depicted on the first quadrant, called the Q-P space. Assume Q o > 0 and Po > 0. Let the price change from Po to Po + ΔP , with ΔP ≠ 0. Tracing the demand curve, we see the quantity demanded must change from Q o to Qo + Q . To see what happens to total revenue (or TR for short), we calculate the resulting change in total revenue (i.e.,TR) divided by the change in price (i.e.,P) as: ΔTR ΔP = [(Po + ΔP)(Qo + ΔQ) Po Qo ] ΔP
(1)
= Qo [(ΔQ ΔP)(Po Qo ) +1] + ΔQ.
Shortly we will demonstrate how equation (1) gives us a qualitative result about the sign of ΔTR ΔP, stated as Proposition 1. Recall that (Po ,ΔP) := (ΔQ ΔP)(Po Qo ) is the price elasticity of demand when price changes from Po to Po + ΔP (and quantity demanded changes from Q o to Qo + Q accordingly). Whenever confusion is not an issue, we shall simply write for (Po ,ΔP) . Keep in mind that depends on the current price and the intended change in price, implying that is not a point measure. If the price varies in a way that = −1, we learn from equation (1) that ΔTR ΔP = Q , by PQ < 0, implying that TR < 0 regardless of the sign of P. Given > −1, we have ΔTR ΔP > Q , by PQ < 0, implying that TR will fall with P. [Note that we are not predicting what happens to TR when P goes up.] Similarly, at < −1, we have ΔTR ΔP < Q , by PQ < 0, implying that increasing price will reduce total revenue (or TR will fall with Q). We now have Proposition 1, which gives three sufficient conditions for TR < 0. Proposition 1. (i) If we change the price in a way that = −1, then total revenue will fall. (ii) If we lower the price in a way that > −1, then total revenue will fall. (iii) If we increase the price such that < −1, then total revenue will fall. Proposition 1, as the first qualitative result presented here, holds for demand curves that are not necessarily linear. Notwithstanding vaguely spelled out, the
Jong-Shin Wei
5
notion of can be found in almost all textbooks on principles of economics or microeconomics, for examples, Mankiw (2012), Krugman and Wells (2009), Katz and Rosen (1998), Pindyck and Rubinfeld (2005). Yet, they fail to emphasize key roles played by the initial price Po and the variation P. Furthermore, right after the following illustration, we will elaborate why, unlike our Proposition 1, results in those texts are misleading. Consider the demand curve given by P + Q = 8. By moving from P = 4 to P = 6, yielding = −1, we confirm that TR decreases from 16 to 12. By lowering the price from P = 3 to P = 2, we see = −3/5 > −1, confirming that TR decreases from 15 to 12. Finally, by going from P = 5 to P = 6,we have = −5/3 < −1, confirming that TR decreases from 15 to 12. Mankiw (2012, p.96) spells out the so-coined general rules: when = −1, total revenue remains constant regardless of the change in price; when > −1, price and total revenue move in the same direction; when < −1, price and total revenue move in the opposite direction. Upon learning Proposition 1, students will have no problem with disregarding Mankiw’s rules as well as similar treatments found in Krugman and Wells (2009), Katz and Rosen (1998, p.79), Parkin (2010, p.90), Case, Fair, and Oster (2009), Arnold (2010, p.382), among many others. To see the flaws in those textbooks, consider P + Q = 8 again. By moving from P = 4 to P = 6, we have = −1 yet TR decreases from 16 to 12. By moving from P = 2 to P = 7, we see = −1/3 > −1 yet TR decreases from 12 to 7, hence price and total revenue move in the opposite direction. Finally, from P = 6 to P = 1, = −3 < −1 yet TR decreases from 12 to 7, hence price and total revenue move in the same direction. The example given above also demonstrates why (ii) in Proposition 1 cannot be expanded to include: if we increase the price in a way that > −1, then total revenue will go up. Likewise, it shows why (iii) in Proposition 1 cannot be strengthened to include: if we lower the price in a way that < −1, then total revenue will go up. While working with the linear demand given above, we notice that, for the case of linear demand, is invariant with respect to P. On the other hand, it is easy to construct a demand table consisting of several ordered pairs, (Qo , Po ), (Q1 , P1 ), …, and (Qn , Pn ), based on which the price elasticity of demand when price changes from Po to P1 may differ from the price elasticity of demand when price changes from Po to P2 . We wonder what happens if the price change is infinitesimally small. Hence, linear demand and calculus approach naturally come to our attention. Section 3 is about the former scenario. 3. Linear Demand and * When the demand is linear, ΔQ ΔP is the inverse of the slope of the demand curve. Since Po Qo is the slope of the ray from the origin to the point (Qo , Po ) , we see that the expression (Po ,ΔP) := (ΔQ ΔP)(Po Qo ) is now jointly determined by the slope of the linear demand curve (i.e., ΔP ΔQ ) as well as the slope of the ray
6
International Journal of Business and Economics
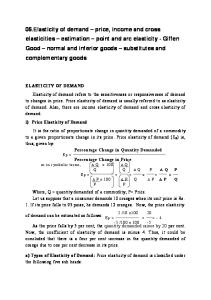
starting from (0, 0) and going thru (Qo , Po ) .3 Hence, for any linear demand (hence its slope is given), is reduced to a point measure in the sense that it is determined by the initial point (Qo , Po ) only. More precisely, the price elasticity of demand when price changes from Po to Po + ΔP remains the same for all P ≠ 0. This observation leads to the following definition characterizing price elasticity of demand as a point measure. Definition 1. Let the demand curve be linear. For each (Qo , Po ) on the demand curve, define its (point) price elasticity of demand by η* (Po ) := (1 m)(Po Qo ) where m is the slope of that demand curve. Hence, for each (Qo , Po ) on a linear demand curve, the price elasticity of demand when price changes from Po to Po + ΔP , for any P ≠ 0, is now simplified as η* (Po ) . We shall often write * for η* (Po ) whenever suitable. Note that * is a point measure (and not to be confused with a local measure) and that no calculus has been brought up so far. It seems that textbook writers fail to highlight the difference between (a directional measure) and * (a point measure) while illustrating them with linear and non-linear demand curves. Immediately we see that * is decreasing as we move (the typical point) along the demand curve northeast bound. A simple illustration can be found in Figure 1. Consider a linear demand curve, Q = α βP for positive parameters α and β . Let M be the midpoint of this line segment, which is (α 2,α (2β)) . At M, we see * = (β){[α (2β)] (α 2)} = 1. For any point below M, we have * > −1; for any point above M, we have * < −1. We mark points A(3α 4,α (4β)), M(α 2,α (2β)), C(3α 8,5α (8β)), and B(α 4,3α (4β)) on the line segment in figure 1 for future references. The value of * at points A, M, C, and B are −1/3, −1, −5/3, and −3 respectively. Figure 1. Point Elasticities on a Linear Demand Curve
Jong-Shin Wei
7
In light of ΔQ Qo = (η* ) (ΔP Po ), an immediate application of Definition 1 can be found in Daskin (1992, Proposition 1). We now return to the case of an arbitrarily chosen linear demand curve. At the midpoint M, we learn from equation (1), ΔTR ΔP = Qo [(ΔQ ΔP)(Po Qo ) +1] + ΔQ = Q, that if P > 0 (resp. P < 0), then by Q < 0 (resp. Q > 0) we obtain TR < 0. Hence, at M, any change in price will only make total revenue fall, saying that total revenue is maximized only at M. At any point with * greater than −1, by ΔTR ΔP = Qo (η* +1) + ΔQ we see that any reduction in price (hence Q > 0) will decrease total revenue. Similarly, at any point with * less than −1, we know that any rise in price (hence Q < 0) will decrease total revenue. To sum up, we have shown that for any linear demand curve at which M is the midpoint, TR is maximized only at M and departing (in either way) from M will reduce TR. We get the second qualitative result as follows. Proposition 2. Let the demand curve be linear. (i) Total revenue is maximized only at the midpoint, where * = −1. (ii) * is decreasing as we move along the demand curve northeast bound. (iii) At any point with * > −1, any reduction in price will decrease total revenue. (iv) At any point with * < −1, any increase in price will decrease total revenue. A corollary of (iii) and (i) is: at * > −1, a rise in price will increase total revenue as long as the new price does not go above that at the midpoint. A corollary of (iv) and (i) is: at * < −1, a drop in price will increase total revenue as long as the new price does not go below that at the midpoint.4 Definition 1 and Proposition 2 together illustrate how one can teach price elasticity of demand in economics (by playing with the linear demand) when students have no background in calculus.5 Questions 1 thru 4 in the introduction section are answered. We now move on to do some quantitative analysis (in the global sense). The impact on the percentage change in total revenue due to price change is: ΔTR TR o := [(Po + ΔP)(Qo + ΔQ) Po Qo ] (Po Qo ) = (ΔQ Qo )[1+ (ΔP Po )] + ΔP Po = * (ΔP Po )[1+ (ΔP Po )] + ΔP Po
(2)
= * (ΔP Po ) 2 + (1+ * )(ΔP Po ) .
What can we learn from equation (2)? At * = −1, ΔTR TR o = (ΔP Po )2 < 0 for all non-zero P. This is another way of saying that once we are at * = −1, any change in price will only reduce TR. Equation (2) helps us exactly predict the rate of change in TR for any rate of change in price provided that we know what the current * is. Consider a point (still on some linear demand curve) at which * = −1/3. Substituting * = −1/3 and ΔP Po = 50% into equation (2) yields ΔTR TR o = 1/4.
8
International Journal of Business and Economics
Likewise, for ΔP Po = 150% we get ΔTR TR o = 1/4; for ΔP Po = 200% we get ΔTR TR o = 0. In words, suppose now we are at * = −1/3, and (1) if we increase the price by 50%, TR will go up by 25%; (2) if we increase the price by 150%, TR will go up by 25%; (3) if we increase the price by 200%, TR will remain the same. Hence, answers to questions 5 to 7, in the introduction, are all affirmative. Since the price change in equation (2) need not be infinitesimally small, we have a global result based on * . Once again, no need for calculus. We now go one step further. By the method of making a square we can rewrite equation (2) as:
ΔTR TR o = * [ΔP Po + (1+* ) (2* )]2 [1+ (* )-1 ]2 4 . Hence, at given * < 0, we see that ΔTR TR o is maximized only when P = (1+ η* )Po (2η* ). By this formula, once we know (Qo , Po ) and * , we know how to change price to get the highest growth rate of total revenue. Of course, such a price change also warrants the maximal total revenue. Take point A in figure 1 to illustrate. Here * = −1/3. To reach the maximal total revenue, we must have the price doubled. As to point M in figure 1, obviously we need P = 0, meaning that we must stay at the same price to earn the maximized total revenue. Formally, we present our findings as Proposition 3, which is the first quantitative result reported here. Proposition 3. Let the demand curve be linear. At each (Qo , Po ) with * < 0 on the demand curve, we know that (i) ΔTR TR o = * (ΔP Po )2 + (1+* )(ΔP Po ); (ii) the highest growth rate in total revenue is achieved (or total revenue is maximized) only by having ΔP = (1+* )Po (2* ). Given any linear demand curve and at any current positive price, part (i) in Proposition 3 precisely gives the rate of change in total revenue due to any rate of price change. The second part of Proposition 3 tells us how to change the price so as to maximize total revenue. 4. What If Demand Curves Are Not Linear Up to this point, we have demonstrated how to teach the notion of price elasticity of demand and its applications (mainly to the change in total revenue) without replying on calculus. During the course we also see how nice it is to work with linear demand. Of course, one may ask: what if the demand curve is not linear? In this section we shall confine our analysis to the class of twice-continuously differentiable demand functions. Consider an infinitesimally small change in price, written as P → 0. By taking the limit, we have equation (1) as:
Jong-Shin Wei
9
limΔP0 ΔTR ΔP = limΔP0 {Qo [(ΔQ ΔP)(Po Qo ) +1] + ΔQ} = Qo [lim ΔP 0 (ΔQ ΔP)(Po Qo ) +1] + lim ΔP 0 ΔQ
(3)
= Qo [lim ΔP 0 (ΔQ ΔP)(Po Qo ) +1] + 0 := Qo [ (Po ) +1]
where we define (Po ) := limΔP 0 (ΔQ ΔP)(Po Qo ) as the (point) price elasticity of demand at (Qo , Po ) on the demand curve supported by the demand function Q(P). Immediately we see that for linear demand, (Po ) = * (Po ). We shall write for (Po ) whenever possible. With help from calculus, we see := [dQ(P) dP](Po Qo ) . [For another illustration of careless treatment in textbook, see Perloff (2008, p.30) at which (ΔQ ΔP)(Po Qo ) = (dQ dP)(Po Qo ) !] Definition 2. Let the downward-sloping demand curve be characterized by a differentiable demand function Q(P). For each (Qo , Po ) on the demand curve, define its (point) price elasticity of demand by := [dQ(P) dP](Po Qo ), where dQ(P) dP is evaluated at Po . With little help from geometry we can easily establish the following result which has practical merits. This is not new. It can be found in Hyson and Hyson (1949). Proposition 4. Let the downward-sloping demand curve be characterized by a differentiable demand function Q(P). For each (Qo , Po ) on the demand curve, the (point) price elasticity of demand is:
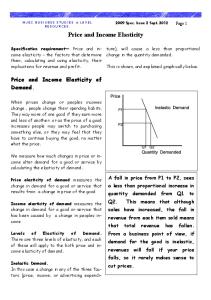
= [the slope of the line tangent to this demand curve at (Qo , Po )]-1 (Po Qo ) = a b = c Qo = Po d , where a is the distance from (Qo , Po ) to where the (aforementioned) tangent line meets the Q-axis, b is the distance from (Qo , Po ) to where that tangent line meets the P-axis, c is the projection of a on the Q-axis, and d is the projection of b on the P-axis.
10
International Journal of Business and Economics Figure 2. Geometrical Property of the (Point) Price Elasticity of Demand
P
b d
Demand curve a c
O
Q
Note that d + Po is the so-coined P-intercept of that tangent line. Hence, at any given price, varies inversely with the P-intercept. This property is documented in Nieswiadomy (1985 and 1986). With help from Proposition 4, the job of finding * for the linear case is made much easier. For linear case, textbooks such as Katz and Rosen (1998, p.76), Frank and Bernanke (2007, p.103), and Frank (2012, p.135) have similar treatment, often referred to as the segment-ratio method. As before, we now examine the change of TR due to price change. Treat TR(P) as the total revenue function of price and keep in mind that the demand function Q(P) is twice-differentiable. At (Qo , Po ), we have:
dTR(P) dP = Qo +[dQ(P) dP]Po = Qo {1+[dQ(P) dP](Po Qo )} = Qo (1+ η) ;
(4)
Jong-Shin Wei d 2 TR(P) dP2 = dQ(P) dP +[d 2 Q(P) dP2 ]Po + dQ(P) dP = 2[dQ(P) dP] +[d 2 Q(P) dP 2 ]Po .
11 (5)
By dQ(P) dP < 0 we see that d 2 Q(P) dP2 ≦0 suffices to ensure d TR(P) dP2 < 0, implying that TR is strictly concave in P, hence the equation dTR(P) dP = 0 (as the first-order necessary condition for local maximum) can help us find the price at which total revenue is maximized. In other words, we cannot say that total revenue is maximized (only) at = −1 without checking d 2 TR(P) dP2 < 0. Unfortunately many students (and professors alike) fail to check d 2 Q(P) dP2 ≦ 0 while jumping into the conclusion based on the first-order condition. Although linear demand buys us d 2 Q(P) dP2 = 0, any demand curve that is downward-sloping and strictly convex toward the origin obviously disqualifies d 2 Q(P) dP2 ≦ 0. Nevertheless, there are cases where d 2 Q(P) dP2 > 0 yet total revenue is maximized (only) at = −1. As in Forshner and Shy (2009) as well as Amir and Grilo (1999), consider P = exp( Q) = e-Q defined for all non-negative Q. In this case, although d 2 Q(P) dP2 > 0 (but dQ(P) dP < 0 is small enough to offset it), we still have d 2 TR(P) dP2 = −1/P < 0 for all P > 0. Here TR is maximized at P = e-1 (and Q = 1), where = −1. The above discussion surrounding (4) and (5) basically points out “when demand function is differentiable, we do not know for sure that total revenue is maximized at the price satisfying = −1.” Yet, we can learn some qualitative local results by examining the sign in (4) as follows. When we are at a point satisfying > −1 (resp. < −1), total revenue and price move in the same (resp. opposite) direction for an infinitesimally small change in price. Two remarks are in order. First we note that these two results do not rely on the sign of d 2 TR(P) dP2 . Second, suppose that we now are at a point satisfying > −1, when we change the price, how could we know that the change is infinitesimally small? From time to time, we see some faulty policy recommendations on media such as “now the (estimated) price elasticity of demand is −1/3 (while nothing was said about the shape of demand curve), if the government intervention makes the price go up, then total revenue must rise as well.” Support this view as you wish, just do not “justify” it by (4). 2
Proposition 5. Let the downward-sloping demand curve be characterized by a differentiable demand function Q(P). At any point satisfying > −1 (resp. < −1), total revenue and price move in the same (resp. opposite) direction for an infinitesimally small change in price. What happens when we confront the case of d 2 Q(P) dP2 > 0, meaning that the demand curve is strictly convex toward the origin? A renowned example of iso-elastic demand can tell the story best. Let the demand function be Q = kPη with k > 0 and < 0. By [dQ(P) dP](P Q) = ηkPη-1[P (kPη )] = η we see that the parameter happens to be the (point) price elasticity of demand at any price P > 0.
12
International Journal of Business and Economics
This explains where the term “iso-elastic” comes from. Its shape is confirmed by d 2 Q(P) dP2 = kη(η 1)Pη-2 > 0 for all P > 0. Iso-elastic demand can be found in Besanko and Braeutigam (2006, p.42), Hirshleifer and Glazer (1992, p.129), and Frank (2012, p.133). Note that TR = PQ = kP1+η , which is increasing (resp. decreasing) in P if > −1 (resp. < −1). We now establish a global result for a special family of demand functions. Note that part (iii) in Proposition 6 answers question 8. Proposition 6. Let the demand function be Q(P) := kPη with parameters k > 0 and < 0. (i) At = −1, total revenue remains unchanged regardless of the price change. (ii) At > −1, price and total revenue move in the same direction. (iii) At < −1, price and total revenue move in the opposite direction. An interesting comparison between ( Po , P), in section 1, and can be made by considering Q = 9 P as an example. Now we are at point (9, 1). By (1,ΔP) = [(Q1 9) (P1 1)](1 9) = [(Q1 9) (P1 1)] 9, we see that when price changes from 1 to 2, is −1/2; when price changes from 1 to 3, is −1/3; when price change from 1 to 1/2, is −2; when price change from 1 to 1/3, is −3. By moving along the demand curve with starting point (9, 1), it is easy to see from the secant line that increasing the new price (i.e., P1 ) leads to larger ; decreasing the new price makes fall. Yet, the (point) price elasticity of demand at (9, 1) and at any other point on that curve is cast at −1. 5. Concluding Remarks Discussions on the relation between price elasticity of demand and how total revenue responds to a change in price are common in textbooks, yet often confusing, or even misleading. Authors of textbooks get used to writing research papers in the world with calculus, yet many students study principles of economics with no background in calculus. As a result, we see how the notion of price elasticity of demand, a very basic concept in economics, has been treated carelessly in numerous textbooks. We suggest that Sections 1 and 2 in this synthesis can be used as the introductory reading, possibly for non-economics majors. Instructors can use Section 3 for economics principles courses taken by economics majors. Materials reported here are self-contained, leaving no need to wrestle with contradictory treatment in textbooks. Students in calculus (for business or economics majors) might benefit from the first part of Section 4 because that studying the effect of an infinitesimally small change in price on total revenue illustrates how the notion of price elasticity of demand is conceived. It also serves as a nice example for introducing the derivative of functions. Section 4 might be a good supplemental reading for courses such as mathematical economics (for undergraduates) and intermediate microeconomics. The selection criterion for propositions presented here is mainly furnishing a
Jong-Shin Wei
13
progressive, clarifying, and unified treatise targeting both college freshmen and upper-level undergraduates. Some results surely can be strengthened. For instance, readers who digest endnotes 4 and 5, and two corollaries of Proposition 2 might conjecture the following: Let the demand curve be linear. (i) Total revenue is maximized only at the midpoint, where * = 1 . (ii) * is decreasing as we move along the demand curve northeast bound. (iiia) At any point with * > 1 , any reduction in price will decrease total revenue. (iiib) At any point with * > 1 , any increase in price will increase total revenue as long as P < 2( PM Po ), where PM is the vertical coordinate of the midpoint. (iva) At any point with * < 1 , any increase in price will decrease total revenue. (ivb) At any point with * < 1 , any decrease in price will increase total revenue as long as P > 2( PM Po ), where PM is the vertical coordinate of the midpoint. The above appears to be a stronger result than Proposition 2 is. Notes 1.
Bade and Parkin (2013) calculate the price elasticity of demand for “changing from P = 3 to P = 5” and for “changing from P = 5 to P = 3” and explicitly mention the difference. They then move on to introduce the notion of arc elasticity (called midpoint method by them). This is common in many texts, including Parkin (2010, p.89). They provide little or no motivation on how price elasticity is conceived. Furthermore, they begin with [(Q1 Qo ) Qo ] [(P1 Po ) Po ], recognizing the issue of directional measure, attempting to fix it with a new notion [(Q1 Qo ) (Qo + Q1 )] [(P1 Po ) (Po + P1 )] , and moving on with [(Q1 Qo ) Qo ] [(P1 Po ) Po ].
2.
Textbooks often call it “inelastic (resp. elastic)” if the elasticity is greater (resp. less) than −1; call it “unit elastic” if the elasticity is −1. This is referred to as the price-slope method in Frank (2012). For instance, in Frank (2012, p.117), we see “at η* < 1 , a price reduction will increase total revenue”, which apparently has left out the restriction “as long as the new price does not go below that at the midpoint.” Proposition 2 is intended to fix the flaws in many textbooks. For instance, Parkin (2010, p.90) as well as Bade and Parkin (2013, p.159) stated, for linear demand, that (i) if price cut increases total revenue, then demand is elastic; (ii) if price cut decreases total revenue, then demand is inelastic; (iii) if price cut leaves total revenue unchanged, then demand is unit elastic. Here, (i) follows from Proposition 2. The flaws are in (ii) and (iii). Recall figure 1. From P = 3α (4β) to P = α (8β), total revenue falls from 3α2 (16b) to 7α2 (64) yet η* < 1 at P = 3α (4β), showing that (ii) is incorrect. To see why (iii) is false, consider moving from P = 3α (4β) to P = α (4β), leaving total revenue unchanged yet η* < 1 at P = 3α (4β). Incidentally, we cannot reverse the causality and state (iv) if demand is inelastic, then price cut decreases total revenue; (v) if demand is unit elastic, then price cut leaves total revenue unchanged for reasons given earlier.
3. 4.
5.
14
International Journal of Business and Economics
References Amir, R. and I. Grilo, (1999), “Stackelberg versus Cournot Equilibrium,” Games and Economic Behavior, 26(1), 1-21. Arnold, R. G., (2010), Economics, 9th edition, Mason, OH: South-Western. Bade, R. and M. Parkin, (2013), Essential Foundations of Economics, 6th edition, Upper Saddle River, NJ: Pearson. Besanko, D. and R. R. Braeutigam, (2006), Microeconomics, 2nd edition, Hoboken, NY: John Wiley & Sons. Case, K. E., R. C. Fair, and S. M. Oster, (2009), Principles of Economics, 9th edition, Upper Saddle River, NJ: Prentice Hall. Daskin, A. J., (1992), “Two Propositions on the Applications of Point Elasticities to Finite Price Changes,” The Journal of Economic Education, 23(1), 17-21. Ferraro, P. J. and L. O. Taylor, (2005), “Do Economists Recognize an Opportunity Cost When They See One? A Dismal Performance from the Dismal Science,” Contributions to Economic Analysis & Policy, 4(1), article 7. (on-line journal) Forshner, Z. and O. Shy, (2009), “Constant Best-Response Functions: Interpreting Cournot,” International Journal of Business and Economics, 8(1), 1-6. Frank, R. H., (2012), Microeconomics and Behavior, 7th edition, New York, NY: McGraw-Hill. Frank, R. H. and B. S. Bernanke, (2007), Principles of Economics, 3rd edition, New York, NY: McGraw-Hill. Hirshleifer, J. and A. Glazer, (1992), Price Theory and Applications, 5th edition, Englewood Cliffs, NJ: Prentice-Hall. Hyson, C. D. and W. P. Hyson, (1949), “Geometrical Measurement of Elasticities,” American Economic Review, 39(4), 728-729. Katz, M. L. and H. S. Rosen, (1998), Microeconomics, 3rd edition, New York, NY: McGraw-Hill. Krugman, P. and R. Wells, (2009), Economics, 2nd edition, New York, NY: Worth Publishers. Mankiw, N. G., (2012), Principles of Economics, 6th edition, Mason, OH: South-Western. Nieswiadomy, M., (1985), “A Technique for Comparing the Elasticities of Linear Demand and Supply Curves,” Atlantic Economic Journal, 13(4), 68-70. Nieswiadomy, M., (1986), “A Note on Comparing the Elasticities of Demand Curves,” Journal of Economic Education, 17(2), 125-128. Parkin, M., (2010), Economics, 9th edition, Englewood Cliffs, NJ: Prentice Hall. Perloff, J. M., (2008), Microeconomics, New York, NY: Pearson/Addison Wesley. Pindyck, R. S. and D. L. Rubinfeld, (2005), Microeconomics, 6th edition, Upper Saddle River, NJ: Pearson.