OECD Trade and Environment Working Paper No. 2006-01
Liberalisation of Trade in Renewable Energy and Associated Technologies: Biodiesel, Solar Thermal and Geothermal Energy
Ronald Steenblik OECD Trade Directorate
OECD
Joint Working Party on Trade and Environment
Unclassified
COM/ENV/TD(2005)78/FINAL
Organisation de Coopération et de Développement Economiques Organisation for Economic Co-operation and Development
04-Apr-2006 ___________________________________________________________________________________________ _____________ English - Or. English ENVIRONMENT DIRECTORATE TRADE DIRECTORATE
COM/ENV/TD(2005)78/FINAL Unclassified
Joint Working Party on Trade and Environment
LIBERALISATION OF TRADE IN RENEWABLE ENERGY AND ASSOCIATED TECHNOLOGIES: BIODIESEL, SOLAR THERMAL AND GEOTHERMAL ENERGY OECD Trade and Environment Working Paper No. 2006-01
by Ronald Steenblik
English - Or. English
JT03206910
Document complet disponible sur OLIS dans son format d'origine Complete document available on OLIS in its original format
COM/ENV/TD(2005)78/FINAL
ABSTRACT This paper, the second in a series, examines the implications of liberalising trade in three forms of renewable energy: biodiesel, solar-thermal water heaters, and geothermal energy systems. Eliminating tariffs on renewable energy and associated goods — which are 15% or higher on an ad valorem basis in many developing countries — would reduce a burden on consumers of energy, particularly people living in rural areas of developing countries, as it is in such areas that many renewable fuels and renewable-energy technologies are making, and are likely to make, their greatest contribution. Manufacturers located in OECD countries would benefit from increased trade in equipment, but so would a growing number of companies based in developing countries. In the case of biodiesel, developing countries have the potential to become major suppliers to OECD countries. For the maximum benefits of trade liberalisation in biodiesel, and solar-thermal and geothermal technologies, to be realised, however, additional reforms may be required in importing countries’ domestic policies, especially those affecting the pricing of liquid fuels, competition in the electricity sector, and protection of the environment. JEL Classifications: F14, F18, Q42, Q48, Q56 Keywords: environmental goods, renewable energy, environmental technologies, trade, developing countries
ACKNOWLEDGEMENTS This study was prepared by Ronald Steenblik, under the direction of Dale Andrew (Trade Policy Linkages Division of the OECD Trade Directorate), with input from colleagues in the OECD Environment Directorate’s Global and Structural Policies Division and the International Energy Agency’s Energy Technology Collaboration Division. It was discussed in the OECD’s Joint Working Party on Trade and Environment (JWPTE), which agreed to its de-classification on the responsibility of the Secretary General. The author is grateful to delegates to the JWPTE for their many helpful comments and suggestions during the preparation of the study, and to Lew Foulton, Janet Hall, Peter Tulej, and Simonetta Zarrilli for their helpful discussions, comments and background information. The report is available on the OECD website in English and French at the following URL addresses: http://www.oecd.org/trade and http://www.oecd.org/environment.
Copyright OECD, 2006 Application for permission to reproduce or translate all or part of this material should be made to: OECD Publications, 2 rue André Pascal, 75775 Paris Cedex 16, France.
2
COM/ENV/TD(2005)78/FINAL
TABLE OF CONTENTS
Executive Summary .................................................................................................................................... 4 Biodiesel...................................................................................................................................................... 4 Solar thermal water heaters ....................................................................................................................... 14 Geothermal energy .................................................................................................................................... 16 References..................................................................................................................................................... 19
Boxes Box 1. One Brazilian palm-oil producer’s approach to production and the environment ............................ 13 Box 2. Shifting from Conventional to Solar Water Heaters in India............................................................ 16
Tables Table 1. World production of biodiesel, 2002-07 (OECD Secretariat very rough estimates) ...................... 7 Table 2. Percentage change in full life-cycle air pollutant emissions (as g/km) for 100% biodiesel compared with low, ultra low and extra low-sulphur petroleum diesel.......................... 9 Table 3. Average oil yields, land requirements and major producers of oleaginous plants........................ 11
Figures Figure 1. Retail prices for petroleum diesel as of November 2004 in selected countries ............................ 14
3
COM/ENV/TD(2005)78/FINAL LIBERALISATION OF TRADE IN RENEWABLE ENERGY AND ASSOCIATED TECHNOLOGIES: BIODIESEL, SOLAR THERMAL AND GEOTHERMAL ENERGY
Executive Summary There is considerable interest in the potential for producing and using biodiesel, solar-thermal water heaters and geothermal plants in developing countries. The resources on which these forms of energy are derived are distributed widely across the world, and the technologies involved in their exploitation are in many cases less sophisticated than other renewable-energy technologies. In considering these energy sources and technologies for trade liberalisation, it would be useful to know how high are the remaining barriers, and how the benefits of reducing those barriers would be distributed. As was done for the previous paper in this series (Steenblik, 2005), this paper builds on a positive list of renewable energy and associated technologies of interest to both developed and developing countries, and analyses the benefits (and costs) of liberalisation for selected countries and products. The study finds that production of biodiesel (a methyl or ethyl ester resembling petroleum-derived diesel fuel) has been increasing rapidly in recent years and is set to continue expanding at a rapid rate through the end of this decade as planned capacity comes on stream. Much of that new capacity is being built in the OECD countries, but there are several developing countries — Brazil, China, India and Malaysia in particular — that are poised to join the ranks of major producers. In many cases the choice of feedstock, particularly oils from tropical plants, available to developing countries means that they can produce biodiesel at lower cost than the fuel can be produced elsewhere. Liberalising tariffs on biodiesel would lower prices and thereby encourage a faster rate of substitution of this relatively clean-burning fuel for petroleum diesel. However, for trade in biodiesel to reach its full potential, complementary changes in domestic policies will also need to be put in place to safeguard the environment. And, in some countries, consumer subsidies for petroleum diesel would have to be eliminated. Solar thermal water heaters have been around for decades, and there are now perhaps hundreds of small and medium-sized producers of these devices in the world, including in developing-countries. As water heating is the leading or second-most important energy requirement among households in most of the countries of the world, any change in policy that reduces costs of these devices will benefit the environment by substituting clean energy derived from the sun for other, less benign energy sources. Barriers to trade in solar thermal water heaters are highest among developing countries, including those with the climate conditions most favouring their use. The potential for developing geothermal resources is substantial, though limited to particular areas of the world. Some developing countries, such as the Philippines, have already pursued the development of their geothermal energy resources rapidly. Lowering tariffs on the components of goods necessary for the exploitation of geothermal energy would help a number of other countries similarly reach their full potential, and thereby reduce dependence on more-polluting fossil fuels. Biodiesel The fuel and related goods Biodiesel is defined by the World Customs Organization (WCO) as “a mixture of mono-alkyl esters of long-chain [C16-18] fatty acids derived from vegetable oils or animal fats, which is a domestic
4
COM/ENV/TD(2005)78/FINAL renewable fuel for diesel engines and which meets the specifications of ASTM D 6751.”1 The fuel can be used in standard compression-ignition (i.e., diesel) engines with small or no modifications. It is biodegradable, non-toxic, and essentially free of sulphur, aromatic hydrocarbons (such as carcinogenic benzene), and produces far less particulate matter during combustion than diesel refined from petroleum. Biodiesel can be made from almost any naturally occurring oil or fat. Most of the world’s production of biodiesel currently derives from plant oils, chiefly canola (rapeseed) and soy. Other oleaginous crops used as biodiesel feedstock include castor seed, coconut, jojoba, oil palm (Elaeis guineensis), physic nut (Jatropha curcus L.), and sunflower seed — many of which are grown predominantly in developing countries. Biodiesel can also be produced from waste cooking oils, fish oil,2 and tallow3 (animal fat). There have even been suggestions that waste fat obtained from liposuction,4 some 100 tonnes of which are produced in the United States alone each year, also could be used as a feedstock for biodiesel.5 Transforming oils and fats into biodiesel involves a relatively simple chemical process, using wellestablished technologies.6 Plant oils and animal fats consist mainly of triglycerides, the fatty acid esters of glycerine. Unprocessed, they are extremely viscous and tend to leave resins — undesirable qualities inside a fuel tank. The most commonly used process for refining plant oils, base-catalyzed transesterification, involves stripping the glycerine from the fatty acids with a catalyst such as sodium or potassium hydroxide, and replacing it with an anhydrous alcohol, usually methanol. The resulting raw product is then centrifuged and washed with water to cleanse it of impurities. This yields methyl or ethyl ester (biodiesel), as well as a smaller amount of glycerol (HS 2905.45), a valuable by-product used in making soaps, cosmetics, and numerous other products. Biodiesel can be produced in very small quantities with simple equipment for handling, storing and mixing the feedstock, reagent, catalyst and end-products. Several companies now manufacture modular biodiesel refineries that can be transported and installed rapidly. A UK company, D1 Oils Plc, for example, has developed a modular, skid-mounted continuous transesterification unit (the “D1 20”), capable of producing a nominal 8 000 tonnes a year of biodiesel from a wide range of vegetable oil feedstock. The unit, which measures 3.3 meters wide, 10 meters long and 4 meters high and weighs just under 15 tonnes, can be shipped anywhere in the world accessible by road, rail or sea.7 Biofuels S.A. (www.biofuels1
ASTM stands for the American Society for Testing and Materials. ASTM D6751 refers to the ASTM’s “Standard Specification for Biodiesel Fuel (B100) Blend Stock for Distillate Fuels”.
2
Terrence Sing, “Biotech industry goes fishing to find new auto fuel”, Pacific Business News, 9 April 2004, http://www.bizjournals.com/pacific/stories/2004/04/12/focus3.html.
3
Two of Australia’s plants are designed to process tallow (www.arfuels.com.au), as are several of the plants currently operating in Canada, and a 100 000 tonne per year plant scheduled to start up in Brazil in June 2006.
4
“A usually cosmetic surgical procedure in which excess fatty tissue is removed from a specific area of the body, such as the thighs or abdomen, by means of suction. Also called suction lipectomy.” The American Heritage® Dictionary of the English Language, Fourth Edition, 2000.
5
Brett Schaeffer, “The accidental conservationist, In These Times, 3 December 2003 http://www.inthesetimes.com/site/main/article/the_accidental_conservationist/
6
Two other methods, both generally more expensive, can be used: (i) direct, acid-catalyzed esterification of the oil with methanol, and (ii) conversion of the oil first to fatty acids, and then to alkyl esters using acid catalysts.
7
“D1 20 Modular Biodiesel Refinery”, http://www.d1plc.com/energy/d1_20_way.php
5
COM/ENV/TD(2005)78/FINAL sa.com) a company based in Argentina, sells even smaller units. Such refineries could be classified under HS 8479.20 (“Machinery for the extraction or preparation of animal or fixed vegetable fats or oils”). Another piece of essential equipment is a crusher, which would be an ex-out of HS 8479.82 (“Mixing, kneading, crushing, grinding, screening, sifting, homogenising, emulsifying or stirring machines”). Production and trade Currently, OECD countries account for most of the world’s consumption of biodiesel, and about 85% of its production. Demand throughout the world has been driven largely by tax incentives, regulations on the quality or share of biofuels in transport fuel, and government procurement policies. Exemption from or refund of the excise tax on diesel, which effectively double the retail price of petroleum diesel in many OECD countries, is the most common consumption incentive. Target shares for biofuels generally, or biodiesel in particular, have been established in many countries. In May 2003 the European Union issued a Directive (2003/30/CE) setting targets for the share of biofuels (which include ethanol in addition to biodiesel) in total transport fuel. The aim is that by end 2005 biofuels should have accounted for at least a 2% share, and by the end of 2010 a 5.75% share. In Brazil, a 2% mixture (abbreviated as B2) will be compulsory starting in 2008; the intention is then to increase the percentage gradually so as to reach 5% (B5) in 2013. Malaysia has mandated the sale and universal use of a B5 blend of biodiesel beginning in 2008, and Thailand has fixed a 3% target share for biodiesel by 2011. In February 2004, the Philippines ordered all government vehicles to use a 1% biodiesel blend in their diesel vehicles. On a smaller scale, numerous municipalities around the world have mandated minimum shares of biodiesel in their bus fleets. Construction of plants for transforming oils and fats into biodiesel has received considerable support from governments. These have included grants and interest-free loans, and in some countries subsidies for the purchase of raw material (ABI, 2005; Biofuels Taskforce, 2005). In addition, many OECD countries apply lower excise taxes on biodiesel than on petroleum diesel, or pay an incentive for each litre of biodiesel placed on the market. Reasons given by governments for these subsidies include maintaining domestic agricultural production and employment, reducing CO2 emissions, and reducing dependence on imported petroleum fuels. It is beyond the scope of this paper to examine cost-effectiveness of current subsidies to biofuels in meeting these objectives.8 European countries currently lead the world in the production of biodiesel, approaching 3 million tonnes a year, though recent heavy investments in Australia, Brazil, India, Malaysia and the United States mean that these countries are poised to become major producers as well (Table 1). Indonesia, one of the world’s leading producers of palm oil (accounting for almost 35% of global production), could also emerge as a major producer of biodiesel.
8
Interested readers are referred to various studies that have examined the cost-effectiveness of biofuels policies in comparison with other means of reducing transport demand for petroleum fuels and reducing greenhouse gas emissions from transport. See, for example, EUCAR, CONCAWE and JRC (2005), Kampman and Boon (2005) and Transportation Research Board (2005).
6
COM/ENV/TD(2005)78/FINAL Table 1. Rough estimates of world production of biodiesel, 2002-07 (‘000 tonnes) Country Canada
2002
2003 1
2004
2005 e
3
3
2006 projected 43
2007 projected
76
2008 projected
83
100
Mexico
—
—
—
—
—
—
—
United States
50
67
83
250
336
499
741
North America
51
70
86
292
412
582
824
Austria
25
32
57
10
41
70
366
357
348
Germany
450
715
1035
Italy
210
273
320
Spain
0
6
13
Sweden
1
1
1
United Kingdom
3
9
9
1073
1544
1935
2200
3000
4000
5200
Czech Rep. Denmark France
60
Slovakia
15
OECD Europe Europe Total Australia
1930
27
27
29
36
187
268
350
Japan
2
2
3
3
3
7
10
Other
—
—
—
—
—
—
—
OECD AsiaPacific
29
29
31
39
190
275
360
neg.
neg.
6
176
238
300
700
Brazil China
neg.
20
45
64
150
337
450
India
neg.
neg.
neg.
neg.
8
50
300
—
—
—
—
135
135
180
Malaysia Philippines
—
—
29
29
58
58
100
Thailand
neg.
neg.
neg.
79
100
100
150
Other
neg.
20
80
348
689
980
1880
Total World
1153
1663
2133
2880
4250
5800
8000
Sources: OECD Secretariat based in part on: ● North America: National Biodiesel Board (www.nbb.com); ● Europe: European Biodiesel Board (www.ebb-eu.org/stats.php); various other sources.
Though biodiesel is as easy to transport as petroleum-derived diesel fuel, international trade in biodiesel is still small. There has been considerable intra-European trade, as suppliers seek out markets with the greatest differential between the after-tax price of petroleum diesel and the tax-exempt price of biodiesel. Japan has also imported small quantities of coconut methyl ester from the Philippines. A rapid increase in traded volumes is foreseen, however, driven by increasing demand for transport fuels in
7
COM/ENV/TD(2005)78/FINAL developing countries, concerns about transport-related pollution, and policies in OECD countries to actively promote the use of biofuels (IEA, 2005; Loppacher and Kerr, 2005). Fediol, Europe’s vegetable oil federation, recently suggested that Asian palm oil could supply up to 20% of the EU’s biodiesel requirements by 2010.9 Recently, the Malaysian Palm Oil Board announced that it would enter into 50:50 joint partnerships with other investors to establish three biodiesel plants, each with an annual capacity of 60 000 tonnes (205 million litres in total). The plants are expected to be completed by the end of 2006 and most of their output will be exported to Europe.10 Over the longer term, Africa and Asia contain a number of countries with considerable potential for benefiting from biodiesel production and trade based on jatropha, a large, fast-growing, drought-resistant perennial shrub the seeds from which yield up to 2700 kilogrammes of raw oil per hectare. Projects to demonstrate the possibilities of producing biodiesel from jatropha have been started or are being planned in at least ten developing countries (Burkina Faso, China Ghana, India, Lesotho, Madagascar, Malawi, South Africa, Swaziland and Zambia). This plant is particularly suitable for growing on land too poor and arid to support food crops, and is also nitrogen-fixing.11 Early experiments in India using simple technologies have already yielded biodiesel that meets the EU norm for biodiesel quality. Statistics on trade and tariffs are hampered by biodiesel’s current classification in the Harmonized System. A recent decision by the WCO’s Harmonized System Committee (35th Session, March 2005) confirmed that biodiesel should be classified under HS 3824.90, which refers to chemical products and preparations of the chemical or allied industries (including those consisting of mixtures of natural products), not elsewhere specified or included. That decision helped in standardising the classification of biodiesel across countries, but did not deal with the problem of lack of specificity: biodiesel shares the same subheading with numerous other chemical products completely unrelated to it. For example, the 2005 edition of the Harmonized Tariff Schedule of the United States lists 25 chemical mixtures at the 10-digit level under 3824.90, ranging from cultured crystals to “electroplating chemical and electroless plating solutions and other materials for printed circuit boards, plastics and metal finishings”. Current applied tariffs on biodiesel are lower than for some other renewable-energy products. Only thirteen countries levy ad valorum tariffs higher than 10%. India tops the list, at 30%, followed by the Maldives (25%) and Ghana (20%). Almost forty countries have bound their tariffs at ad valorem rates of 20% or more, however. Some countries, like Australia, also apply specific rate (i.e., per volume) tariffs on imports. Current applied tariffs on both oil-extraction machinery (HS 8479.20) and crushing machinery (HS 8479.82) are 7% or less in OECD countries but are 15% or higher in ten developing countries. Bound tariffs are much higher, exceeding a rate of 15% in over 50 countries, including several OECD countries. Mozambique and Rwanda have bound their tariffs for this type of equipment at 100%, even though these countries currently apply tariffs of only 5% or zero.
9
“Asian palm oil for euro diesel”, 6 May 2005, www.greencarcongress.com.
10
“Malaysia investing in three palm-oil biodiesel plants”, 29 September 2005, www.greencarcongress.com
11
For example, by some estimates, India has 50 to 130 million hectares of agriculturally marginal and degraded lands (http://www.ecoworld.org/Home/Articles2.cfm?TID=353).
8
COM/ENV/TD(2005)78/FINAL Implications for the environment Many studies have been undertaken on the net environmental impacts of substituting biofuels for fossil fuels, including biodiesel. Those effects can be divided into impacts on air pollutants and greenhouse gas emissions, on waste streams, and on resources used in the cultivation of biofuels. Impacts on air pollutant emissions have perhaps been the most thoroughly studied of all the potential environmental effects of substituting biodiesel for other fuels. Even so, results differ from one test to another, and appear to be affected by a number of variables, depending on the quality of the fuels being compared, the engine used for testing, and ambient conditions (see, e.g., National Traffic Safety and Environment Laboratory, 2004). Table 2, which is provided only for illustrative purposes, shows the changes in life-cycle emissions of air pollutants using 100% biodiesel instead of low-sulphur petroleum diesel (various grades), normalised for differences in fuel efficiency. The emissions shown are those that result mainly from transport, storage and incomplete combustion of biodiesel. While the percentage reductions differ somewhat, depending on what types of biodiesel and grades of petroleum diesel are being compared, two general conclusions can be drawn: emissions of carbon monoxide, volatile organic carbon and particulate matter are reduced when biodiesel is used, whereas emissions of nitrogen oxides are increased (by up to 30% when comparing biodiesel from rapeseed with extra low-sulphur petroleum diesel). Since biodiesel (from whatever source) contains only trace amounts of sulphur, emissions of sulphur dioxide (SO2) are also substantially reduced. Because of biodiesel’s lower sulphur content, and its other superior qualities, such as greater lubricity, engines that use it have a longer operating life. Table 2. Percentage change in full life-cycle air pollutant emissions (as g/km) for 100% biodiesel compared 1 with low, ultra low and extra low-sulphur petroleum diesel Diesel type against which comparison is made, pollutant
Biodiesel from rapeseed
Biodiesel from tallow
Biodiesel from waste cooking oil
Low-sulphur petroleum diesel (LSD)
Ultra lowsulphur petroleum diesel (ULSD)
Extra lowsulphur petroleum diesel (XLSD)
Compared with LSD Carbon monoxide (CO) Nitrogen oxides (NOx) Volatile organic carbon (VOC) Particulate matter (PM)
-27 +6 -32
-37 +5 -35
-47 -5 -50
— — —
-9 -8
-2 +18 +13
-32
-33
-39
—
-20
+24
Compared with ULSD Carbon monoxide (CO) Nitrogen oxides (NOx) Volatile organic carbon (VOC) Particulate matter (PM)
-27 +17 -26
-37 +15 -29
-47 +4 -45
+ +10 +9
— — —
-1 +10 -5
-15
-16
-23
+25
—
-5
Compared with XLSD Carbon monoxide (CO) Nitrogen oxides (NOx) Volatile organic carbon (VOC) Particulate matter (PM)
-26 +30 -22
-36 +28 -26
-46 +16 -42
+2 +22 +15
+1 +11 +5
— — —
-11
-12
-20
+31
+5
—
1. Based on measurements from a non-articulated lorry (“rigid truck”). Source: Biofuels Taskforce (2005), p. 83, based on T Beer, D Olaru, M Van der Schoot, T Grant, B Keating, S Hatfield Dodds, C Smith, M Azzi, P Potterton, D Mitchell, Q Reynolds, J Winternitz, S Kierce, A Dickson, C Short, T Levantis and E Heyhoe E, Appropriateness of a 350 million litre biofuels target, CSIRO, ABARE, and BTRE Report to the Australian Government. Department of Industry Tourism and Resources, Canberra, December 2003.
9
COM/ENV/TD(2005)78/FINAL
Life-cycle reductions in carbon-dioxide (CO2) emissions depend on the source of the feedstock, production pathways, and the assumptions one makes regarding alternative uses of the land from which the feedstock was produced, especially if it had previously been forested. A recent IEA study (2005, Table 3.6) reports “well-to-wheel” reductions in greenhouse gases of between 44% and 63% per kilometre, compared with petroleum diesel, based on studies involving rapeseed methyl ester and soy methyl ester. The European Commission’s more recent “Wells to Wheels” study (EUCAR, CONCAWE and JRC, 2005), concludes that the fossil energy and greenhouse gas (GHG) savings of conventionally produced biofuels such as biodiesel “are critically dependent on manufacturing processes and the fate of by-products”. The GHG balance is particularly uncertain because of nitrous oxide emissions associated with growing oilbearing plants, which are to a large extent dependent on the rate of nitrogen fertiliser application. Nitrogenfixing plants, including legumes like soy, and non-leguminous plants, like jatropha and jojoba, are less problematic in this respect. From a waste-management standpoint, production of biodiesel from used cooking oil or low-grade tallow is environmentally beneficial inasmuch as it provides a cleaner way of disposing of these products than is typically the case. The world consumes each year billions of litres of oil and lard for frying foods, and much of the used oil is discarded into sewage systems, where it adds to the cost of treating effluent or pollutes waterways.12 Efficiently collecting all of this oil from households would be difficult and costly, but the collection and re-use of waste cooking oil generated by restaurants in cities is already commonplace in a large number of cities around the world, especially in the OECD. It may be assumed that the environmental effects of trade liberalisation in the short to medium term would not be high. For one, in the medium-term, demand for biodiesel is likely to be driven by government policy, especially tax policies and laws regulating the minimum shares of liquid biofuels in total transport requirements. If global (pre-tax) prices of petroleum diesel remain high or increase, and relatively cheaper biodiesel from developing countries is able to compete with biodiesel produced in developed countries, total biodiesel consumption might exceed the targets set by the EU and other countries, with consequent benefits for air pollutant and carbon-dioxide emissions. The effects on land requirements of modest increases in trade would depend what oils are used as feedstock. Some new clearing of previously forested land might occur, but there could also be a rearrangement in the global pattern of oilseed production, with more tropical plant oils going into fuel rather than food uses. For every hectare of rapeseed displaced, a slightly smaller area would need to be planted to castor beans, two-thirds of a hectare to Jatropha, or 0.2 hectares in palm oil plantations. Currently, castor bean and jatropha plantations are being started mainly in semi-arid areas on degraded land. Both plants adapt well to semi-arid climates, and a few millimetres of rain each year are all that are necessary for reasonable yields. Environmental impacts associated with seaborne transport of biodiesel are also likely to be moderate. For any shipment, there is always the risk of an accident that leads to large volumes of cargo being spilled. Compared with a spill of petroleum diesel, however, the damage would be less, both because the toxicity of biodiesel to living organisms is less and because it degrades twice as quickly in the environment (Zhang et al., 1998; Zhou et al., 2003). In this respect, it is notable that France classifies biodiesel as a food in its regulations pertaining to the transport of hazardous materials (von Wedel, 1999). Nevertheless, a large spill would harm seabirds and other animals if the biodiesel drifted close to shore, as would a spill of pure vegetable oil. Additional CO2 would be produced during seaborne transport — on the order of 1% to 2% of 12
Although vegetable oils and animal fats biodegrade in water, the biological process uses up oxygen that would otherwise remain available to aquatic organisms.
10
COM/ENV/TD(2005)78/FINAL the CO2 embodied in the fuel — but that could very easily be compensated by the traded fuels having lower life-cycle CO2 emissions than the domestic biodiesel with which it competes. Additional emissions of sulphur dioxide (SO2) will be generated also, but most of these occur at sea and are precipitated out before they reach land. Over the longer term, the potential for the replacement of petroleum diesel by biodiesel is enormous. Current world vegetable oil production is around 100 million tonnes annually, while the demand for diesel is expected to rise to over 1500 million tonnes by 2020. Though additional volumes of recovered cooking oil, tallow and fish oil could be converted into biodiesel, large-scale production of biodiesel would require cultivation of a significant amount of land for feedstock, and some new land not previously cultivated would have to be converted to agriculture, possibly releasing to the atmosphere carbon that had been locked up in the soil. The total area required would be a function of both the total demand not satisfied by tallow and recycled oil, and the oil yield per hectare. Yields vary significantly by crop (Table 2), but also depend on crop variety, climate, natural fertility of the soil, and inputs such as pesticides and fertilisers. These yields will also evolve over time with improvements with advances in technology. Based on typical yields today, the amount of oil that can be harvested from a hectare of rapeseed is seven times what can be squeezed out of a hectare of maize, and the oil yield of hectare of palm oil is five times that of the same area planted to rapeseed. Accordingly, to satisfy a billion litre annual increase in consumption of biodiesel (ignoring any extra consumption of biodiesel needed for crop production), approximately 2 150 square kilometres would have to be planted to oil palm, or 10 700 square kilometres of rapeseed, or 74 200 square kilometres of maize. The latter area is roughly that of Panama. To displace all the diesel fuel consumed in the world in 2000 with plant-derived biodiesel would require areas 1 000 times greater. Even if the fuel were derived entirely from oil palm, 2.15 million square kilometres would be required — roughly equal to the surface area of Saudi Arabia. Consumption of diesel in 2020 is expected to be at least 50% greater than in 2000. Table 3. Average oil yields, land requirements and major producers of oleaginous plants Crop
Maize (corn) Cotton seed Hemp Soybean Linseed (flax) Sesame Safflower Tung oil tree Sunflowers Peanut Opium poppy Rapeseed Olive Castor bean Jojoba Jatropha Macadamia nut Brazil nut Avocado Coconut Oil palm
Litres of feedstock plant oil per hectare 172 325 363 446 478 696 779 940 952 1 059 1 163 1 190 1 212 1 413 1 818 1 892 2 246 2 392 2 638 2 689 5 950
Km2 per 109 litres of mineral diesel displaced 74 252 35 183 28 635 26 718 18 350 16 395 13 587 13 415 12 060 10 981 10 732 10 537 9 038 7 025 6 750 5 686 5 339 4 841 4 749 2 146
Leading producing countries of crop in 2004
USA, China, EU, Brazil, Mexico China, India, USA, Pakistan, Uzbekistan, Brazil Canada USA, Brazil, Argentina, China, India, Paraguay Canada, China, USA, EU India, China, Sudan India, Mexico, Ethiopia, Australlia Russian Federation, Ukraine, Argentina, EU, India China, India, Nigeria, Mynmar (Burma), USA Afghanistan, Turkey EU, China, Canada, India, Australia EU, Syria, Turkey, Tunisia, Morocco Brazil USA, Mexico, Argentina, Israel cultivated in almost all tropical and subtropical countries Australia Brazil Mexico, USA, South Africa, Chile, Spain, Israel Philippines, Indonesia, India, Vietnam, Mexico Malaysia, Indonesia, Nigeria, Thailand, Colombia
Sources: ● oil yields: “Journey to Forever” Web site (http://journeytoforever.org/biodiesel_yield.html#ascend) ● producers of major oil crops: US Foreign Agricultural Services (www.fas.usda.gov/psd/); ● producers of minor crops: various sources.
11
COM/ENV/TD(2005)78/FINAL
The environmental impact of diverting land to the production of oil feedstock for transformation into biodiesel depends on more than yields, however. Some oil-bearing plants, like maize and rapeseed, require large amounts of water and chemical inputs. In many countries, water used in growing crops for the production of biofuels is heavily subsidised, or being mined from aquifers, or both. Other crops, like jojoba and jatropha, require relatively few inputs, and can even halt erosion and improve the quality of the soil in the long term. Cultivation and harvesting practices also matter. All else equal (slope, rainfall conditions, soil type), it is harder to control soil erosion during the planting, cultivation and harvesting of annual field crops than it is from perennial crops harvested from shrubs or trees. Effects on biodiversity due to changes in or loss of habitats will vary considerably, being greater the more dramatic the change — e.g., from mixed, low-intensity agriculture to intensively farmed monocrops, or from tropical rainforest to managed plantations. However, it is important also to recognize that this is not only an issue concerning new production of crops for biofuels. To the extent that current government support policies maintain agricultural land in production, and that land would likely revert to less-intensive agriculture of forest if the support were withdrawn, there is an opportunity cost associated with continuing these policies in the sense that the resulting level of biodiversity is less than it might otherwise be. One of the major concerns expressed about production of feedstock plant oil based on oil-seed palm is that its large-scale expansion could take place at the expense of tropical forests or permanent grasslands. A number of reports have been released in recent years (e.g., Brown and Jacobson, 2005) and various Web portals are raising alarm about the impacts of creating oil-palm plantations on newly cleared rainforest or peat-swamp forests (e.g., www.rainforestweb.org/Rainforest_Destruction/Agribusiness/Palm_Oil/ or www.wrm.org.uy/plantations/palm.html). However, even the critics of oil-palm cultivation acknowledge that As with any other crop, the problem is not the palm itself but the industrial model in which it is being implemented. There are numerous examples — particularly in Africa — to show that this palm can be grown and harvested in an environmentally-friendly manner and that it can serve to fulfill the needs of the local populations in a sustainable and equitable manner.
Companies operating palm-oil plantations are clearly aware of the environmental concerns, and some have endeavoured to improve their performance (Box 1). However, some observers of the expansion of the industry in developing countries (e.g., Hunt et al., 2006, p. 70) contend that responsible environmental behaviour in the production of biofuels cannot be presumed, and that therefore some system of certifying conformity with certain environmental standards, such as net GHG savings, is needed. A voluntary certification system might address some of these concerns with relatively minimal trade effects, though even voluntary schemes can have unintended consequences for market access (OECD, 2005). The European Commission’s Biomass Action Plan (CEC, 2005) goes further than this and specifically calls for establishing a requirement by which “through a system of certificates, only biofuels whose cultivation complies with minimum sustainability standards will count towards the targets” set for the market share of biofuels in total EU transport fuels, adding “The system of certificates would need to apply in a non-discriminatory way to domestically produced biofuels and imports.” While such a scheme would not be directly linked to trade, it could certainly have an impact on imports, as those suppliers not certified could have a harder time finding buyers for their biodiesel. A number of issues on certification to sustainability standards would need to find positive resolution with a view to facilitating trade. Who would set the standards, and on which internationally agreed criteria would they be based? What body would accredit the certifiers, and against which criteria? Would firms or professionals accredited to carry out certification or inspection services in one country be accredited to perform those same services in another?
12
COM/ENV/TD(2005)78/FINAL
Box 1. One Brazilian palm-oil producer’s approach to production and the environment Agropalma, a Brazilian-owned company is investing in production of biodiesel through partnerships with small farmers, mainly in the Amazon region. In one of its programmes, in the state of Pará, around 150 families cultivate oil palms. The project is supported by the government of the state of Pará, the Brazilian Agricultural Research Corporation (Embrapa) and of the Bank of the Amazon (BASA). The basic production model is as follows. Each family receives 12 hectares. Agropalma supplies the saplings, the initial infrastructure and teaches techniques for cultivating the palm. The company endeavours to use biological methods for controlling plant pests and diseases, reducing as much as possible the application of chemical agents. Once the trees bear fruit the company will purchase the whole crop at prices based on foreign market prices. Because the palm tree takes 36 months to produce its first fruit, the BASA is loaning farmers a minimum monthly salary of around USD 130 so that they may live on the farm and purchase the necessary inputs for the crop. The farmers must pay back the total value of the loan (after a grace period of seven years) plus interest, set at 4% a year. Agropalma’s total land holdings cover 82 000 hectares, of which 50 000 hectares are being kept as environmental preservation areas, where the original vegetation is maintained and hunting and fishing are prohibited in order to keep the ecosystem unchanged. When planting new palms, priority is given to degraded areas. Riparian forests, which protect water courses, have been preserved in their entirety. Future implantations, whether by Agropalma or by third parties, will be restricted to areas already considered degraded. All waste resulting from the production of palm fruits is used, as is the waste produced during the extraction of palm oil and palm kernel oil. Empty bunches are used as organic fertiliser in areas where certified organic oil production takes place. Fibres resulting from fruit pressing are used as fuel in steamgenerating boilers, which drive electric turbine-generators; part of the residual vapour is also used for sterilisation and process heat for the oil extraction process. The effluent is used as ferti-irrigation of the palm plantation near the industrial area. No effluent reaches rivers or creeks. Source : Cláudia Abreu, “Biodiesel, the social fuel”, Arab-Brazil News Agency, 1 November 2005 (www.anba.com.br/ingles/especial.php?id=250) and Agropalma’s Web site http://www.agropalma.com.br/en/default.aspx?PortalID=14&TabId=9
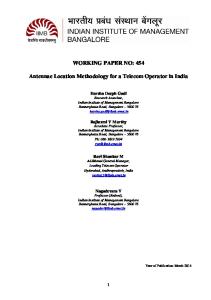
Complementary policies Liberalisation of tariffs on biodiesel would help make the fuel more cost-competitive with petroleum diesel, particularly in countries in which the domestic retail prices of petroleum diesel are in line with world-market prices or higher because of excise taxes. However, there are still at least 40 countries in the world that regulate the domestic retail price of diesel fuel, in some cases at prices far below the free-market price. According to Metschies (2005), as of November 2004 these countries included several sizeable economies, including Egypt, Indonesia, Iran, and Venezuela. Figure 1 shows retail prices for diesel which were below even the price for crude oil on the world market (USD 0.27 per litre at the time) in the ten most-populous countries.
13
COM/ENV/TD(2005)78/FINAL Figure 1. Retail prices for petroleum diesel as of November 2004 in selected countries
Iraq Venezuela Iran Yemen Saudi Arabia Myanmar Egypt Syria Algeria Indonesia 0
2
4
6
8
10
12
14
16
18
20
US cents per litre
Data source: Metschies (2005), p. 63
Reforming retail fuel prices is politically difficult, as those countries that have accomplished it already can attest. (See, for example, the recent experience of Yemen, which has doubled its diesel prices since November 2004, as documented in Metschies (2005).) The case for aligning domestic prices with world prices is strong, nevertheless, quite independent from the effects of low prices on competing renewable fuels. Ensuring that the prices of petroleum substitutes for diesel fuel are not creating a barrier to trade in their renewable substitutes is one more argument for domestic price reform. Solar thermal water heaters The resource and related goods Another market in which there is considerable developing-country participation is solar water heaters, which are covered by HS 8419.19. Using the sun to heat, or pre-heat, water is most cost-effective in areas that receive high levels of insolation — namely, between about 35 south latitude and 35 north latitude — but, depending on climate conditions and the cost of alternatives, it can also compete with or supplement other ways of heating water at latitudes outside this zone. A typical household solar water-heating system consists of one or more collectors, a well-insulated storage tank and, depending on the system, an electric pump. The technologies of the distinguishing component, the collector, vary from the simple to the sophisticated. A flatplate collector, the most common type, runs plastic or copper tubing through an insulated, weather-proofed box. Evacuated-tube collectors are made up of rows of parallel, transparent glass tubes. Concentrating collectors for residential or commercial applications are usually parabolic troughs that use mirrored surfaces to concentrate the sun’s energy onto an absorber tube (called a receiver) containing a heat-transfer fluid.
14
COM/ENV/TD(2005)78/FINAL The potential for growth in solar water heating is large, especially in countries that receive ample sunlight year-round. Israel requires all new homes and apartments to use solar water heating, and over 90% of homes in Cyprus have solar water heaters.13 Production and trade There are hundreds of manufacturers of solar-thermal water heaters in the world. Within the OECD region, manufacturing takes place in almost every member country, including Mexico and Turkey. Elsewhere, at least 32 countries are engaged in the manufacturing of solar water heaters: Argentina, Armenia, Barbados, Brazil, Bulgaria, Chile, China, Croatia, Cuba, Cyprus, Dominica, Egypt, Hong Kong, India, Indonesia, Iran, Israel, Jordan, Lithuania, Macedonia, Malaysia, Morocco, Nepal, Pakistan, Philippines, Russia, Saudi Arabia, Singapore, South Africa, Sri Lanka, Thailand, and the United Arab Emirates. In OECD countries solar water heaters tend to be used in conjunction with back-up, electric or gas water heaters. In other regions of the world, however, solar water heaters are often the sole source of hot water, and are connected to insulated storage tanks. Surprisingly, tariffs on solar water heaters exceed 20% in over 40 WTO member economies, including many whose sunny climates or dispersed rural populations would seem to favour deployment of the technology. Bound rates exceed 20% in over 50 WTO members, including several OECD member countries. Implications for the environment The main environmental result of an increase in the use of solar water heaters is displacement of fuel that would otherwise be consumed directly to heat the water or to run an electric power plant. That energy is not insignificant. In north-temperate, high-income countries water heating is typically the second-most important end-use activity, after space heating or cooling. In Canada, for example, water heating accounts for around 20% of total household energy consumption (Natural Resources Canada, 2005). Less energy is consumed per capita for water heating in middle-income countries, but the share of household energy consumption related to heating water can be considerably greater, and is usually the leading energy enduse. Among the poorest households, especially rural households in developing countries, heated water is often produced with wood-fired water heaters (Box 2) or over open fires. Other environmental impacts of solar water heaters are minor. Water heaters are typically installed on the roofs of buildings, and incremental land requirements are therefore low: the main impacts are aesthetic.
13
http://www.ucsusa.org/clean_energy/renewable_energy_basics/how-solar-energy-works.html
15
COM/ENV/TD(2005)78/FINAL
Box 2. Shifting from Conventional to Solar Water Heaters in India Each year, an additional 15,000 wood-fired water heaters are installed in the Anand District of the Indian state of Gujarat alone. Between 4-6 other districts in Gujarat have similar use levels of wood-fired water heaters. Households usually have 40-liter, wood-fired systems, which cost approximately USD 75 each and provide hot water for about 5 people. Larger households might have a 100-liter capacity system,which costs about USD 130. Women must collect or purchase the firewood, and burning the wood produces significant indoor air pollution. If 6 kg of firewood are used each day, fuel costs would be USD 4 per month.S olar water heaters,on the other hand,have higher capital costs, and generally have a higher capacity, with a minimum of about 100 liters per day. The smallest solar system costs about $375, about 3 times the cost of a wood-fired heater. However, fuel wood costs are saved, and indoor pollution is reduced. [In 2002, funded in part with a grant from the Global Energy Facility’s Small Grants Programme] the Sardar Patel Renewable Energy Research Institute (SPRERI) undertook a survey of more than 55 industrial manufacturers of wood-fired water heaters. The survey collected information about the use pattern, cost, sales and service of these water heaters. An interactive meeting between SPRERI, and manufacturers helped introduce solar water heaters to the manufacturers. In addition,SPRERI identified key users of water heaters, and their needs, and monitored the thermal efficiency and pollution data related to the use of wood-fired water heaters. Two solar-powered systems were obtained from NRG Technologies and Steel Hacks Industries, and SPRERI conducted experiments to assess how these water heaters could meet users’needs. An interactive meeting with users helped develop an appropriate incentive scheme to promote the use of solar water heaters. As a result of these efforts, 12 manufacturers now supply solar water heaters, and 50 solar water heaters have been installed with users contributing about 75% of the cost of the equipment. Each household previously used 5-7 kg of firewood every day for water heating. By replacing this with solar water heaters, households save this amount of firewood, thus reducing carbon dioxide emissions. During approximately two months of the year, solar energy is not sufficient to heat water. During these periods, electricity or LPG [liquefied propane gas] is used to heat water. Source : http://sgp.undp.org/download/SGP_India2.pdf
Complementary policies Penetration of solar thermal water heaters into some markets is hampered by subsidised prices for electricity or natural gas, the main energy sources used for water-heating appliances. Bringing prices into line with costs of delivery is politically difficult, particularly if customers have grown accustomed to subsidised prices over many decades. But reform is important in order to avoid investments in housing stock and related infrastructure taking place in response to distorted signals about long-term resource availability. Geothermal energy The energy source and related technology Geothermal energy refers to energy obtained from the subsurface of the earth. There are many ways in which energy is obtained and transformed into useful heat or electricity. Warm or hot springs have been exploited by people since prehistoric times, mainly for bathing, cooking or washing clothes. Today, geothermally heated water is tapped for many heating and process-heat uses, and forms the basis of district heating systems in several towns or cities in China, France, Hungary, Iceland, Italy, Japan, Poland, Romania, Russia, Sweden, Turkey and the United States. The use of geothermal energy for the production of electricity dates from 1904, when the first plant went into operation in Larderello, Italy. A number of commercial-scale plants are now operating around the world producing electricity from natural
16
COM/ENV/TD(2005)78/FINAL underground sources of steam. Plants tapping into so-called “hot dry rocks” are still largely at the development and demonstration stages. Another geothermal application, involving heat pumps, takes advantage of the thermal mass of the upper three metres of the earth. The ground at this depth maintains a nearly constant temperature (between 10° and 16°C in temperate climates, for example), so that in the winter its temperature is warmer than the air above it, and in the summer it is cooler. Geothermal heat pumps take advantage of this temperature difference to heat and cool buildings. In contrast with high-temperature geothermal resources, which are relatively scarce, the resource represented by warm, shallow ground is globally widespread. The value of any high-temperature geothermal steam resource depends on its temperature, pressure, depth from the surface, and distance from potential users. Within the OECD region, high-temperature geothermal energy is already being exploited in Canada, Iceland, Italy, Japan, Mexico, New Zealand and the United States. Outside the OECD region, areas of known economically exploitable resources can be found in almost 50 countries: • • • • • • • • • •
the Andean volcanic belt (Argentina, Bolivia, Chile, Columbia, Ecuador, Peru, and Venezuela); the Central American volcanic belt (including parts of Costa Rica, El Salvador, Guatemala, Honduras, Nicaragua, and Panama); the Lesser Antilles islands in the eastern Caribbean; the eastern and southern Mediterranean region (e.g., Algeria, Israel, Jordan, and Tunisia); the East Africa Rift System (particularly Djibouti, Ethiopia, Kenya, Malawi, Tanzania, Uganda, and Zambia); the Himalayan geothermal belt (which is over 150 km wide, extending 3000 km through parts of China’s Yunnan Province, India, Myanmar, Thailand, and Tibet); Indonesia; the Philippines; eastern China; the Kamchatka Peninsular of Russia.
The example of the Philippines illustrates how one developing country has benefited from tapping into its geothermal resources. Philippine geothermal fields are large and have been developed at a rapid rate. The main areas of development have been on the island of Luzon, north of Manila, and on the southeast island of Leyte. The Philippines’ first geothermal-electric plant was built in 1979; as of end-2004 the country’s geothermal-electric generating capacity stood at just under 2000 MWe. Among the incentives provided to developers of geothermal sites is an exemption on duties and “compensating tax” on imported machinery, equipment, spare parts and materials used in geothermal operations.14 Geothermal heat in the Philippines is also used directly for processing fish, producing salt and drying coconuts and fruit. Production and trade Assessing trade in, and tariffs on, goods related to geothermal energy is difficult. The main components of a geothermal power plant, besides its electric generator, are: the steam turbine, heat exchangers, condensers, pumps, and the piping and valves that connect them. Almost all of this equipment, apart from the steam turbine, have multiple uses, and are not unique to geothermal plants. Steam turbines typically used in geothermal power applications do differ from those used in other applications, however. In particular, they are designed to operate at lower pressures and temperatures than steam turbines used in conventional steam-generating power plants. But they are not separately identified in the HS, and therefore 14
http://www.doe.gov.ph/geothermal/default.htm
17
COM/ENV/TD(2005)78/FINAL fall, along with other turbines not used for marine propulsion, under either HS 8406.81 or HS 8406.82, depending on whether their rated output, respectively, exceeds, or is equal to or less than, 40 MW. Most countries apply the same tariffs on steam turbines whether they are rated at 40 MW or less or greater than 40 MW. Eleven countries apply tariffs of 15% or greater; many more have bound their tariffs at much higher rates. Goods associated with the direct use of geothermal energy in the form of warm or hot groundwater are not specific to their applications, and are generally the same as for extracting groundwater generally. Some pre-treatment of the water may be required, however, if it contains high concentrations of dissolved salts. A geothermal heat pump (GHP) system consists essentially of three elements: a ground heat exchanger, a heat pump unit, and an air- or water-delivery system (ducts or radiators). The heat exchanger is basically a system of pipes buried in the shallow ground near the building. A fluid (usually water or a mixture of water and a chemical additive to keep the water from freezing) circulates through the pipes, absorbing from, or transferring heat to, the ground. If sold as an entire unit for heating only, these are classified under HS 84.18 (Other refrigerating or freezing equipment; heat pumps) as either HS 8418.61 (Compression type units whose condensers are heat exchangers) or HS 8418.69 (Other). If they incorporate a refrigerating unit and a valve for reversal of the cooling-heating cycle (reversible heat pumps), then they are classified under HS 8415.81. However, these categories are not specific to earth-to-water or earth-to-air heat pumps, and probably are dominated by trade in air-to-water and air-to-air heat pumps. Applied tariffs on reversible heat pumps are low in most OECD countries but exceed 20% in around 60 WTO members. Implications for the environment The environmental benefits of liberalising trade in goods used for the exploitation of geothermal resources would depend on the degree to which the geothermal energy thereby put to use substitutes for other means of producing heat or electricity. Geothermal steam plants emit some pollutants (and noise), but at much lower levels than plants run on fossil fuels. According to the Renewable Energy Policy Project15 (citing Bloomfield et al., 2003), average CO2 emissions per kilowatt-hour emitted by geothermal power plants in the United States are about 85% lower than from natural gas fired plants. Disruptions to the environment may be associated with the construction of the plant sites, the construction and use of access roads, and local land subsidence. Complementary policies As for other renewable-energy based electric power systems, policy changes within countries can have a tremendous influence on the benefits to be gained from liberalising trade in geothermal plants and associated components. The market for renewable-energy based electric-generating technologies is influenced by a wide range of factors related to the way that electricity and competing fuels are priced, and the openness of electricity markets. As the bulk of geothermal electric systems installed in developing countries are likely to be for on-grid use, the most important policies in the short term are probably those regulating services connected with the installation and servicing of the equipment. Policies that reserve domestic fossil fuels for domestic power production (e.g., through price regulation or restrictions on exports) also can distort the relative economic competitiveness of geothermal power plants.
15
http://www.crest.org/geothermal/geothermal_brief_environmental_impacts.html
18
COM/ENV/TD(2005)78/FINAL
REFERENCES
Austrian Biofuels Institute (2005), “Independent review of the European biodiesel market”, in Australian Renewable Fuels Limited (2005), Prospectus, South Perth, Western Australia, pp. 40-62. Biodiesel Advisory Council (2005), Biodiesel: Made in Manitoba, Manitoba Energy Development Initiative, Winnipeg, Manitoba. www.gov.mb.ca/est/pdfs/energy/biodiesel.pdf Biofuels Taskforce (2005), Report of the Biofuels Taskforce to the Prime Minister, Commonwealth of Australia, Barton ACT, Australia. www.dpmc.gov.au/biofuels/final_report.cfm Bloomfield, K., J.N. Moore and R.M. Neilson Jr. (2003), “Geothermal energy reduces greenhouse gases”, GRC [Geothermal Research Council] Bulletin, April 2003. Brown, Ellie and Michael F. Jacobson (2005), Cruel Oil: How Palm Oil Harms Health, Rainforest & Wildlife, Center for Science in the Public Interest, Washington, DC. www.cspinet.org/palmoilreport/ Department of Alternative Energy Development and Efficiency (2005), Renewable Energy in Thailand: Ethanol and Biodiesel, Ministry of Energy, Thailand, Bangkok. EUCAR, CONCAWE and JRC: European Council for Automotive R&D, CONCAWE and the Joint Research Centre of the European Commission (2005), “Well-to-Wheels analysis of future automotive fuels and powertrains in the European context”, WELL-to-WHEELS Report Version 2a, December 2005, http://ies.jrc.cec.eu.int/wtw.html Howell, Steve (2005), “Time to take the biodiesel plunge?”, Render, February, pp. 11-14. www.rendermagazine.com/February2005/BiodieselPlunge.pdf Hunt, Suzanne C. and Janet L. Sawin, with Peter Stair (2006), “Cultivating renewable alternatives to oil”, Chapter 4 in State of the World 2006, The Worldwatch Institute, Washington, D.C., pp. 61-77. IEA: International Energy Agency (2004a), Renewable Energy: Market & Policy Trends in IEA Countries, OECD Publications, Paris. IEA (2004b), Renewable Information 2004, OECD Publications, Paris. IEA (2005), Biofuels for Transport, OECD Publications, Paris. Kampman, Bettina E. and Bart H. Boon (2005), “Cool cars, fancy fuels: A review of technical measures and policy options to reduce CO2 emissions from passenger cars”, CE Delft, Delft, Netherlands, www.ce.nl/eng/index.html Kerr, William A. and Laura J. Loppacher (2005), “Trading biofuels — will international trade law be a constraint?”, Current Agriculture, Food & Resource Issues, No. 6, pp. 50-62.
19
COM/ENV/TD(2005)78/FINAL Loppacher, Laura J. and William A. Kerr (2005), “Can biofuels become a global industry?: government policies and trade constraints”, CEPMLP Internet Journal, Vo. 15, Article 15, www.dundee.ac.uk/cepmlp/journal/html/Vol15/article15_10.html Metschies, Gerhard P. (2005), International Fuel Prices 2005, 4th Edition, Deutsche Gesellschaft für Technische Zusammenarbeit (GTZ) GmbH, Eschborn, Germany. www.gtz.de/fuelprices National Traffic Safety and Environment Laboratory (2004), “FY2003 Fact-Finding Survey concerning Exhaust Gases of New Fuels: Report on Results of Testing”, Ministry of Environment, Tokyo, Japan. www.env.go.jp/en/pol/exhaust-gas/index.html Natural Resources Canada (2005), Energy Use Data Handbook, 1990 and 1997 to 2003, Office of Energy Efficiency, Natural Resources Canada, Gatineau, Quebec, Canada. http://oee.nrcan.gc.ca/corporate/statistics/neud/dpa/data_e/handbook05/datahandbook2005.pdf OECD (2001), Environmental Goods and Services: The Benefits of Further Global Trade Liberalization. OECD Publications, Paris. OECD (2005), Environmental Requirements and Market Access, OECD Publications, Paris. Steenblik, Ronald (2005), “Liberalisation of Trade in Renewable-Energy Products and Associated Goods: Charcoal, Solar Photovoltaic Systems, and Wind Pumps and Turbines”, OECD Trade and Environment Working Paper No. 2005-07, Paris, France., www.oecd.org/trade/ Transportation Research Board (2005), Integrating Sustainability into the Transportation Planning Process, Proceedings of the Conference on Introducing Sustainability into Surface Transportation Planning (Baltimore, Maryland, 11-13 July 2004), Sponsored by the Transportation Research Board, Federal Highway Administration and U.S. Environmental Protection Agency, Washington, D.C., www.TRB.org von Wedel (1999), Technical Handbook for Marine Biodiesel In Recreational Boats, 2nd edition, Prepared for the National Renewable Energy Laboratory by CytoCulture International, Inc., Point Richmond, California, http://www.cytoculture.com/Biodiesel%20Handbook.htm Zhang X., C. Peterson, D. Reece, R. Haws, and G. Moller (1998), “Biodegradability of biodiesel in the aquatic environment”, Transactions of the ASAE, Vo. 41 (5), pp. 1423-1430. Zhou, P.L., A.M. Fet, O. Michelsen and K. Fet (2003), “A feasibility study of using biodiesel in recreational boats in the UK”,
20
COM/ENV/TD(2005)78/FINAL
Annex Table 1. HS sub-headings for biodiesel and goods associated with the harnessing of solar-thermal and geothermal energy HS heading or subheading
Product description [renewables component]
38.24
Products, preparations and residual products of the chemical or allied industries, incl. those consisting of mixtures of natural products, n.e.s . (excl. binders for foundry moulds and cores; naphthenic acids, their water-insoluble salts and their esters; non-agglomerated metal carbides mixed together or with metallic binders; prepared additives for cements, mortars and concretes; nonrefractory mortars and concretes; sorbitol).
3824.90 (ex)
– Other. [Biodiesel and waste fats and oil suitable as a fuel.]
84.06
Steam turbines and other vapour turbines.
8406.81 (ex)
– Other turbines, of an output exceeding 40 MW [Low-temperature and low-pressure steam turbines for use in a geothermal power plant.]
8406.82 (ex)
– Other turbines, of an output not exceeding 40 MW [Low-temperature and low-pressure steam turbines for use in a geothermal power plant.]
8406.90 (ex)
– Parts [Parts for low-temperature and low-pressure steam turbines for use in a geothermal power plant.]
84.18
Refrigerators, freezers and other refrigerating or freezing equipment, electric or other; heat pumps other than air conditioning machines of heading 84.15.
8418.61
– Other refrigerating or freezing equipment; heat pumps : compression type units whose condensers are heat exchangers [Geothermal heat-pump systems]
8418.69
– Other refrigerating or freezing equipment; heat pumps : other [Geothermal heat-pump systems]
84.19
Machinery, plant or laboratory equipment, whether or not heated (excluding furnaces, ovens and other equipment of heading 85.14), for the treatment of materials by a process involving a change of temperature such as heating, cooking, roasting, distilling, rectifying, sterilising, pasteurising, steaming, drying, evaporating, vaporising, condensing or cooling, other than machinery or plant of a kind used for domestic purposes; instantaneous or storage water heaters, non-electric.
8419.19 (ex)
– Instantaneous or storage water heaters, non-electric : other [Solar water heaters.]
8419.50 (ex)
– Heat exchange units [Heat-exchange units for solar-thermal or geothermal applications.]
90.32
Machines and mechanical appliances having individual functions, not specified or included elsewhere in this Chapter. – Machinery for the extraction or preparation of animal or fixed vegetable fats or oils. [Biodiesel refineries.] Mixing, kneading, crushing, grinding, screening, sifting, homogenising, emulsifying or stirring machines [Machines for crushing and filtering oil seeds.] Automatic regulating or controlling instruments and apparatus.
9032.89
– Other instruments and apparatus : Other [Heliostats.]
84.79 8479.20 (ex) 8479.82
Source: OECD Secretariat, based on the 2002 edition of the Harmonized System.
21
COM/ENV/TD(2005)78/FINAL Annex Table 2. Leading exporters of, and highest tariffs applied to, renewable energy and renewable-energy technologies Product (HS code)
Leading exporters, 2004
Export value ($000)
Importers with the highest level of duty
Applied tariff in %
Data year
Bound rate %
Biodiesel (ex-out of HS 382490)* Fuel wood (HS440110)
World OECD countries Latvia Croatia Estonia South Africa Russian Federation Slovenia Bulgaria Belarus Lithuania Romania
Wood charcoal (HS440200)
Hydraulic turbines < 1 MW (HS 841011)
World OECD countries of which Mexico
151 058 90 689 10 064 8 662 8 145 5 884 4 314 3 494 3 281 3 210 2 919 2 857
25 9312 119 736 5 895
China Argentina South Africa Malaysia Bulgaria Paraguay
39 067 18 576 16 646 11 450 8 955 7 047
Singapore Brazil Romania Latvia World OECD countries of which Turkey Mexico
6 171 5 523 4 817 4 261 33 793 31 050
China India Slovenia
90 61 721 653 430
22
China Romania Ghana Malaysia Mexico Papua New Guinea Sierra Leone United States Belarus Maldives Nigeria Russian Federation Jamaica Sri Lanka
70 30 20 20 20 20
2004 1999 2002 2001 2004 2004
7 30 -20 35 90
20 20 15 15 15 15
2004 2004 2001 2002 2003 2001
50 0 -30 ---
10 10
2001 2001
50 --
China Cameroon Gabon Morocco Maldives Zambia Egypt Malaysia Mexico Papua New Guinea
70 30 30 25 25 25 24 20 20 20
2004 2001 2000 2002 2002 2001 1997 2001 2004 2004
10.5 -15 40 30 -20 20 35 90
60 35 27.5 25 24 18 16 15
1999 2004 2004 2002 1997 2003 2003 2001
50 10 3.8 25 20 -27 --
Bangladesh China United States India Egypt Gambia, The Slovenia Belarus
COM/ENV/TD(2005)78/FINAL
Product (HS code)
Leading exporters, 2004 Argentina Aruba
Hydraulic turbines > 1 MW but < 10 MW (HS 841012)
Hydraulic turbines > 10 MW (HS 841013)
Parts for hydraulic turbines, incl. regulators (HS 841090)
Export value ($000) 241 150
Brazil Russian Federation Ecuador Peru Estonia World OECD countries of which Mexico
112 80 76 62 44 28 470 21 434
Slovenia China Brazil India Peru El Salvador Bulgaria Malaysia Singapore World OECD countries of which Mexico
3 006 1 452 857 794 557 303 64 3 0 23 250 19 663
2
218
India Russian Federation China Slovenia Bulgaria Brazil Peru Singapore Turkey South Africa World OECD countries of which Mexico
962 669 605 520 470 265 32 24 3 0 427 833 331 061
Slovenia Brazil Russian Federation China Romania Israel Singapore
22 797 15 084 13 584 12695 9 938 3 399 3 163
3 773
23
Importers with the highest level of duty Romania Russian Federation Venezuela Colombia Slovak Republic
Applied tariff in % 15 15
Data year
Bound rate %
1999 2001
35 --
15 15 15
2003 2004 2003
35 35 7
Djibouti United States India Egypt Slovak Republic Venezuela Colombia Cameroon European Union Nigeria Poland
33 27.5 25 24 24 15 15 10 10 10 9
1999 2004 2002 1997 2003 2003 2004 2001 2004 2003 2003
40 3.8 25 20 7 35 35 -8.25 -9
China Rwanda United States India Egypt Slovak Republic Venezuela Nigeria Poland European Union Czech Republic
35 30 27.5 25 24 24 15 10 9 8 7
2004 2003 2004 2002 1997 2003 2003 2003 2003 2004 2003
10 100 3.8 25 20 7 35 -9 8.6 7
Bangladesh China Djibouti United States India Egypt Slovak Republic Maldives Gambia, The Belarus Romania
60 35 33 27.5 25 24 24 20 18 15 15
1999 2004 1999 2004 2002 1997 2003 2002 2003 2001 1999
-6 40 3.8 25 20 4.8 30 --15
COM/ENV/TD(2005)78/FINAL
Product (HS code)
Leading exporters, 2004 India
Heat pumps, incorporating a refrigerating unit (HS 841581)
Malaysia Argentina World OECD countries of which Turkey Korea China Singapore Hong Kong, China Malta Oman Tunisia Malaysia India Russian Federation Slovenia
Heat pumps, compression type units (HS 841861)
Instantaneous or storage water heaters, non-electric, non gas (HS 841919)
World OECD countries of which Korea
Export value ($000) 2 841 2 813 2 580 1 451 632 1 013 320 61 530 4 834 384 855 20 644 5 516 5 355 4 126 3 434 3 210 2 349 1 981 880
3 615 381 3 177 101 6 336
China Brazil Hong Kong, China Singapore
368 954 17 850 16 113 8 710
Belarus Russian Federation Lithuania Chinese Taipei Slovenia Malaysia World OECD countries of which Mexico Turkey Korea
3 420 3 355 3 263 3 236 2 815 2 798 939 384 893 613 223 501 3 411 2 936
Israel
18 201
China
10 148
24
Importers with the highest level of duty Russian Federation Rwanda
Applied tariff in % 15
Data year
Bound rate %
2001
--
15
2003
100
110 100 64 45 40 35 33 32.25 30 30 30
2004 1999 1997 2003 1998 2004 1999 2004 2001 2000 2002
17.5 -60 -80 0.5 40 --15 70
30 30 30 30 30 30 30
2003 1999 2004 2002 2004 2003 2004
6 30 -40 20 65 50
China Bangladesh Nigeria Tunisia Zimbabwe United States Djibouti St. Kitts and Nevis Malaysia Thailand Sierra Leone
110 60 45 43 42.5 35 33 30
2004 1999 2003 2004 2002 2004 1999 2002
10 ----0 40 70
30 30 30
2001 1999 2004
30 30 50
China Bangladesh Egypt United States Tunisia Djibouti St. Kitts and Nevis Rwanda
100 80 59 45 34.75 33 30
2004 1999 1997 2004 2004 1999 2002
35 -55 0 -40 81.5
30
2003
100
China Bangladesh Egypt Nigeria Solomon Islands United States Djibouti Tunisia Cameroon Gabon St. Kitts and Nevis Rwanda Thailand Cuba India Jordan Malawi Sierra Leone
COM/ENV/TD(2005)78/FINAL
Product (HS code)
Oil extraction machinery (HS 847920)
Leading exporters, 2004 New Caledonia India Slovenia Singapore Malaysia Argentina Chinese Taipei South Africa World OECD countries of which Turkey Malaysia India Singapore China Argentina Peru Brazil Colombia Belarus Russian Federation
Oilseed crushing machinery (HS 847982)
Windpowered electric generators (HS 850231)
Export value ($000) 5 366 2 461 2 323 1 617 1 309 872 727 614 368 447 260 704 6704 59289 12539 10253 6582 5103 3973 2913 2772 2024 1109
World OECD countries of which Korea, Rep. Mexico Turkey
1 758 203 1 608 376
Chinese Taipei China Singapore Hong Kong, China Malaysia Brazil Slovenia Argentina South Africa Pakistan World OECD countries of which Denmark Mexico
52 722 31 145 14 200 8 108 5 790 5 421 5 170 3 762 3 419 3 134 1 106 471 1 102 186
Brazil
44 384 8 001 4 638
888 221 160 1 185
25
Importers with the highest level of duty St. Lucia Morocco
Applied tariff in % 27.5 26.25
Data year
Bound rate %
2002 2002
71.5 40
Bangladesh United States China India Slovak Republic Pakistan Sri Lanka Solomon Islands Cameroon Egypt Nigeria Romania Venezuela Cuba Kyrgyz Republic Slovenia
60 35 30 25 24 20 15 10 10 10 10 10 10 10 10 10
1999 2004 2004 2002 2003 2002 2001 1998 2001 1997 2003 1999 2003 2004 2003 2003
-0 10 25 4.8 -25 80 -10 -35 35 10 10 27
Bangladesh United States Djibouti China India Slovak Republic Maldives Jordan Mexico Slovenia
60 35 33 30 25 24 20 15 13 12
1999 2004 1999 2004 2002 2003 2002 2004 2004 2003
-0 40 7 40 4.8 30 15 35 12
United States China India Thailand Slovak Republic Nigeria
35 30 25 20 17 15
2004 2004 2002 1999 2003 2003
1.25 8 25 -4 --
COM/ENV/TD(2005)78/FINAL
Product (HS code)
Leading exporters, 2004 India Malaysia Singapore China South Africa Senegal Russian Federation New Caledonia Hong Kong, China
Photo-sensitive semiconductor devices, including photovaltaic cells, light emiting diodes (HS 854140)
World OECD countries of which Korea Mexico Chinese Taipei Hong Kong, China Malaysia China Singapore India South Africa Russian Federation Cyprus Croatia
Export value ($000) 1 174 918 591 197 79 42 29 14 13 12 826 249 8 820 912 317 324 81 645 1 175 287 895 463 792 974 644 213 316 252 85 036 57 810 10 692 8 935 6 044
Importers with the highest level of duty Romania Cameroon Egypt Chinese Taipei Venezuela Cuba Indonesia Malawi Tunisia
Bangladesh Djibouti United States Rwanda China Maldives Egypt Belarus Russian Federation Sierra Leone
Applied tariff in % 15 10 10 10 10 10 10 10 10
Data year
Bound rate %
1999 2001 1997 2003 2003 2004 2002 2003 2004
35 -10 10 20 11 40 -43
100 33 32 30 30 25 24 20 20
1999 1999 2004 2003 2004 2002 1997 2001 2001
-40 0 100 0 30 0 ---
20
2004
50
-- = unbound or not applicable. Source : OECD UN Comtrade (trade flows), WTO Integrated Database (IDB) - applied and bound tariff rates. All accessed through the World Integrated Trade Solution (WITS), http://wits.worldbank.org/. * As explained on page 7 in the text, the WCO confirmed that biodiesel should be included as an ex-out of HS 3824.90. For this reason, trade flow data are not available on a harmonised basis. Bound and applied tariffs for the large OECD markets vary between 0 and 7%. Tariffs applied by developing countries are generally between 15 and 50%.
26