ORIGINAL CONTRIBUTION
Health-Related Quality of Life of Severely Obese Children and Adolescents Jeffrey B. Schwimmer, MD Tasha M. Burwinkle, MA James W. Varni, PhD
O
BESITY IS ONE OF THE MOST
common chronic disorders in childhood and its prevalence continues to increase rapidly. There is a growing awareness of the long-term health complications of obesity in children and adolescents, yet many pediatricians do not offer treatment to obese children and adolescents in the absence of comorbid conditions.1 However, the most widespread consequences of childhood obesity may be psychosocial.2 Obese children and adolescents are at risk for psychological and social adjustment problems, including lower perceived competencies than normative samples on social, athletic, and appearance domains, as well as overall self-worth.3 While aspects of self-esteem may predict psychological adjustment, including depressive symptoms,4-6 healthrelated quality of life (QOL) is a more comprehensive and multidimensional construct, and includes physical, emotional, social, and school functioning.7 Although pediatricians believe that being overweight in childhood or adolescence affects future QOL,8 there is little existing information about the health-related QOL of obese children and adolescents. In contrast, numerous studies have been conducted in obese adults and have demonstrated lower health-related QOL than among nonobese adults. 9,10 However, the health-related QOL differences in adults See also pp 1805 and 1851.
Context One in 7 US children and adolescents is obese, yet little is known about their health-related quality of life (QOL). Objective To examine the health-related QOL of obese children and adolescents compared with children and adolescents who are healthy or those diagnosed as having cancer. Design, Setting, and Participants Cross-sectional study of 106 children and adolescents (57 males) between the ages of 5 and 18 years (mean [SD], 12.1 [3] years), who had been referred to an academic children’s hospital for evaluation of obesity between January and June 2002. Children and adolescents had a mean (SD) body mass index (BMI) of 34.7 (9.3) and BMI z score of 2.6 (0.5). Main Outcome Measures Child self-report and parent proxy report using a pediatric QOL inventory generic core scale (range, 0-100). The inventory was administered by an interviewer for children aged 5 through 7 years. Scores were compared with previously published scores for healthy children and adolescents and children and adolescents diagnosed as having cancer. Results Compared with healthy children and adolescents, obese children and adolescents reported significantly (P⬍.001) lower health-related QOL in all domains (mean [SD] total score, 67 [16.3] for obese children and adolescents; 83 [14.8] for healthy children and adolescents). Obese children and adolescents were more likely to have impaired health-related QOL than healthy children and adolescents (odds ratio [OR], 5.5; 95% confidence interval [CI], 3.4-8.7) and were similar to children and adolescents diagnosed as having cancer (OR, 1.3; 95% CI, 0.8-2.3). Children and adolescents with obstructive sleep apnea reported a significantly lower health-related QOL total score (mean [SD], 53.8 [13.3]) than obese children and adolescents without obstructive sleep apnea (mean [SD], 67.9 [16.2]). For parent proxy report, the child or adolescent’s BMI z score was significantly inversely correlated with total score (r=−0.246; P = .01), physical functioning (r=−0.263; P⬍.01), social functioning (r=−0.347; P⬍.001), and psychosocial functioning (r=−0.209; P = .03). Conclusions Severely obese children and adolescents have lower health-related QOL than children and adolescents who are healthy and similar QOL as those diagnosed as having cancer. Physicians, parents, and teachers need to be informed of the risk for impaired health-related QOL among obese children and adolescents to target interventions that could enhance health outcomes. www.jama.com
JAMA. 2003;289:1813-1819
vary by sex and body mass index (BMI), and are not consistent across all domains tested.11 Further, while physical func-
tioning and overall health-related QOL scale scores are consistently lower in obese adults, emotional functioning and
Author Affiliations: Division of Pediatric Gastroenterology, Hepatology, and Nutrition, School of Medicine (Dr Schwimmer), University of California, San Diego; Center for Child Health Outcomes (Ms Burwinkle), Children’s Hospital and Health Center (Dr Schwimmer and Ms Burwinkle), San Diego, Calif; and Departments of Architecture and Medicine, Texas A&M University, College Station (Dr Varni). Financial Disclosure: Dr Varni holds the copyright
for PedsQL 4.0. He receives financial compensation from the Mapi Research Institute, which is a nonprofit research institution that charges distribution fees to for-profit companies for use of the Pediatric Quality of Life Inventory. Corresponding Author and Reprints: Jeffrey B. Schwimmer, MD, University of California, 200 W Arbor Dr, San Diego, CA 92103 (e-mail: jschwimmer @ucsd.edu).
©2003 American Medical Association. All rights reserved.
(Reprinted) JAMA, April 9, 2003—Vol 289, No. 14 1813
PEDIATRIC OBESITY AND HEALTH-RELATED QOL Comparison Groups
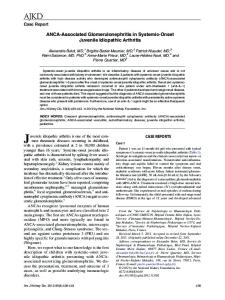
Table 1. Demographic and Clinical Characteristics* No. (%) of Children and Adolescents Characteristic Report Self Parent proxy Age, mean (SD), y Socioeconomic status, mean (SD)† BMI, mean (SD) BMI z score, mean (SD) Sex Male Female Ethnicity White non-Hispanic Hispanic Black non-Hispanic Asian/Pacific Islander American Indian/Alaskan Native Other Unknown Maternal marital status Single Living with someone Married Divorced Separated
Obese
Healthy
Cancer
106 105 12.1 (3.0)
401 389 10.9 (3.3)
106 104 11 (4.3)
35.6 (14.5) 34.7 (9.3) 2.6 (0.5)
NA NA NA
35.3 (16.5) NA NA
57 (54.0) 49 (46.0)
182 (45.4) 219 (54.6)
57 (54.0) 49 (46.0)
28 (26.4) 63 (59.4) 8 (7.5) 1 (0.9) 0 (0) 6 (5.7) 0 (0)
124 (30.9) 205 (51.1) 20 (5.0) 11 (2.7) 4 (1.0) 20 (5.0) 17 (4.2)
38 (35.8) 47 (44.3) 3 (2.8) 3 (2.8) 1 (0.9) 12 (11.3) 2 (1.9)
11 (10.4) 5 (4.7) 60 (56.6) 7 (6.6) 13 (12.3)
57 (14.2) 11 (2.7) 221 (55.1) 23 (5.7) 21 (5.2)
10 (9.4) 5 (4.8) 74 (70.5) 9 (8.6) 7 (6.7)
3 (2.8) 7 (6.6)
4 (1.0) 64 (16.0)
Widowed Unknown
0 (0) 0 (0)
Abbreviations: BMI, body mass index; NA, data not available. *The primary analysis is between the obese and healthy samples. The cancer sample is included for descriptive analysis only. Healthy data7 and cancer data13 are adapted from published data. †The cancer and obese samples had a low-to-middle class socioeconomic status (calculated using the Hollingshead index).
Published pediatric QOL inventory reference data were used for comparison.7,13 The primary comparison was with healthy children and adolescents aged 5 to 18 years, who were recruited from private practice pediatrician offices and community health clinics.7 These children and adolescents had scores similar to more than 8000 healthy children and adolescents in a study in progress (unpublished data, 2003) and are therefore thought to be representative of healthy children and adolescents in California. As a secondary comparison, children and adolescents diagnosed as having cancer and who were receiving chemotherapy (including induction and maintenance) were recruited at 2 large children’s hospitals and were considered representative of pediatric cancer patients receiving chemotherapy at those hospitals. These cancer patients were used because they reported the lowest scores of any chronic illness group assessed with a pediatric QOL inventory.13 Demographic characteristics for the healthy children and adolescents and those diagnosed as having cancer are presented in TABLE 1. Procedure
mental health domains have not been found to be uniformly lower than in healthy adults.10 We hypothesized that obese children and adolescents, when compared with healthy children and adolescents, would have worse healthrelated QOL findings as seen in other pediatric chronic health conditions.7,12-14 We also hypothesized that greater BMI values would correlate with lower overall health-related QOL. Finally, to establish a clinical context for the health-related QOL of obese children and adolescents, we compared health-related QOL of obese children and adolescents with that of children and adolescents diagnosed as having cancer and who were receiving chemotherapy.13 We chose cancer because it is a chronic health condition with known impaired health-related QOL. 1814
METHODS Subjects
A pediatric QOL inventory (PedsQL 4.0) generic core scale was used as the measure of health-related QOL. Obese children and adolescents between the ages of 5 and 18 years, who were newly referred to pediatric gastroenterology or nutrition clinics at Children’s Hospital and Health Center (San Diego, Calif) for the evaluation of obesity between January and June 2002, were recruited. Exclusion criteria were genetic syndromes associated with obesity, cerebral palsy, spina bifida, hypothyroidism, and living in a group home or institutionalized facility. Written parental informed consent and child assent were obtained prior to participation in the study. University of California (San Diego) and Children’s Hospital institutional review boards approved the research protocol.
JAMA, April 9, 2003—Vol 289, No. 14 (Reprinted)
Anthropometrics. Height was measured to the nearest 1 mm using a wallmounted stadiometer and weight was measured to the nearest 0.1 kg using a balance scale. Body mass index was calculated as the weight in kilograms divided by the height in meters squared. Obesity was defined as a BMI in the 95th percentile or higher for age and sex.15,16 The BMI z scores were calculated to compare subjects across age and sex. Comorbid Conditions. A medical history, physical examination, and laboratory evaluation were performed based on expert committee recommendations.17 The obesity-related comorbid conditions assessed were diabetes mellitus, obstructive sleep apnea (OSA), tibia vara, polycystic ovary syndrome, nonalcoholic fatty liver disease, fasting hyperinsulinemia (fasting serum insulin ⬎20
©2003 American Medical Association. All rights reserved.
PEDIATRIC OBESITY AND HEALTH-RELATED QOL
µU/mL [143.5 pmol/L]), and dyslipidemia (triglycerides ⬎130 mg/dL [⬎1.47 mmol/L]; high-density lipoprotein cholesterol ⬍38 mg/dL [⬍0.98 mmol/L]; and/or total cholesterol ⬎200 mg/dL [⬎5.18 mmol/L]). Polycystic ovary syndrome was diagnosed on the basis of anovulation and hyperandrogenism. For the purposes of this study, nonalcoholic fatty liver disease included suspected nonalcoholic fatty liver disease (elevated serum alanine aminotransferase, imaging evidence of steatosis, and a negative serological evaluation), biopsy-proven fatty liver, and biopsyproven nonalcoholic steatohepatitis. A subject was deemed to have a specific obesity-related comorbid condition if he/ she had a preexisting diagnosis or the diagnosis was established during the evaluation of obesity. Subjects were also assessed for a history of asthma and for psychiatric disorders because previous studies have suggested a relationship with obesity.18,19 Subjects were determined to have a psychiatric disorder if there was a preexisting diagnosis or if the medical evaluation led to referral for a suspected psychiatric disorder. Health-Related QOL. The pediatric QOL inventory generic core scales comprise parallel child self-reports and parent proxy reports. Parents, children, and adolescents completed a QOL inventory separately. Separate reports are used because child selfreports are based on perceptions of internal states, whereas parent reports reflect the child’s observable behaviors. In addition, it is often the parent’s perception of a child’s health status that influences health care use.20,21 A QOL inventory was self-administered for parents and for children and adolescents aged 8 to 18 years and administered by an interviewer for children aged 5 to 7 years. It was available in either English or Spanish based on the subject’s stated preference. The family information form was completed by a parent to provide demographic characteristics (race, socioeconomic status [SES]) and school impact. Socioeconomic status was calculated using the Hollingshead index.22
The 23-item pediatric QOL inventory generic core scales encompass physical functioning (8 items), emotional functioning (5 items), social functioning (5 items), and school functioning (5 items).7,23 A 5-point response scale was used (0 = never a problem; 4 = almost always a problem). Items are reverse-scored and linearly transformed to a zero to 100 scale (0=100, 1=75, 2=50, 3=25, 4=0), so that higher scores indicate better health-related QOL. A total scale score (derived by the mean of all 23 items) and a psychosocial health summary score (composed of the mean of items in the emotional, social, and school functioning subscales) are calculated to provide a summary of the child or adolescent’s health-related QOL. The total scale score for both child self-report and parent proxy report has been demonstrated to approach or exceed a Cronbach ␣ reliability coefficient of .90, which is recommended for individual patient analysis24,25 and that makes the total scale score suitable as a summary score for the primary analysis of health-related QOL outcome in clinical trials and other group comparisons. If there are significant differences between groups for the total scale score, secondary analysis may be done using the physical health scale and the psychosocial health summary scores. The individual emotional, social, and school functioning subscales are recommended to examine specific domains of functioning for descriptive analyses because they have the lowest reliability coefficients of all the QOL inventory scores, although in general they exceed the minimum of .70 recommended for group analysis. These recommendations are meant to base the primary analysis on the most reliable scale scores, while also controlling for the number of statistical tests conducted to reduce type I error.
the scale means for the obese and healthy samples divided by the SDs of the healthy sample. Effect sizes were designated as small (0.20), medium (0.50), and large (0.80).28 Impaired health-related QOL was defined as a score that was more than 1 SD below the healthy sample mean. Odds ratios (ORs) were calculated to determine the likelihood of obese children and adolescents having impaired healthrelated QOL for both total scale and subscale scores compared with healthy children and adolescents and those diagnosed as having cancer. We explored the independent and group contributions of demographic variables to health-related QOL scores. Differences in health-related QOL scores for sex and ethnicity were explored using a t test and a 1-way analysis of variance. A Bonferroni correction was used to account for multiple comparisons, resulting in an adjusted ␣ significance level of .007. All t tests reported met this adjusted level of significance. Pearson correlations were conducted for age and SES. We also conducted a stepwise multiple regression analysis, with the child selfreport total score as the dependent variable and age, sex, SES, and ethnicity as independent variables. The influence of the degree of obesity was explored by analyzing Pearson correlations between BMI z scores and QOL inventory scores. Scores for obese children and adolescents with and without obesity-related comorbid conditions were also compared using the t test. Statistical analyses were conducted using SPSS statistical software. 29 Responses were pooled across languages and ages as previously validated for both self-report and proxy report.7
Data Analysis
Inclusion criteria were met by 108 of 115 children and adolescents evaluated for obesity. Of these 108, 2 children or adolescents and 3 parents declined to participate. Table 1 presents the clinical characteristics of the 106 children and adolescents who completed a
We compared QOL scores using independent sample t tests.26,27 To determine the magnitude of the differences between healthy and obese children and adolescents, effect sizes were calculated by taking the difference between
©2003 American Medical Association. All rights reserved.
RESULTS Clinical Characteristics
(Reprinted) JAMA, April 9, 2003—Vol 289, No. 14 1815
PEDIATRIC OBESITY AND HEALTH-RELATED QOL
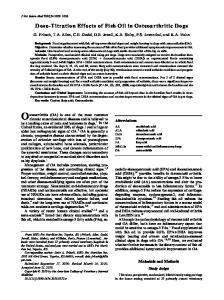
Table 2. Generic Quality of Life Core Scales for Obese and Healthy Children and Adolescents Healthy*
Obese
Child self-report total score Physical health score Psychosocial health score Emotional functioning Social functioning School functioning Parent proxy report total score Physical health score Psychosocial health score Emotional functioning Social functioning School functioning
No. of Items 23 8
No. of Individuals 106 106
Mean (SD) 67.0 (16.3) 71.0 (18.8)
No. of Individuals 401 400
Mean (SD) 83.0 (14.8) 84.4 (17.3)
Difference 16.0 13.4
Effect Size† 1.08 0.78
df 505 504
t Test‡ −9.66 −6.97
15 5 5 5 23 8 15 5 5 5
106 106 105 106 105 105 105 105 105 105
64.9 (17.7) 63.2 (20.1) 67.5 (25.0) 64.1 (20.4) 63.3 (19.2) 63.6 (24.0) 63.1 (18.6) 60.9 (21.7) 67.2 (26.1) 61.4 (21.5)
399 400 399 386 388 389 388 388 388 377
82.4 (15.5) 80.9 (19.6) 87.4 (17.2) 78.6 (20.5) 87.6 (12.1) 89.1 (16.0) 86.7 (12.9) 82.2 (18.4) 92.5 (13.1) 85.5 (17.0)
17.5 17.7 19.9 14.5 24.3 25.5 23.6 21.3 25.3 24.1
1.13 0.90 1.16 0.71 2.01 1.60 1.83 1.16 1.93 1.42
503 504 502 490 491 492 491 491 491 480
−9.99 −8.18 −9.54 −6.45 −15.89 −12.90 −14.99 −10.13 −13.73 −12.10
*Adapted from published data.7 †Designated as small (0.20), medium (0.50), and large (0.80). ‡All values are significant at the P⬍.001 level.
QOL inventory and who are included in the analysis. The mean (SD) BMI was 34.7 (9.3). A majority (65.1%) of the sample had 1 or more obesity-related comorbid conditions: diabetes mellitus (3.8%), OSA (6.6%), tibia vara (1.9%), polycystic ovary syndrome (2.8%), nonalcoholic fatty liver disease (28.3%), hyperinsulinemia (51.9%), and dyslipidemia (36.8%). Asthma was present in 9 children and adolescents (8.5%), which is similar to national prevalence data.30 Anxiety or depression was preexisting or subsequently diagnosed in 14 children and adolescents (13.2%), which is somewhat higher than the national childhood prevalence.31 During the month prior to evaluation, obese children and adolescents missed more days from school (mean [SD] of 4.2 [7.7] days and median [range] of 1.0 [0-30] days) than healthy children and adolescents (mean [SD] of 0.7 [1.7] days and median [range] of 0 [0-17] days; P⬍.001). Health-Related QOL
Obese children and adolescents reported significantly (P⬍.001) lower health-related QOL in all domains compared with healthy children and adolescents (TABLE 2). For example, the mean (SD) total score was 67.0 (16.3) for obese children and adolescents and 83.0 (14.8) for healthy children and adolescents. The parent proxy report scores 1816
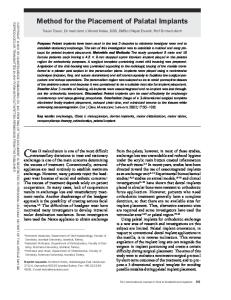
were not only significantly (P⬍.001) lower than the reference population, they were also lower than the selfreport scores for most domains. For total score, the parents of obese children and adolescents reported a mean (SD) of 63.3 (19.2) compared with 87.6 (12.1) for parent proxy reports for healthy children and adolescents. In the obese cohort, the prevalence of impaired health-related QOL (child vs parent report) was determined for total score (49% vs 65%), psychosocial health (50% vs 65%), physical functioning (41% vs 55%), emotional functioning (46% vs 59%), social functioning (51% vs 57%), and school functioning (39% vs 60%). Obese children and adolescents were more likely to have impaired health-related QOL than healthy children and adolescents (ie, total score: OR, 5.5 [95% confidence interval {CI}, 3.4-8.7]) and were similar to children and adolescents diagnosed as having cancer (total score: OR, 1.3[95% CI, 0.8-2.3]; TABLE 3). Influence of Demographic Variables, Clinical Variables, and Comorbid Conditions
Within the obese group, there were no significant differences in QOL scores by sex or ethnicity. Age or SES were not significantly correlated with QOL scores. Stepwise multiple regression
JAMA, April 9, 2003—Vol 289, No. 14 (Reprinted)
analysis using demographic variables also indicated no significant contributions to QOL scores. Using standard sample size and power tables28 with an ␣ of .05 and power of .80, we determined that we would need a minimum of 2474 subjects to detect significant differences in QOL scores on the basis of sex, 400 subjects for ethnicity, 194 subjects for age, and 3134 subjects for SES. The BMI z scores showed small but significant inverse correlations with child self-report for physical (r=−0.233; P = .02) and social functioning (r =−0.228; P = .02). For parent proxy report, the BMI z score for children and adolescents was significantly inversely correlated with total score (r=−0.246; P = .01), physical functioning (r = −0.263; P⬍.01), social functioning (r =−0.347; P⬍.001), and psychosocial functioning (r = −0.209; P = .03). Of all 7 obesity-related comorbid conditions assessed, only children and adolescents with OSA reported significantly lower health-related QOL (mean [SD] scores: total, 53.8 [13.3]; physical functioning, 54.7 [17.6]) compared with obese children and adolescents without OSA (total, 67.9 [16.2]; physical functioning, 71.9 [18.3]). There was no significant difference in mean (SD) total score between obese children and ado-
©2003 American Medical Association. All rights reserved.
PEDIATRIC OBESITY AND HEALTH-RELATED QOL
lescents with (57.7 [19.0]) and without asthma (67.9 [15.9]; P=.07). Eliminating children and adolescents with asthma from the obese sample did not change the overall results. There was also no significant difference in mean (SD) total score for obese children and adolescents with depression or anxiety (62.1 [15.1]) vs those obese children and adolescents without a psychiatric diagnosis (67.7 [16.4]; P=.27). Finally, there was not a significant difference in mean (SD) total score for obese children and adolescents with (65.6 [16.0]) and without an obesity-related comorbid condition (69.7 [16.9]; P=.23). COMMENT These data demonstrate a significant relationship between severe obesity and impaired health-related QOL in children and adolescents aged 5 to 18 years. The obese children and adolescents reported significant impairment not only in total scale score, but also in all domains—physical, psychosocial, emotional, social, and school functioning—in comparison with healthy children and adolescents. The likelihood of an obese child or adolescent having impaired health-related QOL was 5.5 times greater than a healthy child or adolescent and similar to a child or adolescent diagnosed as having cancer. Children and adolescents diagnosed as having cancer and who were receiving chemotherapy were previously found to have the lowest QOL scores when compared with healthy children and adolescents and children and adolescents with juvenile rheumatoid arthritis, type 1 diabetes mellitus, and congenital heart disease.7,12-14,32,33 Children and adolescents diagnosed as having cancer experience severe adverse effects due to treatment34 and consequently often have difficulties keeping up with their peers and maintaining normal activities.35 Young cancer patients also may experience teasing and withdrawal from peers at school.36 Although obese children and adolescents may also experience physical limitations and teasing from peers, they are often not exposed to the intense medical inter-
Table 3. Impaired Health-Related Quality of Life for Obese Children and Adolescents vs Healthy and Cancer Samples Unadjusted Odds Ratio (95% Confidence Interval)*
Child self-report total score Physical health score Psychosocial health score Emotional functioning Social functioning
Obese vs Healthy† 5.5 (3.4-8.7) 5.0 (3.1-8.1) 5.9 (3.7-9.4) 4.3 (2.7-6.8) 5.3 (3.4-8.5)
Obese vs Cancer‡ 1.3 (0.8-2.3) 1.0 (0.6-1.7) 1.9 (1.1-3.3) 1.5 (0.9-2.6) 1.8 (1.0-3.1)
School functioning Parent proxy report total score Physical health score Psychosocial health score Emotional functioning Social functioning School functioning
4.0 (2.4-6.5) 6.0 (3.8-9.6) 8.8 (5.4-14.3) 13.6 (8.2-22.5) 7.4 (4.6-11.9) 9.0 (5.5-14.7) 8.6 (5.3-13.9)
1.1 (0.6-2.0) 1.3 (0.8-2.3) 1.1 (0.7-1.8) 1.3 (0.8-2.2) 1.5 (0.9-2.5) 1.4 (0.8-2.2) 1.2 (0.7-2.0)
*Odds ratios represent the number of times the obese sample is more likely than the healthy or cancer sample to have a score of more than 1 SD below the mean for the healthy population. Odds ratios were not adjusted because age, sex, race, and socioeconomic status did not contribute to the scores. †Healthy data are adapted from published data.7 ‡Cancer data are adapted from published data.13
ventions (and subsequent adverse effects) that are common in pediatric cancer. Thus, the similar healthrelated QOL of the obese sample was an unexpected and important finding. Our sample’s demographics are notably different from the samples in much of the obesity literature, specifically in the greater number of young children and adolescents, boys, and Hispanics. Our inclusion of a large number of Hispanic American boys is important, as epidemiological studies report a high prevalence of obesity for this population in the United States.37,38 For example, the prevalence of obesity in Mexican American boys aged 6 to 11 years increased from 17.5% for 1988-1994 to 27.3% for 1999-2000.37 In the only study previously addressing health-related QOL of obese children and adolescents, children being admitted to German rehabilitation facilities were evaluated by comparing obese children and adolescents with those with asthma and atopic dermatitis.39 The authors concluded that obese girls and adolescents older than 13 years had lower health-related QOL. No data were reported regarding the degree of obesity or the prevalence of comorbid conditions. Among adults, obesity-related impairment of health-related QOL is greatest among white non-Hispanics, women,
©2003 American Medical Association. All rights reserved.
those with higher BMIs, and those seeking the most intensive treatments.40 In our study, health-related QOL did not vary by age, sex, SES, or race. The lack of significant associations between QOL scores and demographic variables, and the large sample sizes needed to obtain significant differences, imply that the low scores in this study were more strongly related to the condition of obesity than the contributions of demographic variables. In addition, while some similarities were noted, the health-related QOL patterns in children and adolescents may be different than in adults. Studies of obese adults most consistently show decreased physical functioning.10 The obese children and adolescents in our study were 5 times more likely than healthy children and adolescents to have impaired physical functioning. Furthermore, Doll et al41 reported that physical functioning decreased with increasing weight among British adults. We also observed that the BMI z score among obese children and adolescents was inversely correlated with physical functioning. This supports the idea that the diminished ability to move with increasing weight leads to a decrease in caloric expenditure with the potential consequence of a further mismatch in energy balance leading to additional weight gain.
(Reprinted) JAMA, April 9, 2003—Vol 289, No. 14 1817
PEDIATRIC OBESITY AND HEALTH-RELATED QOL
Obesity is one of the most stigmatizing and least socially acceptable conditions in childhood. In keeping with previous studies, the children and adolescents in our study were most likely to demonstrate impairment in psychosocial health when compared with healthy children and adolescents— 5.9 times for child self-report and 13.6 times for the parent proxy report. Furthermore, obese children and adolescents were 4 times more likely than healthy children and adolescents to report impaired school function. This is consistent with a study in Thailand, which reported that overweight children and adolescents in grades 7 through 9 were twice as likely to have low grades in math and language as healthy children and adolescents.42 Obese children and adolescents in our study also missed a mean of 4.2 days of school in the month prior to evaluation. The reasons for absenteeism were not investigated, but increased school absenteeism has been documented in children and adolescents with other chronic diseases including diabetes and asthma.43,44 Missed school days may subsequently lead to decreased school performance. The long-term consequences of school absenteeism are not known, but for females, being overweight as an adolescent may be associated with the completion of fewer years of school.45 The most common comorbidities present in the obese sample, dyslipidemia and hyperinsulinemia, are silent precursors to cardiovascular disease and diabetes. Few of the children and adolescents had an obesity-related comorbid condition that was readily apparent (eg, tibia vara or OSA). For the most part, neither obesity-related comorbid conditions nor psychiatric disorders were responsible for differences in health-related QOL. In contrast, in a large study of adults in England, comorbid disease was a strong influence on weight- and health-related QOL.41 In obese children and adolescents, only OSA was associated with significantly greater impairment in QOL total score, which is consistent with a report of fre1818
quent QOL concerns in adults with severe OSA.46 The limitations of our study are due to the process of subject ascertainment and the degree of obesity encountered. The cohort studied was markedly obese with a mean BMI z score of 2.6 (a BMI of approximately 38 in an adult). Whether the findings reported would be seen in children and adolescents with lesser degrees of obesity is unknown. Furthermore, these children and adolescents were selected on the basis of having been referred for evaluation and management of obesity. In adults, seeking treatment for obesity is associated with lower selfreported health-related QOL.10,40 In pediatrics, the concept of seeking treatment is more complicated because the impetus may come from the primary care physician, parent, or child or adolescent. A population-based study in children and adolescents would add to the understanding of the effect of weight status on health-related QOL. In conclusion, even in the absence of comorbid disease, severely obese children and adolescents reported impaired health-related QOL. It is critical for physicians, parents, and teachers to be aware of the risk for impaired QOL in these children and adolescents. We propose that studies of targeted interventions to treat obesity in children and adolescents should include an assessment of health-related QOL before, during, and after the intervention. Such clinical trials would provide the opportunity to evaluate the comprehensive effects of an intervention, not just on weight status, but also on the healthrelated QOL of the children and adolescents. Author Contributions: Study concept and design: Schwimmer, Varni. Acquisition of data: Schwimmer, Varni. Analysis and interpretation of data: Schwimmer, Burwinkle, Varni. Drafting of the manuscript: Schwimmer, Burwinkle, Varni. Critical revision of the manuscript for important intellectual content: Schwimmer, Burwinkle, Varni. Statistical expertise: Burwinkle, Varni. Obtained funding: Schwimmer. Administrative, technical, or material support: Burwinkle, Varni. Study supervision: Varni.
JAMA, April 9, 2003—Vol 289, No. 14 (Reprinted)
Funding/Support: Dr Schwimmer’s work is supported by grant M01 RR00827 from the National Center for Research Resources of the National Institutes of Health for the General Clinical Research Center at the University of California, San Diego. Previous Presentation: Presented in abstract form at the 15th Annual Meeting of the North American Society for Pediatric Gastroenterology, Hepatology, and Nutrition; October 26, 2002; San Antonio, Tex. Acknowledgment: We thank Stephanie Stotts, RD, Liliana Cabral, RD, Sally Dotson, LVN, and Nancy Boyd, RN, for assistance with data collection.
REFERENCES 1. Jonides L, Buschbacher V, Barlow SE. Management of child and adolescent obesity: psychological, emotional, and behavioral assessment. Pediatrics. 2002; 110:215-221. 2. Dietz WH. Health consequences of obesity in youth: childhood predictors of adult disease. Pediatrics. 1998; 101:518-525. 3. Banis HT, Varni JW, Wallander JL, et al. Psychological and social adjustment of obese children and their families. Child Care Health Dev. 1988;14:157-173. 4. Varni JW, Rubenfeld LA, Talbot D, Setoguchi Y. Determinants of self-esteem in children with congenital/acquired limb deficiencies. J Dev Behav Pediatr. 1989;10:13-16. 5. Varni JW, Katz ER, Colegrove R, Dolgin M. Perceived physical appearance and adjustment of children with newly diagnosed cancer: a path analytic model. J Behav Med. 1995;18:261-278. 6. Varni JW, Setoguchi Y. Perceived physical appearance and adjustment of adolescents with congenital/ acquired limb deficiencies: a path-analytic model. J Clin Child Psychol. 1996;25:201-208. 7. Varni JW, Seid M, Kurtin PS. The PedsQL 4.0: reliability and validity of the Pediatric Quality of Life Inventory Version 4.0 Generic Core Scales in healthy and patient populations. Med Care. 2001;39:800-812. 8. Story MT, Neumark-Stzainer DR, Sherwood NE, et al. Management of child and adolescent obesity: attitudes, barriers, skills, and training needs among health care professionals. Pediatrics. 2002;110:210-214. 9. Kolotkin RL, Head S, Hamilton M, Tse CK. Assessing impact of weight on quality of life. Obes Res. 1995; 3:49-56. 10. Fontaine KR, Cheskin LJ, Barofsky I. Healthrelated quality of life in obese persons seeking treatment. J Fam Pract. 1996;43:265-270. 11. Sullivan M, Karlsson J, Sjostrom L, et al. Swedish obese subjects (SOS)—an intervention study of obesity: baseline evaluation of health and psychosocial functioning in the first 1743 subjects examined. Int J Obes Relat Metab Disord. 1993;17:503-512. 12. Varni JW, Seid M, Knight TS, Burwinkle TM, Brown J, Szer IS. The PedsQL in pediatric rheumatology: reliability, validity, and responsiveness of the Pediatric Quality of Life Inventory Generic Core Scales and Rheumatology Module. Arthritis Rheum. 2002;46:714-725. 13. Varni JW, Burwinkle TM, Katz ER, Meeske K, Dickinson P. The PedsQL in pediatric cancer: reliability and validity of the Pediatric Quality of Life Inventory Generic Core Scales, Multidimensional Fatigue Scale, and Cancer Module. Cancer. 2002;94:2090-2106. 14. Varni JW, Seid M, Knight TS, Uzark K, Szer IS. The PedsQL 4.0 Generic Core Scales: sensitivity, responsiveness, and impact on clinical decisionmaking. J Behav Med. 2002;25:175-193. 15. Dietz WH, Robinson TN. Use of the body mass index (BMI) as a measure of overweight in children and adolescents. J Pediatr. 1998;132:191-193. 16. Dietz WH, Bellizzi MC. Introduction: the use of body mass index to assess obesity in children. Am J Clin Nutr. 1999;70:123S-125S. 17. Barlow SE, Dietz WH, for the Maternal and Child Health Bureau, Health Resources and Services Ad-
©2003 American Medical Association. All rights reserved.
PEDIATRIC OBESITY AND HEALTH-RELATED QOL ministration, and the Department of Health and Human Services. Obesity evaluation and treatment: expert committee recommendations. Pediatrics. 1998; 102:E29. 18. Epstein LH, Wu YW, Paluch RA, Cerny FJ, Dorn JP. Asthma and maternal body mass index are related to pediatric body mass index and obesity: results from the Third National Health and Nutrition Examination Survey. Obes Res. 2000;8:575-581. 19. Goodman E, Whitaker RC. A prospective study of the role of depression in the development and persistence of adolescent obesity. Pediatrics. 2002;110: 497-504. 20. Varni JW, Setoguchi Y. Screening for behavioral and emotional problems in children and adolescents with congenital or acquired limb deficiencies. AJDC. 1992;146:103-107. 21. Janicke DM, Finney JW, Riley AW. Children’s health care use: a prospective investigation of factors related to care-seeking. Med Care. 2001;39:9901001. 22. Hollingshead AB. Four Factor Index of Social Status. New Haven, Conn: Yale University; 1975. 23. Varni JW, Seid M, Rode CA. The PedsQL: measurement model for the Pediatric Quality of Life Inventory. Med Care. 1999;37:126-139. 24. Nunnally JC, Bernstein IR. Psychometric Theory. 3rd ed. New York, NY: McGraw-Hill; 1994. 25. Pedhazur EJ, Schmelkin LP. Measurement, Design, and Analysis: An Integrated Approach. Hillsdale, NJ: Erlbaum; 1991. 26. McHorney CA, Ware JE, Raczek AE. The MOS 36item short-form health survey (SF-36), II: psychometric and clinical tests of validity in measuring physical and mental health constructs. Med Care. 1993;31: 247-263. 27. McHorney CA, Ware JE, Rogers W, Raczek AE, Lu JFR. The validity and relative precision of MOS shortand long-form health status scales and Dartmouth
COOP charts: results from the Medical Outcomes Study. Med Care. 1992;30:MS253-MS265. 28. Cohen J. Statistical Power Analysis for the Behavioral Sciences. 2nd ed. Hillsdale, NJ: Erlbaum; 1988. 29. SPSS Version 8.0 for Windows. Chicago, Ill: SPSS Inc; 1998. 30. National Heart, Lung, and Blood Institute. Morbidity and mortality chartbook. Available at: http: //www.nhlbi.nih.gov/resources/docs/cht-book .htm. Accessed December 20, 2002. 31. Birmaher B, Ryan ND, Williamson DE, et al. Childhood and adolescent depression: a review of the past 10 years, part I. J Am Acad Child Adolesc Psychiatry. 1996;35:1427-1439. 32. Varni JW, Burwinkle TM, Jacobs JR, Gottschalk M, Kaufman F, Jones KL. The PedsQL in type 1 and type 2 diabetes: reliability and validity of the Pediatric Quality of Life Inventory Generic Core Scales and type 1 diabetes module. Diabetes Care. 2003;26:631637. 33. Uzark K, Jones K, Burwinkle TM, Varni JW. The Pediatric Quality of Life Inventory in children with heart disease. Progress Pediatr Cardiol. In press. 34. Eiser C. Cancer. In: Koot H, Wallander J, eds. Quality of Life in Child and Adolescent Illness: Concepts, Methods, and Findings. New York, NY: BrunnerRoutledge; 2001:267-295. 35. Spirito A, DeLawyer D, Stark L. Peer relations and social adjustment of chronically ill children and adolescents. Psychol Rev. 1991;11:539-564. 36. Varni JW, Katz ER, Colegrove R, Dolgin M. Perceived social support and adjustment of children with newly diagnosed cancer. J Dev Behav Pediatr. 1994; 15:20-26. 37. Centers for Disease Control, National Center for Health Statistics. Overweight children and adolescents 6-19 years of age, according to sex, age, race, and Hispanic origin: United States, selected years 1963-65 through 1999-2000. Available at: http:
//www.cdc.gov/nchs/products/pubs/pubd/hus/tables /2002/02hus071.pdf. Accessed October 19, 2002. 38. Ogden CL, Flegal KM, Carroll MD, Johnson CL. Prevalence and trends in overweight among US children and adolescents, 1999-2000. JAMA. 2002;288: 1728-1732. 39. Ravens-Sieberer U, Redegeld M, Bullinger M. Quality of life after in-patient rehabilitation in children with obesity. Int J Obes Relat Metab Disord. 2001; 25(suppl 1):S63-S65. 40. Kolotkin RL, Crosby RD, Williams GR. Healthrelated quality of life varies among obese subgroups. Obes Res. 2002;10:748-756. 41. Doll HA, Petersen SE, Stewart-Brown SL. Obesity and physical and emotional well-being: associations between body mass index, chronic illness, and the physical and mental components of the SF-36 questionnaire. Obes Res. 2000;8:160-170. 42. Mo-suwan L, Lebel L, Puetpaiboon A, Junjana C. School performance and weight status of children and young adolescents in a transitional society in Thailand. Int J Obes Relat Metab Disord. 1999;23:272-277. 43. Vetiska J, Glaab L, Perlman K, Daneman D. School attendance of children with type 1 diabetes. Diabetes Care. 2000;23:1706-1707. 44. Diette GB, Markson L, Skinner EA, Nguyen TT, Algatt-Bergstrom P, Wu AW. Nocturnal asthma in children affects school attendance, school performance, and parents’ work attendance. Arch Pediatr Adolesc Med. 2000;154:923-928. 45. Gortmaker SL, Must A, Perrin JM, Sobol AM, Dietz WH. Social and economic consequences of overweight in adolescence and young adulthood. N Engl J Med. 1993;329:1008-1012. 46. Veale D, Poussin G, Benes F, Pepin JL, Levy P. Identification of quality of life concerns of patients with obstructive sleep apnea at the time of initiation of continuous positive airway pressure: a discourse analysis. Qual Life Res. 2002;11:389-399.
No man ever became wise by chance. —Lucius Annaeus Seneca (the Younger) (c 4 BC–AD 65)
©2003 American Medical Association. All rights reserved.
(Reprinted) JAMA, April 9, 2003—Vol 289, No. 14 1819