NEWS RELEASE For Immediate Release June 20, 2014
Contact: Mathew Barewicz, (802) 828-4153
[email protected]
Vermont Unemployment Rate Holds Steady at 3.3 percent in May The Vermont Department of Labor announced today that the seasonally-adjusted statewide unemployment rate for May 2014 was 3.3 percent. This represents no change from the previously reported April rate (3.3 percent). The equivalent national average was 6.3 percent, which also held steady from the previous month’s estimate. By not declining, May 2014 data ends a streak of seven consecutive months of reported decreases to the statewide unemployment rate in Vermont. As of the prior month’s initial data, Vermont’s unemployment rate was the second lowest in the country.
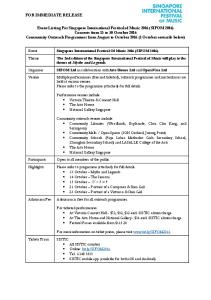
Commissioner’s Message “This month’s rate was unchanged despite some staff reductions by several companies. The flip side has been increased hiring by some of Vermont’s large employers such as GMCR/Keurig, Dealer.com and Cabot Cheese. We note that the state’s unemployment rate during the past few summers has reflected brief periods of upward pressure, and then has usually quickly leveled out or reduced. The Department has great programs to reconnect people to the workforce –building up programs and services for dislocated and trade adjusted workers, long-term unemployed, veterans, youth and senior populations. Our local Career Resource office staff are available to connect Vermonters to jobs, training and other resources. We want to ensure that Vermont has opportunities for career and personal growth for all workers and those seeking to enter the workforce”, said Commissioner Annie Noonan. Chart 1. Unemployment Rate, seasonally adjusted
Chart 2. Vermont Nonfarm Payroll Employment Thousands
Percent 9.0
320
United States 8.0
315
7.0
310
New England 6.0
305
5.0
300
4.0
Vermont
295
Unadjusted 3.0
290
2.0
285
May-12 Aug-12 Nov-12 Feb-13 May-13 Aug-13 Nov-13 Feb-14 May-14
Seasonally Adjusted
May-12 Aug-12 Nov-12 Feb-13 May-13 Aug-13 Nov-13 Feb-14 May-14
State of Vermont Overview The Vermont seasonally adjusted unemployment rate was unchanged in May with a statewide average of 3.3 percent. The comparable rate for the United States (6.3 percent) was also unchanged from the revised April estimate. The seasonally adjusted Vermont data for May show the Vermont civilian labor force increased by 100 from the prior month estimates. The number of employed increased by 50 and the number of unemployed increased by 50. None of the over-the-month changes to the seasonally-adjusted estimates were statistically significant. May unemployment rates for Vermont’s 17 labor market areas ranged from 2.2 percent in Hartford to 4.4 percent in Newport (note: local labor market area unemployment rates are not seasonally adjusted). For comparison, the May unadjusted unemployment rate for Vermont was 3.2 percent which reflects a decrease of five-tenths of a percent from the April level and a decline of nine-tenths of a percent from a year ago
Analysis of Job Changes by Industry Not Seasonally Adjusted The preliminary ‘not-seasonally-adjusted’ jobs estimates for May show an increase of 2,400 jobs when compared to the revised April numbers. This reported over-the-month change does not include the 1,700 job decrease between the preliminary and the revised April estimates due to the inclusion of more data. The monthly increase seen in the May numbers was attributable to seasonal increases related to Construction. The broader economic trends can be detected by focusing on the over-the-year changes in this data series. As detailed in the preliminary ‘not-seasonally-adjusted’ May data, Total Private industries have increased by 0.4 percent (1,000 jobs) and Government employment has decreased by 2.9 percent (1,700 jobs). Seasonally Adjusted The seasonally adjusted data for May reports an increase of 700 jobs from the revised April data. As with the ‘not-seasonally-adjusted’ data, this over-the-month change is from the revised April numbers which experienced a 1,700 job decrease from the preliminary estimates. The seasonally adjusted over-the-month changes in May were minor at the sectorial level. Those with a notable percent increase include: Construction (+500 jobs or +3.6 percent) and Professional and Business Services (+300 jobs or +1.1 percent). Industries with a notable percent decrease include: State Government (-300 jobs or -1.6 percent) and Other Services (-100 jobs or -1.0 percent). ______________ The Unemployment and Jobs Report for June is scheduled to be released on Friday, July 18, 2014 at 10:00 a.m.
Table 1. Vermont Labor Force Estimates, seasonally adjusted
Civilian Labor Force Employed Unemployed Unemployment Rate (%)
Change From April May 2014 2013
May 2014
April 2014
May 2013
351,250
351,000
351,800
250
-550
339,700
339,500
336,650
200
3,050
11,550
11,500
15,150
50
-3,600
3.3
3.3
4.3
0.0
-1.0
Vermont’s labor force, employment and unemployment statistics are produced from a combination of a Statewide survey of households and statistical modeling. The data are produced by the Local Area Unemployment Statistics Program (LAUS), a cooperative program with the US Department of Labor, Bureau of Labor Statistics (www.bls.gov/lau) and the Vermont Department of Labor (www.vtlmi.info/labforce).
Table 2. Vermont Labor Market Areas, Labor Force Estimates not seasonally adjusted 2
May 2014 Labor Market Area
1
Vermont Total
Civilian Labor Force
Unemployment Rate (%)
Employed Unemployed
May-14
Apr-14
May-13
349,100
337,850
11,300
3.2
3.7
4.1
28,950 12,200
28,050 11,750
950 450
3.2 3.7
3.9 4.3
4.1 4.9
4,650
4,500
200
3.9
5.1
4.1
23,400
22,600
800
3.5
3.7
4.5
116,050
112,950
3,150
2.7
2.9
3.4
Hartford
18,150
17,750
400
2.2
2.5
2.8
Manchester
11,200
10,750
450
3.9
4.3
5.2
Middlebury
18,250
17,700
550
2.9
3.6
3.7
Morristown-Stowe
19,900
19,200
700
3.6
5.0
4.5
Newport
14,300
13,700
650
4.4
6.0
5.7
Randolph
8,100
7,800
300
3.8
4.1
4.3
Rutland
25,950
24,850
1,050
4.1
3.9
5.3
Springfield
11,000
10,550
450
4.2
4.3
5.5
St. Johnsbury
13,750
13,250
500
3.6
4.6
4.7
Swanton-Enosburg
13,950
13,550
450
3.1
4.3
4.1
Warren-Waitsfield
3,850
3,750
100
3.0
2.7
3.4
Woodstock
3,400
3,300
100
2.8
3.1
3.4
Barre-Montpelier Bennington Bradford Brattleboro Burlington-South Burlington
1 - The area names above are common language titles; for official names of areas including encompassing cities and towns please refer to the Vermont Labor Market Area map (www.vtlmi.info/lma_maptwn.pdf). 2 - Rate is the unrounded estimates for the number of unemployed divided by total labor force, expressed as a percent. Source: Local Area Unemployment Statistics Program (LAUS) produced by the Vermont Department of Labor (www.vtlmi.info/labforce.cfm) in cooperation with the U.S. Bureau of Labor Statistics (www.bls.gov/lau).
Table 3. Vermont Nonfarm Employment, seasonally adjusted (thousands) Change From: Apr-14 May-13
% Change From: Apr-14 May-13
May-14 Prelim
Apr-14 Revised
May-13 Revised
307.9
307.2
305.9
0.7
2.0
0.2
0.7
253.1
251.9
251.0
1.2
2.1
0.5
0.8
Construction
14.3
13.8
14.0
0.5
0.3
3.6
2.1
Manufacturing
31.5
31.6
32.0
-0.1
-0.5
-0.3
-1.6
Durable Goods
20.5
20.8
21.5
-0.3
-1.0
-1.4
-4.7
Non-Durable Goods
11.0
10.8
10.5
0.2
0.5
1.9
4.8
55.9
55.6
55.7
0.3
0.2
0.5
0.4
9.3
9.2
9.2
0.1
0.1
1.1
1.1
38.1
37.8
37.9
0.3
0.2
0.8
0.5
8.5
8.6
8.6
-0.1
-0.1
-1.2
-1.2
12.2
12.1
12.1
0.1
0.1
0.8
0.8
Finance & Insurance
9.1
9.0
9.0
0.1
0.1
1.1
1.1
Real Estate, Rental & Leasing
3.1
3.1
3.1
0.0
0.0
0.0
0.0
Professional and Business Services
26.7
26.4
26.3
0.3
0.4
1.1
1.5
Professional & Technical Services
14.4
14.3
14.0
0.1
0.4
0.7
2.9
Administrative & Waste Services
10.5
10.2
10.5
0.3
0.0
2.9
0.0
62.8
62.6
61.4
0.2
1.4
0.3
2.3
Private Education Services
13.4
13.1
12.7
0.3
0.7
2.3
5.5
Health Care & Social Assistance
49.4
49.5
48.7
-0.1
0.7
-0.2
1.4
34.9
34.9
34.0
0.0
0.9
0.0
2.6
Arts, Entertainment & Recreation
4.2
4.0
4.0
0.2
0.2
5.0
5.0
Accommodation & Food Services
30.7
30.9
30.0
-0.2
0.7
-0.6
2.3
9.7
9.8
10.0
-0.1
-0.3
-1.0
-3.0
54.8
55.3
54.9
-0.5
-0.1
-0.9
-0.2
6.7
6.7
6.5
0.0
0.2
0.0
0.0
18.6
18.9
18.6
-0.3
0.0
-1.6
0.0
29.5
29.7
29.8
-0.2
-0.3
-0.7
-1.0
117.2
117.8
117.8
-0.6
-0.6
-0.5
-0.5
NAICS Industry Statewide, Total Nonfarm¹ Total Private
Trade, Transportation and Utilities Wholesale Trade Retail Trade Trans., Warehousing & Utilities Financial Activities
Education and Health Services
Leisure and Hospitality
Other Services Government Federal
2
State Local Burlington-S. Burlington Metro (NECTA) Total Nonfarm
1 - Statewide Total Nonfarm is a summed total. Mining & Logging and Information are not published seasonally adjusted because the seasonal component, which is small relative to the trend-cycle and irregular components, cannot be separated with sufficient precision. 2 - Federal Government has been added as a seasonally adjusted series in 2013. Source: Current Employment Statistics Program (CES) produced by the Economic and Labor Market Information Division, Vermont Department of Labor (www.vtlmi.info/ces.cfm) in cooperation with the U.S Bureau of Labor Statistics (www.bls.gov/sae).
Table 4. Vermont Nonfarm Employment, not seasonally adjusted NAICS Industry TOTAL NONFARM TOTAL PRIVATE GOODS-PRODUCING MINING & LOGGING CONSTRUCTION MANUFACTURING Durable Goods Computer & Electrical Equipment Mfg. Fabricated Metal Products Mfg. Non-Durable Goods Food Mfg. SERVICE-PROVIDING TRADE, TRANSPORTATION AND UTILITES Wholesale Trade Retail Trade Food & Beverage Stores General Merchandise Stores Transportation, Warehousing & Utilities Transportation & Warehousing Utilities INFORMATION FINANCIAL ACTIVITIES Finance & Insurance Real Estate, Rental & Leasing PROFESSIONAL AND BUSINESS SERVICES Professional & Technical Services Administrative & Waste Services EDUCATION AND HEALTH SERVICES Educational Services Colleges and Universities Health Care & Social Assistance Ambulatory Health Care Services Hospitals Nursing & Residential Care Facilities Social Assistance LEISURE AND HOSPITALITY Arts, Entertainment & Recreation Accommodation & Food Services Accommodation Hotels & Motels Food Services & Drinking Places OTHER SERVICES GOVERNMENT Federal Government State Government Education Other State Government Local Government Education Other Local Government
May-14 Prelim 305,200 248,900 46,700 800 14,500 31,400 20,500 6,900 2,300 10,900 5,300 258,500 55,300 9,200 37,800 9,700 3,300 8,300 6,500 1,800 4,300 12,200 9,100 3,100 27,100 14,400 11,000 62,300 13,000 8,100 49,300 16,700 12,900 7,300 12,400 31,200 4,200 27,000 9,000 7,900 18,000 9,800 56,300 6,700 8,100 9,600 24,700 7,200
Apr-14 Revised 302,800 245,000 44,200 700 12,400 31,100 20,500 7,200 2,300 10,600 5,200 258,600 54,400 9,000 37,100 9,600 3,300 8,300 6,500 1,800 4,400 12,000 9,000 3,000 26,200 14,500 10,000 62,800 13,500 8,700 49,300 16,800 12,900 7,300 12,300 31,300 3,500 27,800 10,500 9,800 17,300 9,700 57,800 6,700 10,200 9,500 24,300 7,100
May-13 Revised 305,900 247,900 46,900 800 14,200 31,900 21,500 8,000 2,300 10,400 5,100 259,000 55,200 9,100 37,500 9,700 3,000 8,600 6,800 1,800 4,700 12,100 9,000 3,100 26,800 14,000 10,900 61,300 12,600 7,700 48,700 16,100 13,100 7,300 12,200 30,900 4,000 26,900 8,200 7,300 18,700 10,000 58,000 6,500 10,100 9,100 25,300 7,000
Change From: Apr-14 May-13 2,400 -700 3,900 1,000 2,500 -200 100 0 2,100 300 300 -500 0 -1,000 -300 -1,100 0 0 300 500 100 200 -100 -500 900 100 200 100 700 300 100 0 0 300 0 -300 0 -300 0 0 -100 -400 200 100 100 100 100 0 900 300 -100 400 1,000 100 -500 1,000 -500 400 -600 400 0 600 -100 600 0 -200 0 0 100 200 -100 300 700 200 -800 100 -1,500 800 -1,900 600 700 -700 100 -200 -1,500 -1,700 0 200 -2,100 -2,000 100 500 400 -600 100 200
% Change From: Apr-14 May-13 0.8 -0.2 1.6 0.4 5.7 -0.4 14.3 0.0 16.9 2.1 1.0 -1.6 0.0 -4.7 -4.2 -13.8 0.0 0.0 2.8 4.8 1.9 3.9 0.0 -0.2 1.7 0.2 2.2 1.1 1.9 0.8 1.0 0.0 0.0 10.0 0.0 -3.5 0.0 -4.4 0.0 0.0 -2.3 -8.5 1.7 0.8 1.1 1.1 3.3 0.0 3.4 1.1 -0.7 2.9 10.0 0.9 -0.8 1.6 -3.7 3.2 -6.9 5.2 0.0 1.2 -0.6 3.7 0.0 -1.5 0.0 0.0 0.8 1.6 -0.3 1.0 20.0 5.0 -2.9 0.4 -14.3 9.8 -19.4 8.2 4.0 -3.7 1.0 -2.0 -2.6 -2.9 0.0 3.1 -20.6 -19.8 1.1 5.5 1.6 -2.4 1.4 2.9
Source: Current Employment Statistics Program (CES) produced by the Economic and Labor Market Information Divison, Vermont Department of Labor (www.vtlmi.info/ces.cfm) in cooperation with the U.S Bureau of Labor Statistics (www.bls.gov/sae). Estimates are preliminary and subject to revision. See Annual Summary for details.


![Press release [For immediate release]](https://kipdf.com/img/300x300/press-release-for-immediate-release_5aca472e1723ddd9f1a5fac8.jpg)