NEW ZEALAND INTERNATIONAL EDUCATION SNAPSHOT 2015 FULL YEAR REPORT
New Zealand International Education Snapshot: 2015 full year report
New Zealand International Education Snapshot: 2015 full year report
Contents
Introduction
Introduction ........................................................................................................................................... 3
International education enriches lives. Most directly, the international students who come to New Zealand each year overwhelmingly enjoy quality education and experiences that will be with them for life.
Key Trends: Overall .............................................................................................................................. 4 Key Trends: Schools ............................................................................................................................ 5
But the benefits of international education reach far wider. Hundreds of thousands of New Zealand students learn alongside international counterparts. The cultural and social benefits of that are incalculable.
Key Trends: Institutes of Technology and Polytechnics .................................................................. 6 Key Trends: Private Training Establishments ................................................................................... 7
Many institutions, from pre-schools and schools through to universities, know the value of having an international element to their curriculum and their student population. Diversity and international connections become real when they touch lives. Experiences as diverse as students enjoying a shared meal reflecting the backgrounds of their international counterparts, through to language advice from native speakers, add so much to New Zealanders’ sense of global connectedness.
Key Trends: Universities ...................................................................................................................... 8 Overview ................................................................................................................................................ 9 Market growth...................................................................................................................................... 9 Declining markets .............................................................................................................................. 10 Tuition fee revenue............................................................................................................................ 10 Growth in regions .............................................................................................................................. 11
In 2015, the provision of international education passed an important milestone – more than $1 billion dollars in tuition fees. For a small exporting nation – where traditional reliance on primary products is being overtaken by the rise of people-driven services such as tourism and international education – this is a great achievement.
Portfolio diversification ...................................................................................................................... 13 Sector Trends ...................................................................................................................................... 14 Overview ........................................................................................................................................... 14
But of course the story is broader than that. This year, we are working on a reassessment of the economic value international education brings, and we know it is greater than the current valuation of $3 billion and the 30,000 jobs it provides to New Zealanders.
School sector..................................................................................................................................... 15 Primary schools ............................................................................................................................. 15 Intermediate schools ..................................................................................................................... 15
The personal, human benefits are where the real value lie. Education improves lives and broadens minds. We believe that when it has an international component, the value is even deeper.
Secondary schools ........................................................................................................................ 16 Tertiary sector ................................................................................................................................... 17 Institutes of Technology and Polytechnics .................................................................................... 17
We are continuing to work with education providers around the country to support their international initiatives. We are seeing some encouraging green shoots of growth as more regions see the value of international education. More and more international students are starting to see New Zealand beyond the main trunk line. That has to be a good thing.
Universities .................................................................................................................................... 19 English language schools ............................................................................................................ 20 Private Training Establishments (excl. English language schools) .............................................. 21 Competitor Trends .............................................................................................................................. 22 Australian international student enrolments ...................................................................................... 22 USA international student enrolments .............................................................................................. 23 Canada international student enrolments ......................................................................................... 24 Looking Forward ................................................................................................................................. 26 Global trends in international education ............................................................................................ 26 New Zealand’s international education future outlook ...................................................................... 27
Grant McPherson
2016 visa trends ............................................................................................................................ 27
Chief Executive
Development opportunities in NZ regions and internationally ...................................................... 27
Education New Zealand
Appendix 1: Technical Notes ............................................................................................................. 28 Appendix 2: Summary Tables ............................................................................................................ 30
2
P a g e
3
3
P a g e
4
P a g e
5
P a g e
6
P a g e
7
P a g e
New Zealand International Education Snapshot: 2015 full year report
Overview This report provides a snapshot of the trends in New Zealand’s international education industry for the 2015 year. The report utilises information from the Export Education Levy, Single Data Return (SDR), ENROL (a register of school student enrolments) and student visa statistics. It builds on previous reports released in 2013 and 2014. An ‘international student enrolment’ in this report refers to a record of student activity, represented by the number of enrolments a provider has counted. This means an individual student will be counted more than once if they have enrolled in more than one course at the same provider. Please refer to the appendix for further information on definitions and data sources. HIGHLIGHTS:
Between 2010 and 2015, the key source markets for international education in New Zealand changed. In 2010, three main source markets (China, India and Korea) made up 48% of international student enrolments, while in 2015 two markets (China and India) made up 50% of enrolments. India, China and the Philippines experienced the largest increase in student enrolments, with these three markets making up 99% of the overall growth in 2015 (+14,542) compared to 2014. The New Zealand international education industry earned just over $1 billion in tuition fee revenue in 2015, an additional $146 million compared to 2014 (+17%), and a record result for the industry. New Zealand’s Regional Partnership Programme is starting to see some promising results, with all regions experiencing growth in international student enrolments in 2015.
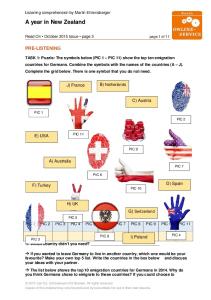
Market growth India, China and the Philippines experienced the largest increase in student enrolments, with these three markets making up 99% of the overall growth in 2015 (+14,542) compared to 2014. India continued to experience record growth in 2015 (+45%; +9,013), building on the strong results experienced in 2014. Similar to 2014, the growth in enrolments was driven by the Private Training Establishments (PTE) sector (+41%; +6,149), although in 2015 the Institutes of Technology and Polytechnics (ITP) sector also experienced strong growth (+67%; +2,681). China experienced another year of growth in 2015, with the PTE sector experiencing the largest increase in enrolments (+14%; +1,429), followed by the secondary school sector (+92%; +933) and the university sector (+8%; +828). Compared to 2015, international student enrolments from the Philippines grew by +83% (+1,648). This growth was driven by the PTE sector (+99%; +1,322) as well as the ITP sector (+59%; +315). Figure 1: Top / bottom five market changes in 2015 compared to 2014 India China Philippines Colombia Nepal Germany Japan Thailand Saudi Arabia Korea -2000
0
2000
4000
6000
8000
10000
International student enrolments for Colombia grew by more than half in 2015 compared to 2014 (+52%; +386) and Nepal also saw strong growth (+42%; +336)
8
P a g e
9
9
P a g e
New Zealand International Education Snapshot: 2015 full year report
New Zealand International Education Snapshot: 2015 full year report
Declining markets
Growth in regions
As shown in figure 1, the markets to experience the largest declines were Korea, Saudi Arabia and Thailand.
New Zealand’s Regional Partnership Programme is starting to see some promising results, with all regions experiencing growth in international student enrolments in 2015.
Korea experienced the largest decline in student enrolments during 2015 with 588 fewer enrolments compared to 2014 (-7%). Since 2010, international student enrolments from Korea have declined by 51% (-7,592). From 2010-2013, the average rate of decline was -17% and for the past two years decline has slowed to an average rate of -7%.
Table 2: New Zealand regional change 2015 compared to 2014 International Student Enrolments Indicator
There is an overall decline in Korean students studying abroad, with many choosing to remain in Korea and take advantage of its much improved standard of education, available at a lower cost. The decline may also be attributed to the state of the Korean economy which is experiencing high youth unemployment and household debt. The decline in Korean students studying in New Zealand is particularly noticeable in the young student cohort, evident in 282 fewer enrolments in our schools in 2015, compared to 2014. The university sector also experienced a loss of 134 enrolments from Korean students in 2015 (-17%). Student enrolments from Saudi Arabia declined by 14% in 2015 (-465), driven by a 12% reduction in enrolments (-168) at English Language schools (ELS). The ITP sector also saw a significant decline from this market compared to 2014 (-22%; -111). The Saudi government has announced new requirements for student eligibility, including a higher threshold for academic and language qualifications for government-funded courses. These new requirements are in response to the declining price of oil, resulting in a loss of government funds, as well as the government’s aim to reduce expenditure across the public service. Growth from Thailand in 2014 (+19% compared to 2013) has reversed in 2015, with a 10% decline in student enrolments. In 2014 there was a key change in the Thai market - a shift in the university academic year from March to May to align with other ASEAN markets. This change meant Thai students had almost six months semester break, resulting in many going overseas to study. New Zealand was amongst the countries to benefit from this increase, evidenced by growth in the PTE sector in 2014 (+37%; +486) and ITP sector (+72%; +72). In 2015, student enrolments in the ITP sector have returned to similar levels seen in 2013 (-41%; -71). For the PTE sector, enrolments are down for this market compared to 2014 (-15%; -265), but up compared to 2013 (+17%; +221).
NZ Region
# change
% change
Auckland
+10,589
+15%
Distribution of enrolments 62.8%
Canterbury
+1,180
+13%
8.4%
Bay of Plenty
+891
+22%
4.0%
Wellington
+641
+9%
5.9%
Waikato
+370
+7%
4.7%
Nelson/Tasman
+277
+21%
1.3%
Southland
+221
+18%
1.2%
Manawatu-Wanganui
+98
+3%
2.6%
Otago
+74
+1%
4.5%
Taranaki
+52
+8%
0.6%
Hawkes Bay
+47
+4%
1.0%
Marlborough
+47
+62%
0.1%
Northland
+31
+6%
0.4%
West Coast
+19
+35%
0.1%
Gisborne
+1
+3%
0.0%
The Regional Partnership Programme is designed to support the development and growth of international education in selected regions. In partnership with international education providers and representative groups, local government economic development agencies and the international education industry; the programme provides support and co-funding for a range of activities focused on regional international education industries and regional economic development. Auckland continues to enrol the majority of international students in New Zealand, representing 63%. The next largest host regions include Canterbury (8%), Wellington (6%), Waikato (5%) and Otago (4%). The ITP and PTE (including ELS) sectors were key drivers of regional growth in 2015. For a number of regions, this included an increase of more than 100 international student enrolments (figures 2 and 3).
Other markets to experience a decline in international student enrolments in 2015 were Japan (-3%; 273) and Germany (-4%; -156).
Figure 2: Regional growth for the ITP sector 2015 (grew by 100 or more student enrolments)
Tuition fee revenue The New Zealand international education industry earned just over $1 billion in tuition fee revenue in 2015, an additional $146 million compared to 2014 (+17%), and a record result for the industry. The growth in tuition fee revenue was driven by the PTE sector (excluding ELS), which increased by 23% (+$53.9m) on 2014. The ITP sector also experienced strong growth, with an additional $48.2 million in tuition fee revenue this year (+41%). While the university and school sectors saw relatively flat results in student enrolments during 2015, the tuition fee revenue received increased by 8% (+$28.3m) and 10% (+$13.1m) respectively. Table 1: Change in tuition income by sector, 2015 vs 2014 All Sectors % change in tuition income $ change in tuition income ($m)
School Universities
+10% +$13.1
+8% +$28.3
10
ITP
PTE (excl. ELS)
+41% +$48.2
+23% +$53.9
ELS
Total PTE
Total
+5% +19% +17% +$2.6 +$56.5 +$146.1
10
P a g e
11
11
P a g e
New Zealand International Education Snapshot: 2015 full year report
New Zealand International Education Snapshot: 2015 full year report
Figure 3: Regional growth for the PTE (including ELS) sector 2015 (grew by 100 or more student enrolments)
Portfolio diversification New Zealand’s International Education Strategic Roadmap identified the need for New Zealand to diversify its market portfolio. A progress overview completed in 2015 found that New Zealand has made good progress building on existing markets, while also diversifying into new markets. The international education industry is working to enable growth from existing markets, and implementing a NZ Inc. approach to target new and existing markets. New Zealand has a focus on improving marketing, raising the profile of New Zealand as a study destination and removing barriers to entry. In 2015 India made up 23% of all student enrolments, a 5% increase compared to 2014. France fell away from the top 10 (2% in 2014) with the Philippines taking its place in 2015 (3%). Brazil and Saudi Arabia’s proportions both declined from 3% in 2014, to 2% in 2015. USA, Thailand and Germany remained in the top 10 (each contributing 3%) and China, Japan and Korea’s proportions all declined by 1% each compared to 2014. A longer term view shows that between 2010 and 2015 the key source markets for international education in New Zealand have changed (figure 4). In 2010 three main source markets (China, India and Korea) made up 48% of international students enrolments, while in 2015 two markets (China and India) made up 50% of enrolments.
Figure 4: New Zealand top 10 source markets of international students 2010 and 2015 (student enrolments)
2010 (Total: 104,352)
Auckland enrolments increased by 15% (+10,589) in 2015, driven by the PTE (including ELS) sector (+20%; +8,180) and the ITP sector (+29%; +1,508). The Canterbury region grew by 13% (+1,180), also driven by the PTE (including ELS) sector (+19%; +745) and ITP sector (+17%; +202) as well as growth in the university sector (+9%; +238).
Other 22%
PTEs (including ELS) and ITPs in the Bay of Plenty region are also driving significant growth compared to 2014, with the region experiencing the third-largest growth of all NZ regions, in 2015 (+22%; +891). The PTE (including ELS) and ITP sector attracted 80% of all international student enrolments in Bay of Plenty in 2015.
Malaysia 2% USA 3% Brazil 3% Thailand 3% Germany 5%
The Wellington region experienced an increase of 9% in international student enrolments in 2015, compared to 2014 (+641). This increase was driven by the ITP sector (+32%; +348) and the PTE (including ELS) sector (+14%; +197). The university sector also experienced an increase in enrolments +4% (+132).
Saudi Arabia 5%
Waikato, Nelson/Tasman and Southland all saw increases in 2015 compared to 2014. The Nelson/Tasman region, in particular, continues to build on the strong growth seen in previous years, with overall enrolments up 21% (+277). The ITP sector was the main driver of growth in the region during 2015 (+64%; +256). Southland’s growth is also being driven by the ITP sector (+21%; +209).
12
China 23%
USA 2% Saudi Arabia 2% Brazil 2% Germany 3% Thailand 3%
Korea 14%
Japan 9%
Other 21%
India 11%
Philippines 3%
Korea 6%
Japan 8%
China 27%
India 23%
*Note: In 2015 there were students from 176 countries enrolled at a NZ provider – “other” includes all of these additional countries.
Along with China and India, New Zealand has experienced significant growth in enrolments from the Philippines over the past six years, with this market being the fifth largest source of international students in 2015. The PTE sector has benefited the most from this growth (+471%; +2,190).
Benefits of New Zealand’s Regional Partnership Programme include increased awareness of the international education industry and its importance to regional economic development; increased capability and effectiveness of the international education industry within regions and more efficient use of resources to improve outcomes and growth in international education for all regions.
12
2015 (Total: 125,011)
Another change to the portfolio has been from the Korea market, which has experienced a decline in student enrolments. In 2010, Korea was the second largest source market for the international education industry, with students from Korea making up 14% of enrolments. By 2015, Korea dropped to the fourth largest source market and enrolments made up only 6% of the total student population. The decline has impacted the PTE sector (-49%; -3,912) and the school sector (-55%; -2,976) most.
P a g e
13
13
P a g e
New Zealand International Education Snapshot: 2015 full year report
New Zealand International Education Snapshot: 2015 full year report
Sector Trends
School sector Primary schools
HIGHLIGHTS
It is encouraging to see some growth in primary schools, especially as New Zealand sees more primary schools entering the industry (often in partnership with local secondary schools). Younger students and their guardians represent high economic value, with opportunities to pathway through the system. In 2015, tuition fees for primary schools increased by 14% (+$1m).
The growth in the primary school sector in 2015 was driven by the China market, which grew by 92% (+293). Intermediate schools were the only education institutions to experience a decline in the number of international students during 2015, with 689 students compared to 862 in 2014 (-20%; -173). Secondary schools continue to experience strong growth from the China market - up 22% in 2015 compared to 2014 (+933) and up 118% compared to 2010 (+2,825). In the ITP sector, there was a significant increase in the number of Level 8 enrolments (+111%; +849) and graduate certificates/diploma enrolments (+58%; +1,348) during 2015 compared to 2014 - both record levels for the sector. The PTE sector (excluding English Language schools) continued to experience growth in 2015, with a record 42,594 student enrolments. This is an increase of 29% on 2014 (+9,489) and a 37% increase on 2010. The English Language sector experienced a steady result in 2015 with 21,005 student enrolments, up 2% compared to 2014 (+457). The university sector’s reliance on the China market has increased significantly, moving from 27% of enrolments in 2010, to 42% of enrolments in 2015.
There were 1,830 international student enrolments in primary schools in 2015, up 18% on 2014 (+282). Three markets – Korea, China and Japan – made up 79% of all international student enrolments in primary schools in 2015. Primary schools in the Auckland region hosted the majority of international students (65%) in 2015, followed by Bay of Plenty at 10%. The growth in primary schools in 2015 was driven by China, which grew by 92% (+293). Further growth was seen from Thailand (+25%; +15) and USA (+213%; +17). The NZ regions which benefited from this growth included Auckland (+21%; +210) and Bay of Plenty (+26%; +39). Despite being among the largest markets for this sector, student enrolments from Korea and Japan declined in 2015 compared to 2014. Figure 6: International student trends in the primary school sector, 2010-2015 1,600
Overview
1,400 1,200 Number of enrolments
With the exception of the intermediate school sector, all sectors experienced an increase in international student enrolments during 2015, compared to 2014. Many sectors have reached record levels of enrolments since 2010, with PTEs (excluding ELS) being the fastest growing sector in 2015, followed by ITPs. Figure 5: The number of international students in the New Zealand international education industry, 2010-2015
1,000 800 600 400 200
45,000
-
40,000
2010
Korea
35,000 Number of enrolments
2011
2012
2013
China
Japan
2014
2015
Saudi Arabia
30,000
Intermediate schools
25,000
In 2014, Korea, China and Thailand made up 89% of all student enrolments in intermediate schools, however in 2015, Korea and China alone made up 87% of enrolments.
20,000
Intermediate schools are still feeling the effects of the Korean decline however growth seen from China may, in time, offset this. Intermediate schools were the only sector to experience a decline in international student enrolments, with 689 enrolments in 2015 compared to 862 in 2014 (-20%; -173). The decline in this sector was driven by Korea (-22%; -127), Thailand (-66%; -41) and Japan (-53%; 21). There has been a 50% decline in intermediate school student enrolments from Korea alone since 2010 (-449).
15,000 10,000 5,000 Primary (incl Intermediates)
Secondary 2010
University 2011
2012
14
ITP 2013
2014
PTE (excl ELS)
ELS
China was the only market to experience considerable growth in the intermediate school sector during 2015 (+12%; +15). The increase in enrolments from China in the primary school sector is likely to lead to further growth in intermediate schools in 2016 as students’ progress through the school system.
2015
14
P a g e
15
15
P a g e
New Zealand International Education Snapshot: 2015 full year report
New Zealand International Education Snapshot: 2015 full year report
Intermediate schools in the Auckland and Bay of Plenty regions experienced a decline in student enrolments this year (-16%; -101 and -41%; -40 respectively), with some growth being seen in Waikato (+36%; +8).
The top three ‘other’ markets in the market portfolio for secondary schools include Brazil, France and Italy, all making up 2% each of international student enrolments in 2015. However, the number of students from Brazil studying in New Zealand secondary schools dropped significantly in 2015 (-44%; -292) which is attributed to fewer Pernambuco scholarship students coming to New Zealand in 2015.
Figure 7: International student trends in the intermediate school sector, 2010-2015
Other markets to experience an increase in secondary school enrolments include Indonesia (+67%; +49) and Colombia (+69%; +24).
1,000 900
The Auckland region hosted 54% of secondary school students in 2015 and experienced a 5% increase (+430) in enrolments – the largest growth seen this year. Another 10% of international students enrolled at secondary schools in the Canterbury region, which also saw 3% (+47) growth on 2014.
Number of enrolments
800 700 600
Figure 9: International student trends in the secondary school sector, 2010-2015
500 400 300
6,000
200 100
5,000
2011 Korea
2012 China
2013 Thailand
2014
2015
Japan
Number of enrolments
2010
Secondary schools Secondary school enrolments remained relatively stable in 2015, with an additional 311 student enrolments (+2%) and an additional $12 million in tuition fees (+10%) compared to 2014. Overall, the market portfolio for secondary school students changed little over the last year (figure 8). In 2014, China, Japan, Germany, Korea and Thailand made up 76% of all student enrolments in this sector and this is similar in 2015 (78%). Individually, however, there were fewer enrolments from Japan (-6%; -159), Germany (-5%; -97) and Korea (-8%; -112) in 2015, compared to 2014.
4,000
3,000
2,000
1,000
2010
Despite these changes, secondary schools are still experiencing strong growth in enrolments from China – up 22% in 2015, compared to 2014 (+933); and up 118% compared to 2010 (+2,825). The proportion of Chinese students studying in secondary schools has increased from 17% in 2010 to 34% in 2015, while Korean enrolments have declined from 21% to 8% over the same time period.
2011 China
2012 Japan
2013
Germany
Korea
2014
2015
Thailand
Figure 8: Market portfolio for the secondary school sector, 2010 and 2015
2015 (Total: 15,408)
2010 (Total: 14,353)
Other 23%
Other 22%
Korea 21%
Thailand 8%
Institutes of Technology and Polytechnics (ITPs)
China 34%
The ITP sector was the second-fastest growing sector in 2015, up 23% (+3,311) on 2014. The growth was driven by India, with enrolments from that country increasing by 67% (+2,681) compared to 2014.
Thailand 8%
Germany 18% Japan 13%
Tertiary sector
Korea, 8%
China 17%
Strong growth was also seen from China (+7%; +383) and the Philippines (+59%; +315). China and India combined accounted for 71% of international student enrolments in the ITP sector in 2015, an increase on 2014 (66%).
Japan 16%
Germany 12% *Note: In 2015 there were students from 176 countries enrolled at a NZ provider – “other” includes all of these additional countries.
16
16
P a g e
17
17
P a g e
New Zealand International Education Snapshot: 2015 full year report
New Zealand International Education Snapshot: 2015 full year report
Figure 10: International student trends in Institutes of Technology and Polytechnics, 2010-2015
Universities There were 26,024 international students enrolled at New Zealand universities in 2015. The university sector experienced a steady increase in 2015 (+4%; +1,071), slightly up on 2014.
8,000
While growth was seen from China (+8%; +828), USA (+11%; +241) and India (+13%; +168), this was partially offset by declines from Korea (-17%; -134), Viet Nam (-8%; -72) and Saudi Arabia (-8%; -59).
7,000
Number of enrolments
6,000 5,000
Figure 12: International student trends in university sector, 2010-2015
4,000 3,000
12,000
2,000 10,000
1,000 2010
2011 India
China
2012
2013 Philippines
2014 Saudi Arabia
Number of enrolments
2015
The ITP sector continues to develop more graduate and postgraduate qualifications to suit market needs, especially for India and the Philippines. In 2015, there was a 100% increase in the number of students enrolled in postgraduate qualifications in the ITP sector, compared to 2014 (+889). This was a record level for the sector and is most evident in Level 8 programmes (+111%; +849). The growth has been driven by China, India and the Philippines. There were also an additional 1,348 enrolments in graduate certificates/diplomas in 2015 compared to 2014. This is driving growth in overall certificates/diplomas (+23%; +2,332).
8,000 6,000 4,000 2,000 2010
Figure 11: Number of international student enrolments by level of study at ITPs, 2010-2015
2011 China
2012 USA
2013
India
Malaysia
2014
2015
Viet Nam
14,000
The majority of international student enrolments in this sector were at universities in the Auckland region (48%), followed by Wellington (12%), Canterbury (11%) and Otago (10%). Auckland experienced the largest growth in university enrolments during 2015, up 362 enrolments (+3%), followed by Canterbury (+9%; +238) and Wellington (+4%; +132).
12,000
Number of enrolments
10,000
Based on all international student enrolments at universities in 2015, the disciplines that saw the highest enrolment growth were society and culture (+6%; +633), management and commerce (+6%; +556) and information technology (+7%; +273).
8,000 6,000
Popular programmes which international students chose to enrol in during 2015 included Level 7 bachelors degrees (an increase of 482 enrolments, up 4% compared to 2014), and Level 9 masters (+13%; +428).
4,000
2,000
The university sector’s reliance on the China market has increased significantly. In 2010, 27% of enrolments were from China; this had increased to 42% of enrolments from China in 2015 (figure 13). New Zealand has increased its promotion effort and boosted its presence in the USA market, and this has contributed in 2015 to over 2,400 enrolments from American students in New Zealand universities, the second largest growth seen in the sector.
Certs/diplomas
Bachelors 2010
2011
2012
2013
Postgraduate 2014
2015
Based on all international student enrolments at ITPs during 2015, the most popular fields of study were management and commerce (34%), society and culture (17%) and information technology (11%).
Students from Saudi Arabia and Korea each made up 5% of all international student enrolments in New Zealand universities in 2010, but this dropped to 3% in 2015. Similarly in 2010, 9% of international student enrolments in universities were from Malaysia, dropping to 5% in 2015. Enrolments from Korea and Malaysia have been in decline for a number of years, while the decline in scholarships has impacted the Saudi Arabian market.
The Auckland region grew by 29% (+1,508), with the next largest increases for ITP student enrolments seen in Bay of Plenty (+27%; +357), the Wellington region (+32%; +348) and the Nelson/Tasman region (+64%; +256).
18
18
P a g e
19
19
P a g e
New Zealand International Education Snapshot: 2015 full year report
New Zealand International Education Snapshot: 2015 full year report
Figure 13: Market portfolio in the university sector, 2010 and 2015
Private Training Establishments sector (excluding ELS)
Other 32%
The growth in the PTE sector during 2015 has been driven predominately by the India market (+42%; +6,171), followed by the Philippines (+103%; +1,337) and China (+18%; +1,293).
Other 30%
China 27%
The PTE sector saw a decline in student enrolments from the priority markets of Japan (-10%; -122), Saudi Arabia (-21%; -105) and Germany (-27%; -28).
China 42%
Korea 3%
USA 11%
Saudi Arabia 3%
Germany 4% Saudi Arabia Korea 5% India 5% 7%
In 2015, the Private Training Establishment (PTE) sector (excluding ELS) experienced record growth, with 42,594 students enrolled across New Zealand. This was an increase of 29% on 2014 (+9,489) and a 37% increase on 2010.
2015 (Total: 26,024)
2010 (Total: 22,927)
Viet Nam 3% Malaysia 5%
Malaysia 9%
Figure 15: International student trends in the PTE sector (excluding ELS), 2010-2015
USA 9%
25,000
India 5% 20,000
Number of enrolments
*Note: In 2015 there were students from 176 countries enrolled at a NZ provider – “other” includes all of these additional countries.
English Language Sector (ELS) The English Language Sector experienced a steady result in 2015, with 21,005 student enrolments, up 2% compared to 2014 (+457). Markets that experienced the largest growth in 2015 were: Brazil (+27%; +359); Colombia (+56%; +257); Japan (+4%; +170); and China (+5%; +136). The growth from these four markets helped offset the decline in students from Thailand (-22%; -286); Saudi Arabia (-12%; 168); Korea (-5%; -119); and Russia (-31%; -111).
15,000
10,000
5,000
2010
Figure 14: International student trends in the English language sector, 2010-2015
2011 India
2012 China
2013 Philippines
Korea
2014
2015
6,000
4,000
It is not possible to drill down the data on unfunded PTEs and subsidiaries. However, growth in international student enrolments at publicly-funded PTEs was driven by study in the following disciplines: management and commerce (+31%; +1,845), food, hospitality and personal services (+24%; +699), and information technology (+25%; +473).
3,000
Level 5-7 certificates/diplomas were the most popular programmes among international students in 2015, up 23% compared to 2014 (+2,277).
Number of enrolments
5,000
The majority (82%) of international students enrolled at PTEs studied in the Auckland region. The region also saw the largest increase in PTE student enrolments in 2015 (+30%; +8,030). Other New Zealand regions with high growth in 2015 were: Canterbury, up 45% compared to 2014 (+967), followed by Bay of Plenty, up 57% (+490) and Hawkes Bay (+37%; +89).
2,000 1,000 2010
2011
Japan
China
2012
Korea
2013
Brazil
2014
France
2015
The Wellington region saw the largest increase in enrolments in 2015 (+21%; +212), followed by the Otago region (+19%; +181). The majority of international students studying at English Language schools are hosted by the Auckland (70%) and Canterbury (7%) regions.
20
20
21
P a g e
21
P a g e
New Zealand International Education Snapshot: 2015 full year report
New Zealand International Education Snapshot: 2015 full year report
Competitor Trends
Portfolio diversification 2010 - 2015 Australia’s key markets for international education enrolments remained unchanged between 2010 and 2015, with the same five markets (China, India, Korea, Viet Nam and Thailand) comprising 51% in 2010 and 50% in 2015.
Australian international student enrolments
Similarly to New Zealand, China and India were the two largest source markets for Australia. However, while Indian enrolments are increasing in New Zealand, the proportion of Indian enrolments in Australia has declined from 16% in 2010 to 11% in 2015. The proportion of student enrolments from China has 3 remained steady in Australia (26%), in line with New Zealand’s current proportion of 27%.
The Australian international education industry appears to have recovered from the declines experienced between 2010 and 2013, after experiencing two consecutive years of strong growth (figure 16). Australian international student enrolments increased by 10% during 2015 (+57,174) compared to 2014. The growth is attributed to an increase in international student enrolments from: India (+15%; +9,657); China (+13%; +19,229); Taiwan (+34%; +3,470); Brazil (+11%; +2,438); and Thailand (+9%; 1 +2,372).
Figure 17: Australia top 10 source markets of international students 2010 and 2015 (student enrolments)
All education sectors in Australia experienced growth in 2015, with the higher education sector experiencing the biggest growth (+9%; +22,857). This was driven by India (+35%; +9,120); China (+9%; +7,882); and Nepal (+21%; +2,101). Growth was also seen in the Vocational Education and Training (VET) sector (+13%; +19,983) in 2015, with the most significant growth coming from: Thailand (+26%; +2,735); Korea (+19%; +2,297); and Taiwan (+58%; +2,024).
2010 (Total: 616,464)
The Australian Bureau of Statistics reported that Australia’s education export income reached 2 AUS$19.65 billion in 2015 (approximately $21.26 billion NZD) .
Other 29%
Figure 16: Australian international student enrolment trends, 2010-2015
Saudi Arabia 2% Brazil 3%
300,000
Indonesia 3%
250,000
Nepal 4%
Number of enrolments
China 26%
India 11%
Pakistan 3% Indonesia 3% Nepal 3%
Korea 5%
Malaysia 4%
Brazil Thailand 4% 4%
Viet Nam 5% Korea 4%
Viet Nam 4%
*Note: “other” includes the additional source countries of students enrolled at an Australian provider
100,000
USA international student numbers For students across the world who are seeking an international education, the United States continues to be the most preferred destination. In 2014/15, there were 974,926 international students studying at colleges and universities in the US. The number of international students studying in the 4 US increased by 10% over the 2013/14 year (+88,874). Higher Education
VET 2010
Schools 2011
2012
2013
ELICOS 2014
Non-award
2015
For the past several years, the growth in student numbers in the US has been driven by China (+11%; +29,601). However in 2014/15, this was driven by India (+29%; +30,215). Other markets from which the US experienced growth in 2015 were: Brazil (+78%; +10,389) and Saudi Arabia (+11%; +6,026). According to the U.S. Department of Commerce, international students in the US contributed USD$30.8 billion (approximately NZD$45.3 billion) to the US economy in 2014.
Australian Department of Education and Training http://monitor.icef.com/2016/02/australian-education-exports-top-aus19-billion-in-2015/
3 4
23
Other 33%
150,000
0
Thailand 4%
200,000
50,000
2
China 26%
India 16%
Malaysia 4%
1
2015 (Total: 644,504)
22
Australian Department of Education and Training Institute of International Education – Open Doors
24
P a g e
23
P a g e
New Zealand International Education Snapshot: 2015 full year report
New Zealand International Education Snapshot: 2015 full year report
Portfolio diversification 2009/10 - 2014/15
Figure 19: Canada top 10 source markets of international students 2010-2015 (student numbers)
The US has experienced little change in its key markets for international students between 2009/10 and 2014/15. The top three source markets for the US in 2009/10 and 2014/15 were China, India and South Korea, with these three markets making up 52% of all international students studying in the US.
2010 (Total: 155,195)
The proportion of Chinese students studying at US colleges and universities has increased significantly – from 18% in 2009/10 to 31% in 2014/15. India remains the second-largest source market for the US, but the proportion of students has remained the same (+1%) over this period. There has been a decline in the numbers of students coming from Korea (from 10% to 7%), while student numbers from Saudi Arabia have increased from 4% in 2009/10 to 6% in 2014/15.
Other 32%
Brazil 2% Iran 2%
2014/15 (Total: 972,926)
Mexico 2% Japan 3%
China 18% Other 35%
Other 29% India 15%
Turkey 2% Viet Nam 2%
Mexico 2% Viet Nam 2%
Mexico 2%
Saudi Arabia 4%
Mexico 2% USA Japan 3% 3%
India 9% USA 4% France 5%
Brazil 3% Nigeria 3%
Saudi Arabia 6%
China 30%
India 14% Korea 6% Saudi Arabia France 5% 3%
*Note: “other” includes the additional source countries of students enrolled at a Canadian provider
India 14%
Taiwan 2% Japan 2%
Japan Taiwan 4% 4%
Other 28%
China 31%
Brazil 2%
South Korea 10%
China 22%
Korea 13%
Figure 18: U.S. top 10 source markets of international students 2009/10-2014/15 (student numbers)
2009/10 (Total: 690,923)
2015 (Total: 223,291)
Canada 3%
Canada 4%
Saudi South Arabia Korea 7% 6%
*Note: “other” includes the additional source countries of students enrolled at a U.S provider
Canada international students In 2015, there were 223,291 international students in Canada, an increase of 8% (+17,181) compared to 2014. The growth was largely driven by India (+32%; +7,781), closely followed by China (+13%; +7,659), with growth also coming from: Nigeria (+13%; +719); Korea (+3%; +496); and Turkey (+36%; 5 +432).
Portfolio diversification 2010-2015 Between 2010 and 2015, the top three markets for Canada has remained the same but their relative weighting has changed. Student numbers from China have increased from 22% in 2010 to 30% in 2015. Student numbers from India also increased significantly between 2010 and 2015 (9% to 14%), while the number of Korean students declined from 13% to 6% over the same period.
5
Institute of International Education – Open Doors
25
24
P a g e
25
25
P a g e
New Zealand International Education Snapshot: 2015 full year report
New Zealand International Education Snapshot: 2015 full year report
Looking forward
New Zealand’s international education future outlook 2016 visa trends
Global trends in international education
Student visa trends provide a useful proxy lead indicator of international enrolment trends and are available on a monthly basis.
Currently there are almost 5 million students studying abroad. This figure is expected to 6 grow to 8 million in the next 10 years. The recently published British Council report, “The shape of international education to 2025”, identifies a range of factors that will impact future trends in student mobility. These include demographic changes, increased 7 expenditure on education and changes in the modes of delivery of education.
Following a noticeable increase in the decline rate of Indian student visa applications in 2015, Immigration New Zealand highlighted an issue with English language testing in some countries. As a result of this investigation, in June 2015, NZQA made amendments to the English language requirements (Rule 18) for some first-time international student visa applicants. The revised Rule requires certain students to produce an internationally recognised test of English language proficiency.
The report predicts that China will continue to be the top supplier of international students for the next decade, followed by India, Nigeria, Germany and Saudi Arabia. India and Indonesia are amongst the countries predicted to have the highest number of mobile, tertiary-aged students over the next 10 7 years.
In the year to date (Jan-May), total student visas (TSV) approved are stable, while first time student visa (FSV) approvals are down 5% (-886). The markets driving this decline are India and the Philippines, with a total of 1,383 less FSVs approved (-24%) in the same period. India and the Philippines were two markets identified as having a low visa approval rate and these results are directly linked to the Rule 18 amendments.
The report identifies that, globally, the middle class is likely to grow to 4.9 billion by 2030. This will likely result in an increase in spending on education services and products. Two-thirds of this growth is expected to take place in the Asia-Pacific region. However, government policies affecting international education are changing. For example, ASEAN states are increasingly working to 7 8 encourage domestic students to study in Asia rather than heading to western universities.
However, a number of markets are seeing growth of more than 50 first-time student visas approved in the year to date, compared to the same period last year. These are: China (+6%; +184), Korea (+13%; +115), Japan (+12%; +101); Germany (+22%; +97) Malaysia (+31%; +72); and Nepal (+70%; +66). Despite figures starting to stabilise in the second quarter of 2016, it is estimated that the number of FSVs approved will be lower in 2016 compared to 2015.
Research by Oxford University into international trends in higher education highlights the impact that technology is having on traditional campus-based teaching and learning. Its research shows that online learning management systems such as Blackboard and Moodle are having greater significance. For students, competency in information technology is becoming a pre-requisite for the 8 global markets they will enter after graduation.
The regional spread of countries is expected to continue in 2016, with similar or increasing numbers of visa approvals for most regions compared to the same period in 2015. 9
Development opportunities in New Zealand regions and internationally In November 2015, Tertiary Education, Skills and Employment Minister, Steven Joyce, announced additional investment of $2.76 million into initiatives to boost the growth of international education in regional New Zealand, and to help develop new international markets.
Students are choosing host destinations based on a number of factors. The quality of education is an important consideration but other factors are too, such as fluctuations in exchange rates, and 7 opportunities other than education (such as work and leisure) that the destination can offer. Research conducted by TNS Global on behalf of Education New Zealand (ENZ) in early 2016 found that students considering New Zealand as a place to study believe it is a country that encourages independent thinking and problem solving. In order to achieve growth in international education, providers must commit to maintaining a diversified market, and understanding and meeting the 7 expectations and needs of students.
New Zealand has invested in market growth opportunities in the US, Colombia, the Philippines and Indonesia and uses the Export Education Levy fund to strengthen regional partnerships and diversify the spread of international students across New Zealand. New Zealand’s international education industry received $750,000 in 2015/16 for the Regional Partnership Programme, which will benefit from an additional $1.25 million in 2016/17. The additional funding will be used to expand the scope of this programme to encompass more regions and encourage pan-regional activities. These initiatives are designed to highlight New Zealand’s regional education offerings to a global market.
Research shows that industry must put the interests of students, and the quality of the education offering, first. Helms (2015) quoted on wes.org, warns that countries should not think of international students as ‘cash cows’, but recognise the greater benefits to an economy, including long-term 6 economic development and greater awareness among domestic students of global perspectives. The British Council’s “The shape of international education to 2025” also highlights the importance of the “cultural diaspora” in attracting students. It highlights Japan as a best practice country for its efforts in 7 offering halal food on campus to cater for the growing, mostly Muslim, Indonesian market.
6
http://wenr.wes.org/2016/05/placing-international-student-mobility-in-a-quality-and-ethical-perspective/ British Council’s The Shape of International Education to 2025 https://www.ox.ac.uk/sites/files/oxford/International%20Trends%20in%20Higher%20Education%202015.pdf
7 8
9
27
26
P a g e
http://enz.govt.nz/markets-research/general-research/april-2016-student-visa-dashboard
27
27
P a g e
New Zealand International Education Snapshot: 2015 full year report
New Zealand International Education Snapshot: 2015 full year report
Appendix 1: Technical notes
Definition of Enrolments An ‘international student enrolment’ in this report refers to a record of student activity, represented by the number of enrolments a provider has counted. Under this definition, if a student enrols in six courses at the same provider, this is considered as six enrolments. This means an individual student will be counted more than once if they have enrolled in more than one course at the same provider.
Definition of an international student As part of the Economic Impact of International Education 2012/2013 study, Education New Zealand (ENZ) revised its definition of international students to align with international standards.
This count is different to the Export Education Levy’s definition of enrolments, where enrolments are a count of students at each education provider. Under this definition, if a student enrols in six courses at the same provider, this is considered one enrolment, but if they enrol at two different providers then they count as two enrolments.
ENZ defines international students as students who are non-residents of New Zealand who: •
have entered into New Zealand expressly with the intention to study, or
•
have enrolled in a New Zealand provider offshore, where the educational programme is delivered in-market.
Along with full fee-paying students, the following categories have been included when measuring the 9 economic value and performance of the international education industry :
Data sources The data in this report has been extracted from a number of sources outlined below:
•
international PhD students
•
exchange students
•
NZ AID students
•
foreign research postgraduate students
•
offshore and onshore students
1. School data is obtained from the ENROL database. The data is at individual student level. 2. Tertiary providers that receive government funding submit a statistical return called the Single Data Return (SDR). The SDR holds data at the individual student level. 3. Private Training Establishments (PTEs) that do not receive government funding (non-SDR providers) submit levy information via a web page (see The Export Education Levy) or a protected spreadsheet. This data is only at provider level. 4. Subsidiary providers include those who are mostly affiliated with a larger tertiary provider, but they may have different reporting requirements to the larger provider. These providers submit levy information via a web page. The data is only at provider level.
Definition of a Private Training Establishment (PTEs) PTEs are tertiary education providers that are privately owned. They are registered by NZQA and to enrol international students they must be signatories to the Code of Practice for the Pastoral Care of International Students. For the purposes of this report:
The Export Education Levy The Export Education Levy is an industry levy used to support a broad range of activities and projects related to strengthening the industry. The fund is used to pay for marketing of the industry, promotion of New Zealand as an educational destination, capability development of staff involved in the industry, research, and to run the Code of Practice office which supports and monitors the pastoral care of international students. Regulations prescribing the levy first came into force on 10 January 2003. The Levy is made up of a flat fee component payable by each provider. Further information on the collection of the Export Education Levy can be found here.
1. SDR Provider refers to PTEs that receive government funding (Youth Guarantee and/or student achievement component – SAC) for eligible domestic students. Levy data (see below) is collected via SDR electronic files. 2. Non-SDR Providers refers to PTEs that do not receive government funding. They summit levy data via a web page or by submitting a protected spreadsheet. 3. English Language Schools are non-SDR PTEs that solely offer English language tuition, although other larger institutions may also offer English language tuition. Where we refer to PTEs in this report, this includes PTEs which are SDR providers, non-SDR providers and English Language schools. Any variations of this are clearly noted throughout the report, for example under the “Sector Trends” section we analyse the English Language Sector separately, and therefore the PTE section refers to SDR providers and non-SDR providers only. Definition of Students Where we refer to ‘student numbers’ in this report, this is a headcount. Headcount is a distinct count of students, where a student is counted once per subsector, rather than once per provider. Due to data collection limitations, MoE are currently unable to split out individual students for unfunded providers and subsidiaries (see Data sources).
9
Students within these categories are considered to be domestic students under the Education Act 1989.
29
28
P a g e
29
29
P a g e
New Zealand International Education Snapshot: 2015 full year report
A NEW TYPE OF CLASSROOM — NEW ZEALAND.
Appendix 2: Summary Tables INTERNATIONAL EDUCATION IN NEW ZEALAND - 2015 NUMBER OF INTERNATIONAL STUDENTS Sector Total Schools Tertiary* Non SDR PTEs**
2010
2011
2012
2013
2014
2015
103,642 17,217 45,271 41,154
103,525 16,777 47,650 39,098
98,119 16,567 46,956 34,596
96,471 16,719 47,350 32,402
109,547 17,430 53,006 39,111
124,357 17,918 60,522 45,917
2015 % of total 100% 14% 49% 37%
2015 % change cf. 2014
14% 3% 14% 17%
2015 % change cf. 2010
20% 4% 34% 12%
New Zealand’s fresh approach to life creates the perfect conditions for education.
* Universities, Institutes of Technology and Polytechnics, Wananga and funded Private Training Establishments ** Non-funded Private Training Establishments, including English Language Schools
TOP ENROLMENTS BY PLACE OF ORIGIN
1 2 3 4 5 6 7 8 9 10 11 12 13 14 15 16 17 18 19 20 21 22 23 24 25
Country of origin
2010
2011
2012
2013
2014
2015
China India Japan Korea Philippines Thailand Germany Brazil Saudi Arabia USA France Viet Nam Malaysia Taiwan Switzerland Nepal Colombia Fiji Sri Lanka Russia United Kingdom Indonesia Chile Bangladesh Italy Other Total
23,669 11,791 9,157 14,944 912 3,450 4,683 3,166 5,322 2,797 2,127 2,086 2,562 1,952 1,306 142 478 1,250 412 1,065 793 559 656 150 457 7,451 104,353
25,286 12,613 8,698 12,376 1,200 3,123 4,160 3,092 5,686 2,719 2,186 2,373 2,517 1,784 1,222 253 593 1,110 621 1,128 820 677 719 166 490 7,830 104,319
26,068 11,650 8,893 9,886 1,220 2,929 3,623 2,561 4,267 2,501 2,273 2,424 2,376 1,468 1,065 289 747 942 751 1,105 919 679 663 157 459 8,088 98,782
26,919 12,093 9,703 8,446 1,191 3,101 3,452 2,333 3,352 2,542 2,250 2,178 2,054 1,397 1,025 336 456 946 840 1,059 960 746 840 175 515 7,613 97,191
30,177 20,222 9,744 7,910 1,995 3,692 3,467 2,728 3,245 2,466 2,317 2,022 1,807 1,246 1,083 800 745 1,062 842 1,046 1,006 865 856 352 516 8,169 110,263
34,058 29,235 9,471 7,352 3,643 3,329 3,311 2,983 2,780 2,764 2,324 1,920 1,823 1,273 1,145 1,136 1,131 1,073 1,003 986 981 937 894 620 574 9,035 125,011
TOP ENROLMENTS BY NZ REGION
NZ Region 1 2 3 4 5
Auckland Canterbury Wellington Waikato Otago
2015 % of total 27% 23% 8% 6% 3% 3% 3% 2% 2% 2% 2% 2% 1% 1% 1% 1% 1% 1% 1% 1% 1% 1% 1% 0% 0% 7% 100%
2015 % change cf. 2014
13% 45% -3% -7% 83% -10% -4% 9% -14% 12% 0% -5% 1% 2% 6% 42% 52% 1% 19% -6% -2% 8% 4% 76% 11% 11% 13%
2015 % change cf. 2010
44% 148% 3% -51% 299% -4% -29% -6% -48% -1% 9% -8% -29% -35% -12% 700% 137% -14% 143% -7% 24% 68% 36% 313% 26% 21% 20%
TOP ENROLMENTS BY LEVEL OF STUDY (TERTIARY)
2014
2015
68,571 9,367 6,815 5,555 5,595
79,160 10,547 7,456 5,925 5,669
2015 % change cf. 2014
Level
15% 13% 9% 7% 1%
1 2 3 4 5
30
Bachelors degrees Diplomas 5-7 Certificates 4 Graduate certs/dips Honours degrees
2014
2015
18,325 14,206 4,677 3,360 3,496
19,097 17,244 5,507 4,968 4,875
2015 % change cf. 2014
4% 21% 18% 48% 39%
30
P a g e
Education New Zealand
Crown copyright © 2016
Level 5, 160 Lambton Quay Lambton House Wellington 6144
This work is licensed under the Creative Commons Attribution 4.0 International License. To view a copy of this license, visit
Phone: +64 4 472 0788 Fax: +64 4 471 2828 Industry website: www.enz.govt.nz
http://creativecommons.org/licenses/by/4.0/ ISSN 2463-6177 (Print) ISSN 2463-6185 (Online)