REVIEW OF SCIENTIFIC INSTRUMENTS
VOLUME 69, NUMBER 4
APRIL 1998
New design of a variable-temperature ultrahigh vacuum scanning tunneling microscope F. Mugele,a) A. Rettenberger, J. Boneberg, and P. Leidererb) Fakulta¨t fu¨r Physik, Universita¨t Konstanz, D-78457 Konstanz, Germany
~Received 19 September 1997; accepted for publication 23 December 1997! We present the design of a variable-temperature ultrahigh vacuum ~UHV! scanning tunneling microscope which can be operated between 20 and 400 K. The microscope is mounted directly onto the heat exchanger of a He continuous flow cryostat without vibration isolation inside the UHV chamber. The coarse approach is performed with an inertial slider driven by the same piezo tube that is also used for scanning. The performance of the instrument is demonstrated by two different kinds of measurements: First we show topographic images of close packed metal surfaces with atomic resolution. Then, we present results from scanning tunneling spectroscopy measurements on WSe2 under illumination at variable temperatures. © 1998 American Institute of Physics. @S0034-6748~98!02004-8#
I. INTRODUCTION
The STM has been used and proven to work reliably for about two years.
Since its invention by Binnig and Rohrer1 scanning tunneling microscopy ~STM! has evolved into a powerful tool in surface science. Its atomic scale resolution has greatly enhanced the microscopic understanding of the static structure and various dynamic processes on homogeneous or heterogeneous surfaces. It soon became desirable to perform experiments at temperatures other than ambient. For instance, growth processes studied by STM at variable temperatures2 revealed new information on diffusion of adatoms having enormous impact on technological problems in epitaxy. Furthermore, the electronic structure of the sample, which can also be probed locally by the STM, may exhibit an interesting temperature dependent behavior, as for instance, in superconducting or charge density wave phase transitions. Recently, the influence of individual dopant atoms on the electronic band structure of semiconductors was investigated at low temperatures.3 The main problem typically encountered in the design of a variable ~low! temperature STM stems from mechanical vibrations due to the cooling liquid in the cryostat. Most of the instruments described so far4 require more or less sophisticated and voluminous vibration isolation stages. From our point of view, these designs suffer from one or more of the following drawbacks: ~i! The large number of mechanical parts increases the expense of construction and tends to reduce the long-term stability and reliability of the instrument. ~ii! In situ sample exchange is complicated or not possible at all. ~iii! STMs suspended on springs are not suitable for optical experiments because the relative positions of the laser beam and the sample are not well defined. In the following, we present a STM design which circumvents these problems.
II. INSTRUMENT DESIGN A. Ultrahigh vacuum system
The ultrahigh vacuum ~UHV! system consists of three individual chambers and a loadlock for rapid sample access. The whole system is mounted on a steel frame which is filled with lead. The rack resides on four pneumatic isolators ~Newport! for mechanical decoupling from external perturbations like low frequency building vibrations. Chamber I contains conventional surface analysis techniques @lowenergy electron diffraction ~LEED!, Auger electron spectroscopy ~AES!, mass spectrometry#. Chamber II is used for the preparation of metal films with thicknesses up to several hundred nanometers. Metals are thermally evaporated from tungsten boats. The substrates can be heated to 900 K during evaporation and the film thickness is monitored by a quartz crystal balance. A sputter source is also available in that chamber. The STM is housed in an additional chamber ~III!. It contains the cryostat, the STM, and a sample stock for up to 12 samples. The samples are mounted on 535320 mm3 sample holders made from stainless steel. A wobble stick with a simple bayonet system is used to transfer them from the stock to the STM or to a magnetic transfer rod to the other chambers. A home-made microevaporator allows the deposition of small amounts of metal with the sample kept at the desired temperature ~20–400 K! inside the STM. The material is thermally evaporated from a tungsten filament and the average thickness is controlled by a quartz crystal balance. The loadlock chamber is connected to chamber II. A turbomolecular pump which is also used to pump down the whole UHV system is mounted on the loadlock chamber. For high resolution STM measurements it is turned off to eliminate vibrational noise ~450 Hz!.
a!
Present address: Materials Sciences Division, Lawrence Berkeley National Laboratory, University of California, Berkeley, CA 94720. b! Author to whom correspondence should be addressed. 0034-6748/98/69(4)/1765/5/$15.00
1765
© 1998 American Institute of Physics
Downloaded 16 Oct 2006 to 130.89.92.11. Redistribution subject to AIP license or copyright, see http://rsi.aip.org/rsi/copyright.jsp
1766
Rev. Sci. Instrum., Vol. 69, No. 4, April 1998
Mugele et al.
B. Continuous flow cryostat
The cryostat is a custom-built continuous flow cryostat5 which can be cooled with either liquid He or liquid N2. It is mounted vertically with the heat exchanger pointing downward into the chamber. To increase its mechanical stability the total length of the cryostat from the CF 63 top flange to the cold plate was reduced to 21 cm. A radiation shield cooled by the He exhaust gas encompasses the heat exchanger and a volume of 4 cm in diameter and 6 cm in height in which the STM is comprised. The cooling shield has one opening of 2 cm33 cm for sample exchange and two more ~diameters of 10 mm! for optical access to the sample at an angle of 20° and for in situ evaporation of small amounts of metal. The opening for the sample transfer can be closed with a shutter to reduce thermal radiation at low temperatures. The cryostat allows cooling to He temperatures within 30 min. However, we prefer to cool down the STM at a slower rate ~'2 h from 300 to 100 K; '20 min, from 100 to 20 K! to allow for better relaxation of stress due to differential thermal expansion. The instrument is equipped with two thermometers: A Rh/Fe resistor is mounted on top of the heat exchanger and a Si diode ~Lakeshore 470-SD13! is fixed on the sample platform ~see below! as close as possible to the sample. Coarse adjustment of the temperature is performed by controlling the He flux through the cryostat. A cold valve on the Dewar side of the transfer tube and a needle valve on the exhaust gas side of the cryostat allow stabilization to within 0.1 K. Final stabilization (DT,10 mK) is conducted by a proportional integral differential ~PID!-temperature controller6 which uses the Rh/Fe resistor as a temperature sensor7 and a heater which is also attached to the heat exchanger. Using the heater, any temperature between 4 ~at the Rh/Fe resistor! and 400 K can be stabilized. For T.100 K we use liquid N2 as cooling liquid. We do not observe any dramatic increase of the noise level compared to liquid He. In a calibration experiment with an additional Si diode mounted on a special sample holder, the lowest temperatures achieved with an open shutter in the radiation shield were 4.0 K at the heat exchanger and 11.1 K at the sample platform. Simultaneously, 24 K was measured at the sample holder. The rather large thermal resistance between the sample holder and the sample platform is a sacrifice to convenient in situ sample exchange. At temperatures above 50 K the readings from all three thermometers agreed to within 0.2 K. At the lowest temperatures, the liquid helium consumption is 1.2–1.5 l /ph.
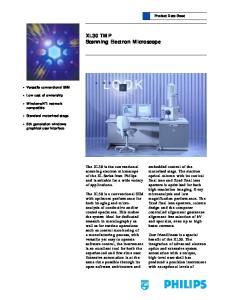
FIG. 1. Linear motor for coarse approach and scanning.
both driving the inertial slider and scanning the sample. The operation and performance of this linear motor are described elsewhere.8,12 Figure 2 shows a cross sectional view of the STM. The central part consists of the just mentioned linear motor @Fig. 2~a!#. It is surrounded by an outer piezo tube @Fig. 2~b!, o.d. 0.5 in.# for passive thermal expansion compensation. In principle, the latter can be used to enlarge the scan range or for x/y offset. The scanning module, consisting of these two piezos, is connected to the body of the STM by a ring made from Invar steel. The L-shaped body of the STM is screwed directly onto the cold plate of the heat exchanger. Sample holders @Fig. 2~d!# can be introduced from the right through the opening in the radiation shield. They are pressed onto the sample platform @Fig. 2~e!# by a spring-loaded sapphire ball ~f!. The sample platform is electrically isolated from the main part of the STM by a sapphire plate @Fig. 2~g!#. To improve thermal contact between the sample platform and the main part, thin gold foils were introduced between the metal–sapphire contact areas. A Kapton isolated 40 mm copper wire leads from the sample platform to the IV converter13 which is on the outside of the UHV chamber. Note that, except for the tip holder, all parts of the microscope are fixed tightly together. Minimizing the number and the mass of the movable components in this way leads to optimum mechanical stability.
C. STM design
The STM design we describe here focuses on a very compact and mechanically stable construction. It is based on a prototype that we already presented earlier.8 Like in that prototype, we use an inertial slider for the coarse approach of the tip. The tip is mounted in a tiny tip holder which is forced onto parallel tracks9 by a magnet ~see Fig. 1!. These tracks are glued10 to the front end of the piezo tube11 @outer diameter ~o.d.! 0.25 in., length 15 mm# which is used for
FIG. 2. Schematic drawing of the UHV-STM. ~a! Linear motor ~inner piezo tube, tracks, tip holder!; ~b! outer piezo tube; ~c! magnet; ~d! sample holder; ~e! sample platform; ~f! sapphire plate; ~g! sapphire ball.
Downloaded 16 Oct 2006 to 130.89.92.11. Redistribution subject to AIP license or copyright, see http://rsi.aip.org/rsi/copyright.jsp
Mugele et al.
Rev. Sci. Instrum., Vol. 69, No. 4, April 1998
1767
III. TEST MEASUREMENTS A. General information
STM tips are made from 0.5 or 0.25 mm polycrystalline tungsten wire. They are electrochemically etched in 3 M NaOH solution. Further cleaning is performed by field emission in UHV. The counterelectrode is made from polycrystalline Ta and is mounted on a sample holder. A typical field emission voltage is 300 V and currents from initially '20 down to '1 m A at the end of the preparation procedure are used.14 The cleanness of the tip is monitored by performing I(V) and I(z) spectroscopy ~cf. inset of Fig. 4!. The former has to be linear within a reasonable range of bias voltage and the latter has to yield an apparent barrier height of several eV. The tip preparation procedure works reliably and allows restoration of the tip whenever it becomes necessary. Although we originally designed a tip exchange mechanism, we did not feel a need to install it so far because tips can typically be used for up to six months. Frequently, the field emission procedure is followed by a final treatment using voltage pulses or gentle tip–sample contact to further improve the lateral resolution of the tip. We note that both these final steps of tip preparation as well as spontaneous tip changes during STM operation sometimes deteriorate the previously obtained results from I(V) and I(z) spectroscopy. Therefore, to check that the tip remained clean all the time, spectroscopic measurements have to be repeated at the end of each measurement. As the entire microscope is thermally anchored to the cryostat, both the STM and sample are essentially at the same temperature. Thus large thermal gradients which are present in many other variable temperature STM designs4 are avoided. This eliminates possible disturbances due to the ‘‘hot’’ tip scanning the cold sample.15 Furthermore, it contributes to the low drift of ,5 pm/min perpendicular to the surface and ,50 pm/min in the x/y direction. At room temperature, the thermal expansion is 55 and 46 nm/K in the z and x/y directions, respectively. These values are mainly due to the sample holder and the way it is clamped onto the sample platform. The maximum scan range at room temperature is 3 mm33 mm. It is reduced to less than 1 mm31 mm at the lowest temperatures. From STM images with atomic resolution, we found that the piezo constant decreases to 65% and to 25% of its room temperature value at T5100 and 20 K, respectively ~see Fig. 3!.
FIG. 3. Normalized piezo coefficient vs temperature.
peak at '2.75 kHz. In view of the direct mechanical contact between the cryostat and the STM, the gas flux-induced increase of the noise is remarkably low. The absence of distinct resonances at low frequencies (,1 kHz), especially allows for recording high resolution STM images. C. Topographic images
To demonstrate the performance of the STM we first present topographical images of close packed metal surfaces. The samples are ~111! oriented thin films of Ag and Au ~thickness: 100 nm! on mica substrates. The films are prepared by thermal evaporation in the preparation chamber. During evaporation (rate'1 nm/s), the substrates are kept at T5600 and 650 K, respectively. The films exhibit atomically flat facets up to several hundred nanometers wide. As thermal evaporation involves a ‘‘destillation process’’ and as no further sputtering or annealing is required for sample preparation, the surfaces display far fewer impurity atoms than typically encountered in single crystal preparation. Figure 5~a! reproduces unfiltered STM data from the core region of a screw dislocation on Ag~111!. A local background subtraction ~averaging area 232 atoms2! was applied to display the atomic corrugation on both sides of the dislocation simultaneously. The image was recorded at T 5100 K with liquid He cooling and counterheating. The atomic lattice is clearly resolved with a peak-to-peak corrugation of roughly 10 pm. From cross sections along the atomic rows a root-mean-square ~rms! atomic corrugation of
B. Noise performance
Figure 4 shows noise spectra of the tunneling current, recorded on a polycrystalline Ta sample at room temperature. From I(z) spectroscopy measurements ~see the inset! performed immediately after recording the noise spectra we obtained an apparent barrier height of 4.36 eV, as expected for a clean tunneling gap.16 Trace ~A! was recorded without a gas flux through the cryostat. It shows only one weak resonance at '1.6 kHz. The second trace ~B! was recorded with a gas flux of 80 l/s through the cryostat. Using He as the cooling agent, this flux allows cooling to about 100 K. The overall noise level is somewhat increased and the resonance at 1.6 kHz shows up more pronounced, as does the second
FIG. 4. Tunneling current noise spectrum without @trace ~A!# and with @trace ~B!# a gas flux through the cryostat. ~I50.1 nA; U tip521 V; T5295 K.! The average noise level corresponds to 320 fA/AHz @curve A#, referred to as the output of the I – V converter. Inset: I(z) spectroscopy data recorded immediately after the noise spectra.
Downloaded 16 Oct 2006 to 130.89.92.11. Redistribution subject to AIP license or copyright, see http://rsi.aip.org/rsi/copyright.jsp
1768
Rev. Sci. Instrum., Vol. 69, No. 4, April 1998
FIG. 5. Topographic image of a screw dislocation on Ag~111! ~a! recorded at T5100 K ~I510 nA; U tip550 mV!. The atoms along the top row of the dislocation appear brighter due to a local background subtraction. ~b! Atomic resolution on Au~111! (T555 K) together with a 223 A3 reconstruction pattern ~I510 nA; U tip5250 mV!. The lines indicate the direction across and along the reconstruction pattern, respectively.
4 pm is obtained. A hexagonal lattice @see Fig. 5~a!# is fitted to the atomic positions in the left-hand part of the image. One can clearly see the deviations on the right-hand side due to the dislocation. Figure 5~b! shows unprocessed raw data from a Au~111! surface imaged at T555 K. Again, the atomic lattice is clearly resolved together with the large scale height modulation due to the 223) reconstruction pattern. Looking along the solid line, one can discern the shift of the atomic rows by half of the row spacing in the @112¯# direction, which is induced by the partial dislocation of the reconstruction pattern.17 STM pictures of similar quality are obtained routinely at any temperature between 20 and 300 K. For T,30 K, the increased liquid He flux sometimes leads to periodic perturbation with a peak-to-peak amplitude of '5 pm. D. Spectroscopic measurements
As a second example of the performance, we present spectroscopic data obtained on semiconducting p-doped WSe2 single crystals. Like other transition metal dichalcogenides, WSe2 has a layered structure with chemically inert van der Waal surfaces. The samples are cleaved either in air or in UHV parallel to these ~0001! planes. Curve ~A! in Fig. 6~a! shows an I – V characteristic typically obtained for both methods of preparation. It displays Schottky behavior. In the forward bias direction ~negative tip bias voltage!, a strong increase of the current is observed when tunneling of electrons from the tip into the conduction band sets in. In reverse
Mugele et al.
FIG. 6. ~a! I – V spectrum on air-cleaved p-type WSe2 without ~A! and with ~B! illumination ~U ref521.4 V; I ref51 nA; T5300 K!. ~b! Photoinduced current at U tip52.5 V vs temperature. The solid line is a guide to the eye.
bias, no tunneling current is observed within the range of bias voltage shown here. This is due to tip-induced bending of the electronic bands in the sample.18 In our STM, the samples can be illuminated during scanning tunneling spectroscopy ~STS! measurements, e.g., using a He/Ne laser. Then, dramatic differences between air- and UHV-cleaved surfaces are observed: The I – V characteristic of UHVcleaved surfaces remains essentially unaltered, whereas for the air-cleaved samples @see curve ~B! in Fig. 6~a!# an additional photoinduced current in reverse bias is observed. On the latter, minor traces of contaminants induce band bending which drives photogenerated minority carriers ~electrons! to the surface from which they can tunnel into the empty states of the tip. Here, we want to focus on the capability of our instrument to perform STS measurements at variable temperatures. Figure 6~b! shows the photoinduced current at large bias voltage versus temperature which is related to the diffusion length and mobility of the electrons. Upon decreasing temperature, it first increases and then decreases again until it almost vanishes at '80 K. This behavior is reminiscent of the temperature dependent mobility of majority carriers that is observed, for instance, in Hall measurements.19 More details regarding these phenomena will be reported elsewhere.20 For UHV-cleaved samples no photoactivity is observed because electron–hole separation does not occur in the absence of contaminant-induced band bending. To investigate the influence of adsorbate-induced band bending in more detail, we ‘‘contaminated’’ the UHV-cleaved surfaces in a con-
Downloaded 16 Oct 2006 to 130.89.92.11. Redistribution subject to AIP license or copyright, see http://rsi.aip.org/rsi/copyright.jsp
Mugele et al.
Rev. Sci. Instrum., Vol. 69, No. 4, April 1998
1769
2
FIG. 7. Faceted Au crystallites on WSe2 ~I50.15 nA; U tip521.4 V!.
trolled way by evaporating small amounts of Au onto the samples. Depending on the deposition temperature, faceted, triangular shaped crystallites are formed ~see Fig. 7! with their edges oriented along the high symmetry directions of the substrate.21 From future STS measurements under illumination at variable temperatures and at variable distances from the Au crystallites we expect information on local band bending, diffusion length, carrier mobility, etc. The results presented here show that our instrument is a powerful tool for both STM and STS measurements at variable temperatures and under illumination. In particular, we demonstrated that the rigid design of our STM allows the recording of high resolution images at variable temperatures without complicated vibration isolation systems, as is required in conventional designs. ACKNOWLEDGMENTS
The authors would like to thank H. Bleyer, P. Bruker, J.-Y. Grand, R. Mo¨ller, K. Orgassa, and M. Rupflin for their contributions in various stages of the development of the UHV system. This work was supported by the Deutsche Forschungsgemeinschaft ~DFG! by SFB 513. 1
G. Binnig and H. Rohrer, Hel. Phys. Acta 55, 726 ~1982!; G. Binnig, Ch. Gerber, E. Weibel, and H. Rohrer, Phys. Rev. Lett. 50, 120 ~1983!.
For a recent review, see, for example, Z. Zhang and M. Lagally, Science 276, 377 ~1997!. 3 M. C. M. M. van der Wielen, A. J. A. van Roij, and H. van Kempen, Phys. Rev. Lett. 76, 1075 ~1996!. 4 M. Bott, Th. Michely, and G. Comsa, Rev. Sci. Instrum. 66, 4135 ~1995!; S. Horch, P. Zeppenfeld, R. David, and G. Comsa, ibid. 65, 3204 ~1994!; G. Meyer, ibid. 67, 2960 ~1996!; S. Behler, M. K. Rose, J. C. Dunphy, D. F. Ogletree, M. Salmeron, and C. Chapelier, ibid. 68, 2479 ~1997!. 5 CryoVac GmbH, Troisdorf, Germany. 6 TIC 304-M, CryoVac GmbH. 7 The Si diode cannot be used during STM measurements because it leads to significant capacitive crosstalk to the tunneling current. 8 F. Mugele, Ch. Kloos, P. Leiderer, and R. Mo¨ller, Rev. Sci. Instrum. 67, 2557 ~1996!. 9 The steel rods are hardened axes for needle bearings kindly provided by the INA Company. 10 We used the two component epoxy, Torr Seal from Varian Vacuum Products. 11 PIK 155 from PI Ceramic, Gera, Germany. 12 F. Mugele, Dissertation, Universita¨t Konstanz, 1997; UFO, Stuttgart, Germany, ISBN 3-930803-15-1. 13 We simply use an OPA 111 ~Burr–Brown! with a 100 MV resistor in the feedback loop. 14 At the highest currents, sometimes neck formation occurs between the tip and the sample, probably due to melting of the Ta surface. Retracting the piezo then frequently leads to very sharp tips. 15 To our mind, it is surprising that such influences are hardly ever discussed in the context of online diffusion measurements using variable temperature STMs with uncooled tips. See, for example, J.-B. Xu, K. La¨uger, R. Mo¨ller, K. Dransfeld, and I. H. Wilson, J. Appl. Phys. 76, 7209 ~1994!. 16 It is essential to check for a clean tunneling gap because contaminants in the tunneling gap, which would lead to apparent barrier heights below 1 eV, would ‘‘artificially’’ reduce the noise level. 17 Ch. Wo¨ll, S. Chiang, R. J. Wilson, and P. H. Lippel, Phys. Rev. B 39, 7988 ~1989!; J. V. Barth, H. Brune, G. Ertl, and R. J. Behm, ibid. 42, 9307 ~1990!. 18 Ch. Sommerhalter, Th. W. Matthes, J. Boneberg, P. Leiderer, and M. Ch. Lux-Steiner, J. Vac. Sci. Technol. B 15, 1876 ~1997!. 19 R. C. Fivaz and Ph. E. Schmid, in Optical and Electrical Properties of Layered semiconductors, edited by P. A. Lee ~Reidel, Dordrecht, 1976!. 20 A. Rettenberger, P. Broker, F. Mugele, J. Boneberg, and P. Leiderer ~unpublished!. 21 A. Rettenberger, P. Bruker, M. Metzler, F. Mugele, Th. W. Matthes, M. Bo¨hmisch, K. Friemelt, J. Boneberg, and P. Leiderer, Surf. Sci. ~accepted!.
Downloaded 16 Oct 2006 to 130.89.92.11. Redistribution subject to AIP license or copyright, see http://rsi.aip.org/rsi/copyright.jsp