Network-level characteristics of Spamming: An empirical analysis Marios Kokkodis
Michalis Faloutsos
Athina Markopoulou
Dept. of CS&E University of California Riverside Email:
[email protected]
Dept. of CS&E University of California Riverside Email:
[email protected]
Dept. of CS University of California Irvine Email:
[email protected]
Abstract—Has the behavior of spammers changed over the last few years? To answer this question, we conduct a study from three recent data sources. Specifically, we focus on the following broad questions: (a) how are email addresses harvested, (b) where is spam coming from, and (c) how does spam evolve over time. First, we discuss whether spammers still use email harvesting : 34% of the honeypot accounts we publicised received spam after 72 days on average. Interestingly, we find that simple email address obfuscation is quite effective against harvesting. Second, we identify significant skew in the spatial distribution of the origin of spam in both the IP-level and AS-level of granularity. We find that 20% of the active IPs are responsible for 80% of the total volume of spam and that 10% of the spamming ASes are responsible for the 90% of the volume. Finally, we study the temporal characteristics of the spamming IPs and find that spam activity has spread to new /8 subnetworks since 2006. Considering these spatio-temporal trends, the future of anti-spam is mixed: the current skewed spatial distribution of spam sources could be helpful in filtering spam, but the fact that spam sources are spreading in the IP space is a worrisome sign.
I. I NTRODUCTION Spamming has been and continuous to be a major problem for network administrators over the last two decades. During this time, the yearly volume of global spam has been steadily increasing, while spammers have been constantly evolving their techniques from simple open-proxy spamming to both centrally and distributively controlled botnet-based spamming [10], [17], [28]. At the same time, network administrators are still searching for ways to improve their defenses against spamming [18], [19]. Naturally, having up to date information on the behavior of spam can help us improve anti-spamming techniques and estimate the extent of the problem. For example, IP-based filtering techniques (e.g. blacklisting) can benefit directly by a better understanding of the network-level behavior of spammers. In fact, some recent promising techniques rely on developing models, clustering, and predicting malicious IPs [18], [19]. Note that the last extensive study focusing on spamming characteristics was conducted in 2006 [17]. We discuss previous work in more detail in section II. In our work, we observe spamming from three different points of view: (a) the harvesting of email user accounts, (b) the spamming IP/AS-level characteristics, and (c) the temporal evolution of the spamming behavior. We use three different datasets. The first dataset consists of spam messages sent to our honeypot email accounts, which are publicized on
the web to measure harvesting activities. The second dataset (UCR-spam dataset) consists of the spam messages received by the University of California Riverside network. The last dataset (Spam Archive) is a publicly available archive of spam messages gathered by various user accounts during the last 15 years. We discuss these datasets in more detail in section III. Our work can be seen as an effort to answer the following three broad questions: Q1 : Are spamming crawlers still use to harvest useraccounts from the web? Are obfuscated user accounts as vulnerable as unobfuscated1ones? We find that crawlers are still interested in harvesting user accounts. Surprisingly we observe that simple obfuscation is still a good idea. To conduct our analysis we setup a honeypot: we use a UCR publicly unknown domain and we advertise user accounts in different ways on the web (posted at blogs, twitter etc). We then monitor the spam messages that they receive as a result of account-harvesting. We find that 34% of our unobfuscated accounts are collected by spammers within 72 days on average. Interestingly, none of the obfuscated email accounts receives any spam message! Q2 : What is the spatial distribution of spammers across the IP and AS space? We find that both distributions are highly skewed. This is good news, since it shows that filtering on the network level could be effective. We observe that 20% of the active IP-space is responsible for 80% of the total volume of spam we receive, and that the distribution of spamming IPs follows a generalized Pareto distribution [6] with shape parameter ξ = −0.1482, scale parameter σ = 0.1398 and location parameter µ = 0. To conduct the AS level analysis we use the UCR-spam dataset and the cymru IP to Autonomus System (AS) number mapping [21] to identify the spamming ASes. Our results show that 10% of the spamming ASes contribute 90% of the total received volume of Spam and their contribution follows a generalized Pareto distribution [6] with shape parameter ξ = 0.2812, scale parameter σ = 0.0236 and location parameter µ = 0. Q3 : What are the temporal characteristics and what is the persistence of Spamming IPs? We observe that spamming IPs spread across the IP space. This is bad, as it suggests that 1 We consider unobfuscated user accounts those in the form “username@domain” and obfuscated those that include some type of obfuscation (e.g.,”username[at]domain”).
in the future the skewness of the spamming behavior may decrease. We observe that starting in 2007, a new spamming IP-space appears on the spamming map, and that the two already known spamming spaces [17] are steadily becoming wider. These two findings indicate that there is a temporal spreading of spamming IPs across the allocated IP space. Regarding the persistence of spamming IPs, we find that 49% of the spamming IPs appear in our dataset at least twice, while 82% of them remain active for less than one day. Interestingly, we find that there exist IPs that send several thousands of spam messages (up to 22000) in the UCR-spam dataset. This last observation indicates that IP filtering could be effective by blocking such persisting spam-contributing IPs even if applied at the locality of a single network. The rest of this paper is organized as follows. In section II we present the related work on the network level behavior of spamming as well as the current network-level mitigation techniques. Next, in section III, we provide information about the collection of the data we use to conduct our analysis. In section IV we present the details of the honeypot we use to study the harvesting of user account from spamming crawlers and we discuss the statistics of its outcome. In section V we study the IP-AS level spatial characteristics of spamming and, in section VI, we discuss the temporal evolution of spamming.Finally we conclude in section VII. II. R ELATED W ORK In this section we review the recent work that address the spamming problem in various aspects. In II-A we present empirical studies that quantify the network behavior of spammers. In II-B we describe the network-level defense strategies that have already been proposed, while in II-C we give a brief description of the most recent studies regarding spamming botnets. A. Network Behavior of Spammers Significant amount of work has been done in the previous years regarding the IP-level behavior of spammers. In 2006, Ramachandran and Feamster provided a thorough study regarding the network-level behavior of spammers [17]. Their analysis showed that the majority of spam comes from botnets, while the three other mentioned techniques (direct spamming, open relays and proxies and BGP spectrum agility) share limited participation in the spam procedure. Furthermore they analyzed the origin of the received spam, showing that two active IP spaces are responsible for the majority of the messages. Li and Hsieh conducted an empirical study of the clustering behavior of spammers [12]. In their analysis they show that there are highly clustering structures within spammers, regarding specific grouping criteria (such us same URL in the spam email). In 2008, Chen et al. studied the spatial-temporal characteristics of Internet malicious sources [2]. By analyzing a trace from DShield.org logs [5], they observed that 80% of the malicious traffic is originated from the same 20% of the IP space. Finally, recent works studied the implications that shutting down MacColo [13] had to spamming activity [3],
[4]. Both studies show a drop in spam volumes right after the server shut down. B. Network-level Mitigation Techniques Most of the related literature is dedicated to mitigation techniques. Among others, various IP-based filtering techniques have been proposed in the recent years. Blacklisting is the most commonly used technique. Back in 2004, Jung and Sit observed that 80% of the identified spam sources of their dataset were found in at least one DNS blacklist [11]. However, Ramachandran et al. showed in [16] that DNS-based blacklists cannot keep up with bots, which is the main source of today’s spamming activity. Furthermore, Ramachandran et al. proposed a spam filtering system that classifies email senders according to their sending behavior [18]. Their system uses fast clustering algorithms that react quickly to changes in the sending pattern of spam messages. In addition, filtering of malicious IPs methods have been proposed in the last two years [19], [27]. Finally, in 2006 Xie et al. proposed an effective defense strategy against spam that originates from open-proxies, based on a characteristic (packet symmetry) of “spam laundering” [23]. C. Spamming Botnets Since the vast majority of spam messages are due to spamming botnets, a lot of work is dedicated to studying their behavior, as well as to proposing techniques for spamming botnet detection. Husna et al. use temporal characteristics of spammers to identify spam bots [9]. Their study shows that spammers demonstrate highly clustering structures on specific features (e.g., content length) which can be used for classifying them into botnet groups. Li Zhuang et al. attempted to characterize botnets by utilizing information from the email content [29] by using the shingling algorithm (clusters near-duplicate content together) to identify spam campaigns. In 2009, John et al. presented a system (BotLab) that continuously monitors and analyzes the behavior of spamming botnets [10], by integrating information from incoming and outgoing (by captive botnet nodes) spam. Furthermore, significant work has been done regarding the detection of spamming botnets during the last two years. Xie et al. presented in 2008 a framework that detects spamming botnets by generating individual spam signatures for each of them [26]. Xie Yu and Abadi in [24] presented a method for Internet host accountability, which could also be used for identifying botnets activities. Zhao et al. presented Botgraph, a system which detects a different kind of botnet spamming attacks which target major Web email providers [28]. III. DATA C OLLECTION We use three datasets to conduct our analysis. The first one consists of spam messages that were sent to harvested email accounts, the second (UCR-spam dataset) of spam messages received by the University of California Riverside network while the third (Spam Archive) is a publicly available trace of spam messages gathered by a set of user accounts during the last 15 years.
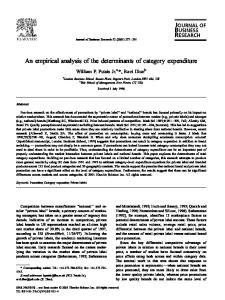
Fig. 1.
The UCR Data Collection Process.
A. The spam honeypot To study the user-acount harvesting, we set up a honeypot with a specially-created unused domain from the UCR computer science network (email . cs . ucr . edu). We randomly generate 136 unobfuscated (e.g., username @ email . cs . ucr . edu) email user accounts and 141 obfuscated ones (e.g., username [at] email [dot] cs [dot] ucr [dot] edu). We publish these accounts on the web in the following ways: • Public blogs: We include a total of 76 user accounts (39 unobfuscated and 37 obfuscated) in several articles in five different public blogs. • Myspace: We post 22 user accounts (11 unobfuscated, 11 obfuscated) in several posts on two myspace accounts. • Twitter: We create 9 twitter user accounts, and we use the twitter API to find followers and publish tweets that include email user accounts. In this way, we post a total of 42 user accounts (17 unobfuscated and 25 obfuscated) in several tweets from different users. • HTML code: We publish a total of 104 user accounts on the same web-page: – 8 (4 unobfuscated, 4 obfuscated) user accounts inside comment HTML tags. – 3 unobfuscated user accounts inside “mail-to” HTML tags. – 85 (41 unobfuscated, 44 obfuscated) user accounts as HTML text. • Google groups: We post 41 (21 unobfuscated, 20 obfuscated) user accounts in several posts on two separate threads. These accounts are being published from July 22nd to July 27th of 2009. We monitor the domain and expect some useraccounts to be harvested. Since these accounts and the domain are unknown to the Internet cloud before getting them public, every message we receive is unsolicited. One day after publishing the accounts, we received the first spam message. By April 15th 2010 we collected 529 spam messages in 46 unobfuscated accounts. B. The UCR Spam Dataset The UCR-spam dataset consists of spam messages that have been received by the UCR Computing and Communication Network from August 10th 2009 to April 22nd 2010. The spam collection process that we follow in order to create this dataset is depicted in Figure 1. E-mails arriving at the UCR’s Computing and Communications network are first filtered by an anti-spam defensive mechanism which
consists of three layers: Realtime Black-hole Lists (RBL’s e.g.:Spamhaus [20]), Grey Listing and Content Based Filtering (CBF). The CBF assigns a spam-like score to all emails. Messages that receive scores higher than 300 are automatically discarded, while those that receive scores between 50 and 300 are being delivered to our dataset. On a typical day, around 1.5 million e-mails arrive at the UCR network. Of those, 900000 (60%) are dropped during the RBL’s filtering and 50000 (3.3%) are not responding to Grey-listing requests. After the spam-like scores have been assigned by the CBF, 100000 (6.7%) are discarded since they have scores bigger than 300. From the remaining, around 8000 (0.6%) are included in our dataset, while the remaining 442000 (29.4%) are delivered to the network recipients. Each message is represented by a tuple that includes the message timestamp, the sender’s IP address2 and the message spam score (between 50 and 300). Our dataset consists of 2,747,656 such tuples. In conclusion, this dataset consists of spam messages that bypass current RBLs. As such, it is ideal for studies that analyze the network level behavior of spam and intend to improve the current IP-based filtering techniques. We use this dataset to analyze the spatial characteristics of the spamming space. C. Long-term Spam Archive The second dataset (Spam Archive) that we use is a spam archive provided by untroubled.org [1]. This collection consists of spam emails (both content and header) gathered by several specially-created email accounts for spam research. The majority of these emails were flagged as spam by SpamAssassin [8], a well known email filtering application. To increase our confidence in the dataset, we have manually verified a randomly-chosen subset of the emails, and we confirmed that they are spam. For each email in the dataset, we try to find its source IP. According to the SMTP protocol [15], each server that receives a message, appends a Received record (e.g. Received: from example.com ([77.49.119.108])) to the top of the email header. Hence, the earliest Received record should include the IP of the first SMTP server that forwarded the email (i.e. the source). However, in the case of spam, the protocol is often violated, since spammers have developed techniques to obfuscate their identities. An example of such a technique is to falsify the header information by either modifying it or by appending invalid Received headers [7]). Therefore, the relay that established the SMTP connection to our mail server is the only one that we can identify its true IP address. Note that the same method has been also used in the past [10], [17], [25]. Depending on the analysis we conduct we use a different time period subset of this dataset. First, for studying the per account spamming activity we use messages of the same time period of UCR-spam dataset (August 10th 2009 - April 22nd 2010). Then, to study the temporal evolution of spamming 2 As sender’s IP address we consider the IP of the last mail server that established the SMTP connection with one of the UCR mail servers, since is the only one we can trust, as discussed earlier.
0.8 0.7 0.6 0.5 0.4 0.3 0.2 0.1 0 0
50
100
150
1
0.9 0.8 0.7 0.6 0.5 0.4 0.3 0.2 0.1 0 0
200
Percentage (%) of Spamming Contribution
1
Cummulative Distribution Function
Cummulative Distribution Function
1 0.9
10
Number Of Days Before Harvesting an IP
20
30
40
50
60
0.8 0.7
User Account 1 User Account 2 User Account 3 User Account 4 User Account 5
0.6 0.5 0.4 0.3 0.2 0.1 0 0
50
100
150
200
IP Space − /8 Subnetworks
Number of Messages Per IP
(a)
0.9
(b)
Fig. 4.
CDF of top 5 most attacked user-accounts in the Spam Archive.
Fig. 2.
(a) CDF of the days before a user account gets harvested and receive a spam message (b) CDF of the number of messages received by each email user account.
100
1
Percentage (%) of Contribution
Cummulative Distribution Function
space we use messages from January 1st 2006 to December 31st 2010. 0.9 0.8 0.7 0.6 0.5 0.4 0.3 0.2 0.1 0 0
50
100
150
IP Space (/8 subnets)
200
90 80
Outlet Blogs MySpace Twitter HTML comments HTML text Mail-to (HTML) Google groups
# Advertised Accounts 39 11 17 4 41 3 21
70
# Harvested Accounts 4 0 6 0 33 3 0
TABLE I
60
D IFFERENT
50
WAYS OF ADVERTISING
unobfuscated USER -ACCOUNTS
40 30 20 10 0 0
20
40
60
80
100
Top (%) Spamming /8 Active Subnets
(a)
(b)
Fig. 3.
(a) CDF of the IP-space in UCR-spam dataset (b) Percentage of Contribution of all active spamming /8 subnets in decreasing order.
If we compare this dataset with UCR-spam dataset we observe that the two datasets do not spread quit similar across the IP space. The main difference is that in Spam Archive there is additional activity from IP-spaces that do not appear in UCR-spam dataset (discussed in VI).
will get harvested after some time x, for all accounts in our experiment that eventually get harvested. The average number of days for a user account to get harvested in our dataset is 72 days. Finally, in Figure 2(b), we present the CDF of the number of the messages that each account receives in this 8-month period. As we can see, around 80% of the user accounts receive less than 4 messages during this period. Observation 1: 34% of the advertised user accounts in our dataset have been harvested by spamming crawlers, within an average time period of 72 days. V. S PATIAL A NALYSIS
IV. H ARVESTING EMAIL
ACCOUNTS
In this section, we study the harvesting of user accounts by spammers using the honeypot data we described in section III-A. Interestingly, we began receiving spam messages just one day after publishing the honeypot accounts in the web. On April 15th 2010 our dataset consisted of 529 spam messages in 46 unobfuscated accounts. Account obfuscation works. To our surprise, none of our obfuscated accounts received any spam emails. In other words, even a simple obfuscation, like the one we used, can protect accounts against harvesting. A pessimist could argue that harvesters do not need to go into the trouble of de-obfuscating, as ready-to-use accounts can be easily found. In Table I we present the different ways we use to publish our user accounts with the respective number of harvested accounts. We consider only unobfuscated accounts in this analysis. It can be seen from the table that a total of 46/136 = 34% of these accounts has been harvested. How fast does harvesting happens? We compute the observed Cumulative Distribution Function (CDF) of the number of days that pass before each one of the harvested accounts gets collected and we present it in Figure 2(a). This distribution gives the conditional probability that a publicized user account
In this section, we study the spatial distribution of spamming IPs across the IP space and across Autonomous Systems (ASs). A. IP-level Analysis Several studies have already examined the distribution of spam activity across the IP address space. In particular we know the following: • Two IP-spaces are responsible for the majority of the observed spam [2], [17]. • The spam activity seems quite “concentrated” and follows the Pareto principle (the 80-20 rule) [2], [14]. These findings are implicitly optimistic, as they suggest that by focusing on a few highly active IP-prefixes, we may be able to mitigate the effect of spam activity. Here, we first study the distribution of spamming IPs across the IP space. In Figure 3(a), we show the cumulative distribution function (CDF) of all the spamming IPs in UCRspam dataset. Our results agree with the previous works of Ramachandran and Feamster [17] and Z. Chen et al. [2]. We can clearly identify two highly spam-active IP areas (60/8 100/8 and 190/8-222/8) that contribute the majority of spam in our network.
1 90
CDF of Spamming Contribution
Percentage (%) of Spamming Contribution
100
80 70 60 50 40 30 20 10 0 0
1
2
3
AS Number
(a)
4
5 4
x 10
0.9 0.8 0.7 0.6 0.5 0.4 0.3 0.2 0.1 0 0
20
40
60
80
100
Percentage(%) of top Spamming ASes
(b)
Fig. 5.
(a) CDF of ASes spamming contribution across the AS space (b) Distribution of AS spamming contribution in decreasing order.
Next, we investigate whether there are spam messages that originate from bogus IPs (i.e. Spamming with BGP agility [17]). To do this, we use the bogon IP-list provided by cymru [21] and check if such IPs appear in our dataset. We find that only 524 messages from our dataset originated from such subnets, which indicates that BGP agility should not be considered as a major spamming thread. Furthermore, we study the allocation of spamming IPs across the allocated and active IP space. We find that those IPs constitute 84% of the active IP space. This is a worrisome observation, since it shows that spamming originates from almost all the allocated IP space. However, if we analyze the contribution of those IPs and sort them in decreasing order, we estimate that they follow a generalized Pareto distribution [6] with shape parameter ξ = −0.1482, scale parameter σ = 0.1398 and location parameter µ = 0. To validate our estimation, we apply the Kolmogorov-Smirnov test [22] and we check our distribution with the generalized Pareto distribution that is generated from our observed values and the estimated parameters. The test verifies that our distribution is a generalized Pareto with the predefined parameters. This distribution is presented in Figure 3(b). From this figure, it can be observed that 20% of the active IP space is responsible for 80% of the total received volume of spam. Observation 2: We observe that 20% of the active IP space is responsible for 80% of the total received volume of spam. Further, the spamming IPs follow a generalized Pareto distribution across the active IP space. Finally, we study the per-account distribution of spamming IPs. In Figure 4, we present the spamming activity for each one of the top 5 most attacked user accounts in Spam Archive. The received messages in these accounts constitute 39.9% of the total volume of spam. We can observe that most accounts seem to have the same distribution across the IP space. B. AS-level Analysis We study the distribution of spamming IPs at the level of Autonomous Systems. In Figure 5(a), we present the CDF of the spamming ASes across the AS space as they appear in UCR-spam dataset. It can be observed that we receive spam from ASes along the AS space. A more interesting observation can be extracted from Figure 5(b) which depicts the contribution of the top x% spamming ASes. The top 10% of the spamming ASes are responsible for 90% of the volume of observed spam. Clearly, this is an
Fig. 6. The distribution of spamming activity across the IP space over the last four years. We present the two highly active spamming areas (left and right boxes) and an emerging high activity area (middle box).
optimistic result, as it suggests that by concentrating in these high activity spamming ASes, we could limit the received volume of spam in our network. Furthermore, we show that the allocation of these ASes follows a generalized Pareto distribution [6] with shape parameter ξ = 0.2812, scale parameter σ = 0.0236 and location parameter µ = 0. As in V-A, we validate our estimation by applying the KolmogorovSmirnov test [22]. Observation 3: 10% of the spam-active ASes in our dataset is responsible for 90% of the total volume of spam we receive. Further, the allocation of top spamming ASes follows a generalized Pareto distribution. VI. T EMPORAL P ROPERTIES OF S PAMMING In this section, we study spamming IPs over the span of four years (2006 - 2009), using a subset of the Spam Archive which consists of 2,553, 403 different spam emails. Specifically, we conduct a data analysis that unveils a worrisome phenomenon: spamming IPs seem to have spread widely across the IP space. This observation is justified by two facts: • We identify a new IP-space area with very high spamming activity, in the range between 113.* and 126.*, which first appears in 2007. • We observe that the appearance of spamming IPs becomes more thinly spread. In Figure 6, we present the CDF of the spamming IP addresses in Spam Archive for the four years we are examining. For 2006, there are three high activity spamming ranges of IPs (presented in Table II, spaces A and C), which constitute 22.6% of the total IP address space, and are also the origin of 92% of the total amount of spam that we receive. In comparison to these findings, the corresponding 2007 highactivity areas (presented in the second row of Table II) cover 29.3% of the total IP space, and are responsible for 95% of the total volume of received spam. In addition, the highactivity ranges of 2006, are only a subset of the respective spamming ranges of 2007, an observation that shows a spread of spammers over the IP space. In 2008, we identify three high activity areas (third row in Table II). These are the cause of 91.5% of the total volume of spam, and constitute 32.4% of the total IP address space. A similar argument can be made for the high-activity spamming IPs of 2009 (fourth row in Table II). These chunks are responsible for 93.4% of the total amount of spam, while they cover 34.4% of the IP space.
1
Percentage of Spamming IPs
Cummulative Distribution Function
1 0.95 0.9 0.85 0.8 0.75 0.7 0.65 0.6
0.98 0.96 0.94 0.92 0.9 0.88 0.86 0.84
0.55 0.82 50
0.5 0 10
1
10
100
150
200
250
Number of Active Days
2
10
Number of Messages Per IP
(a)
(b)
Fig. 7. (a) CDF of IP appearances (b)CDF of spam-active days in UCR-spam dataset
Observation 4: We observe a spreading trend of the spamming IP addresses in the IP space from 2006 to 2009. Next, we study the intensity of spamming activity per IP address. We measure the number of spam messages that a random spamming IP sends during this period in UCR-spam dataset. We present the CDF of the number of outgoing messages of a single IP in Figure 7(a). Year 2006 2007 2008 2009
space A 58.* - 73.* 80.* - 90.* 57.* - 92.* 57.* - 95.* 57.* - 97.*
Space B (new) -
Space C 190.*- 222.*
121.* - 126.* 116.* - 126.* 113.* - 126.*
188.* - 222.* 188.* - 222.* 188.* - 222.*
TABLE II H IGH ACTIVITY SPAMMING
SETS OF
IPS
We observe that 49% of the IPs spams our network more than twice, where there are IPs that spam our network up to 22000 times (not presented in the figure). This an interesting and optimistic result, since it indicates that IP filtering based on the local history of a single network could be beneficial. However, a collaborative approach between multiple networks definitely can provide more benefits [18], [19]. Observation 5: 49% of the IPs in the UCR-spam dataset send more than two messages in our network. Finally, we compute the active life time of the spamming IPs in our dataset. In Figure 7(b), we present the cumulative distribution of active life-time for all the spamming IPs in UCR-spam dataset. As we can see, the majority (82%) has a life time of one day. The reason is that usually, after one really active day such IPs are getting blacklisted. Observation 6: 82% of the IPs in our dataset remain active for less than one day. VII. D ISCUSSION In this work, we have studied the network-level characteristics of spamming. We have analyzed more than 3 million spam messages gathered within the last four years, from two different sources (Spam Archive and the UCR-spam dataset). Our findings can be summarized in the following observations: We find that harvesting of email user accounts is still a method that spammers use to create their lists. Then, we observe that spamming both IP and AS distributions across the IP/AS space are highly skewed, which indicates that filtering could be effective at the network level. We further observe that 49% of the spamming IPs spam our network at least twice, and that
since 2006, there is a spreading trend of spamming IPs across the IP space. These observations rise questions regarding the mitigation of spam that need to be further discussed. For example, is it possible to improve the network level filtering of spam messages? According to our findings, since specific IPs seem to spam repeatedly (discussed in 6) this seems to be possible. An other issue is the cost-effectiveness of anti-spam solutions at the enterprise level. For example, UCR spends tens of thousands per year to get multilevel anti-spam protections and still doesn’t achieve complete elimination of the problem. What about smaller business? These questions need to be further studied to get spamming filtering mechanisms to the next level. R EFERENCES [1] Spam Archive. http://untroubled.org/spam/. [2] Zesheng Chen, Chuanyi Ji, and Paul Barford. Spatial-temporal characteristics of internet malicious sources. IEEE INFOCOM, 2008. [3] Richard Clayton. How much did shutting down mccolo help? CEAS, 2009. [4] Steve DiBenedetto, San Massey, Christos Papadopoulos, and Patrick J. Walsh. Analyzing the aftermatch of the mccolo shutdown. IEEE SAINT FIST, 2009. [5] Distributed Intrusion Detection System (DShield). http://www.dshield.org/. [6] Pareto Dstribution. http://en.wikipedia.org/wiki/pareto distribution. [7] Joshua Goodman. Ip addresses in email clients. CEAS, 2004. [8] SpamAssassin Homepage. http://spamassassin.apache.org/. [9] Husain Husna, Santi Phithakkitnukoon, Srikanth Palla, and Ram Dantu. Behavior analysis of spam botnets. ICST COMSWARE, 2008. [10] John P. John, Alexander Moshchuk, Steven D. Gribble, and Arvind Krishnamurthy. Studying spamming botnets using botlab. USENIX NSDI, 2009. [11] Jaeyeon Jung and Emil Sit. An empirical study of spam traffic and the use of dns black lists. ACM USENIX IMC, 2004. [12] Fulu Li and Mo-Han Hsieh. An empirical study of clustering behavior of spammers and group-based anti-spam strategies. CEAS, 2006. [13] McColo. http://en.wikipedia.org/wiki/mccolo. [14] Pareto Principle. http://en.wikipedia.org/wiki/pareto principle. [15] Simple Mail Transfer Protocol. http://www.ietf.org/rfc/rfc2821.txt. RFC 2821. [16] Anirudh Ramachandran, David Dagon, and Nick Feamster. Can dnsbased blacklists keep up with bots? CEAS, 2006. [17] Anirudh Ramachandran and Nick Feamster. Understanding the networklevel behavior of spammers. ACM SIGCOMM, 2006. [18] Anirudh Ramachandran, Nick Feamster, and Santosh Vempala. Filtering spam with behavioral blacklisting. ACM CCS, 2007. [19] Fabio Soldo, Athina Markopoulou, and Katerina Argyraki. Optimal filtering of malicious ip sources. IEEE INFOCOM, 2008. [20] Spamhaus. http://www.spamhaus.org/. [21] Cymru Team. http://www.team-cymru.org/services/bogons/. [22] Kolmogorov-Smirnov Test. http://en.wikipedia.org/wiki/kolmogorovsmirnov test. [23] Mengjun Xie, Heng Yin, and Haining Wang. An effective defense against email spam laundering. ACM CCS, 2006. [24] Yinglian Xie, Fang Yu, and Martin Abadi. De-anonymizing the internet using unreliable ids. ACM SIGCOMM, 2009. [25] Yinglian Xie, Fang Yu, Kannan Achan, Eliot Gillum, Moises Goldszmidt, and Ted Wobber. How dynamic are ip addresses? ACM SIGCOMM Comput. Commun. Rev., 2007. [26] Yinglian Xie, Fang Yu, Kannan Achan, Rina Panigrahy, Geoff Hulten, and Ivan Osipkov. Spamming botnets: Signatures and characteristics. ACM SIGCOMM, 2008. [27] Jian Zhang, Philip Porras, and Kohannes Ullrich. Highly predictive blacklisting. USENIX Security, 2008. [28] Yao Zhao, Yinglian Xie, Fang Yu, Qife Ke, Yuan Yu, Yan Chen, and Eliot Gillum. Botgraph: Large scale spamming botnet detection. USENIX NSDI, 2009. [29] Li Zhuang, John Dunagan, Daniel R. Simon, and Helen J. Wang. Characterizing botnets from email spam records. USENIX LEET, 2008.