Review pubs.acs.org/JAFC
Terms of Use
Natural Variation in Grain Composition of Wheat and Related Cereals Peter R. Shewry,*,†,‡ Malcolm J. Hawkesford,† Vieno Piironen,§ Ann-Maija Lampi,§ Kurt Gebruers,# Danuta Boros,⊥ Annica A. M. Andersson,⊗ Per Åman,⊗ Mariann Rakszegi,△ Zoltan Bedo,△ and Jane L. Ward† †
Department of Plant Biology and Crop Science, Rothamsted Research, Harpenden, Hertfordshire AL5 2JQ, United Kingdom School of Agriculture, Policy and Development, University of Reading, Whiteknights Road, P.O. Box 237, Reading RG6 6AR, United Kingdom § Department of Food and Environmental Sciences, P.O. Box 27, Latokartanonkaari 11, University of Helsinki, FIN-00014 Helsinki, Finland # Laboratory of Food Chemistry and Biochemistry and Leuven Food Science and Nutrition Research Centre (LFoRCe), Katholieke Universiteit Leuven, Kasteelpark, Arenberg 20, Box 2463, 3001 Leuven, Belgium ⊥ Laboratory of Quality Evaluation of Plant Materials, Institute of Plant Breeding and Acclimatization, PL-057870 Radzikow, Poland ⊗ Department of Food Science, Swedish University of Agricultural Sciences, P.O. Box 7051, SE-750 07 Uppsala, Sweden △ Agricultural Research Institute of the Hungarian Academy of Sciences, P.O. Box 19, 2462 Martonvásár, Hungary ‡
ABSTRACT: The wheat grain comprises three groups of major components, starch, protein, and cell wall polysaccharides (dietary fiber), and a range of minor components that may confer benefits to human health. Detailed analyses of dietary fiber and other bioactive components were carried out under the EU FP6 HEALTHGRAIN program on 150 bread wheat lines grown on a single site, 50 lines of other wheat species and other cereals grown on the same site, and 23−26 bread wheat lines grown in six environments. Principal component analysis allowed the 150 bread wheat lines to be classified on the basis of differences in their contents of bioactive components and wheat species (bread, durum, spelt, emmer, and einkorn wheats) to be clearly separated from related cereals (barley, rye, and oats). Such multivariate analyses could be used to define substantial equivalence when novel (including transgenic) cereals are considered. KEYWORDS: wheat, grain, phytochemicals, dietary fiber, heritability, substantial equivalence
■
INTRODUCTION Three cereal crops, wheat, maize (corn), and rice, dominate world agricultural production with combined annual yields of over 2000 million tonnes (http://faostat.fao.org/). Although the production of wheat is currently the lowest of the three cereals (672 million tonnes in 2010), it has the widest distribution, throughout the temperate zone from Scandinavia to Argentina, and at higher elevations in the tropics. The major species grown is hexaploid bread wheat, which has evolved only recently (about 10000 years), probably by spontaneous hybridization between cultivated tetraploid wheat (emmer) and a related diploid grass in southeastern Turkey.1 However, although recent domestication is usually associated with reduced genetic diversity due to domestication bottlenecks, cultivated hexaploid wheat is immensely diverse, with over 25000 varieties adapted to different environments.2 This wide diversity results from a high level of genome plasticity, with frequent gene rearrangements being buffered by the polyploidy nature of wheat.1 This diversity, combined with its economic importance, means that wheat is an excellent system to explore the range of natural genetic variation within a major crop species. The mature wheat grain comprises three groups of major components, starch, proteins, and cell wall polysaccharides, which together account for about 90% of the dry weight, and minor components that include lipids, terpenoids, phenolics, © 2013 American Chemical Society
minerals, and vitamins. However, these components differ in their distribution within the grain. In particular, the starchy endosperm, which is recovered as white flour on milling, contains about 80% starch and 10% protein with low contents of cell wall components, minerals, and phytochemicals, whereas the pure bran, which comprises the aleurone layer, the outer layers of the grain, and the embryo, lacks starch and is enriched in minor components with nutritional and health benefits. The present paper reviews the extent of variation in grain composition among lines of bread wheat, in relation to other wheat species and related temperate small grain cereals (barley, oats, and rye), including data on whole grain, white flour, and bran, drawing particularly on data generated in the EU FP6 HEALTHGRAIN program.3 This study included detailed analyses of 150 bread wheat lines and 50 lines of other cereal species (durum wheat, spelt, Triticum monococcum, Triticum dicoccum, rye, oats, and barley) grown on a single site (the HEALTHGRAIN diversity screen)4 and of a smaller set of 26 wheat and 5 rye lines grown in six environments (the Special Issue: Safety of GM Crops: Compositional Analysis Received: Revised: Accepted: Published: 8295
December 18, 2012 February 11, 2013 February 15, 2013 February 15, 2013 dx.doi.org/10.1021/jf3054092 | J. Agric. Food Chem. 2013, 61, 8295−8303
Journal of Agricultural and Food Chemistry
Review
HEALTHGRAIN G × E study).5,6 In addition, multivariate analysis of a subset of the samples (winter wheats) has been reported, with a focus on the content and composition of dietary fiber including fructo-oligosaccharides and fructans.7 The present paper provides an overview of the results of the HEALTHGRAIN diversity screen and G × E study, based mainly on previously reported analyses4−9 but including some new data and novel multivariate analyses of the data sets. Details of the analytical procedures are reported in the original publications and not included here. It should also be noted that milled whole grains were used for all analyses except dietary fiber components, most of which were determined on white flour and bran fractions. Wholemeal and bran both comprise mixtures of tissues that differ significantly in composition. However, the three fractions analyzed (wholemeal, bran, and white flour) represent the three major wheat fractions used for food processing.
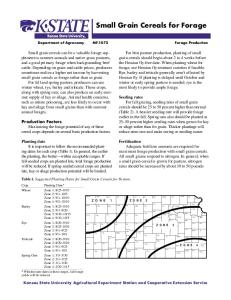
genotype, with farmers optimizing their application of fertilizer for yield and grain protein content. For example, plots on the Broadbalk long-term wheat experiment at Rothamsted Research yielded grain with a mean of 7.8% protein when 48 kg N/ha was applied and 14.1% protein with 288 kg N/ha, over the period 2005−2007.17 A more detailed comparison is shown in Figure 1, which compares the yields and protein contents of
■
MAJOR COMPONENTS: STARCH AND PROTEIN IN WHEAT Starch is the major storage component in the starchy endosperm of the wheat grain, and increases in starch content are largely responsible for the increases in grain size achieved by breeding to produce high-yielding wheat varieties. Starch generally accounts for about 80% of the dry weight of the starchy endosperm and comprises a mixture of two polymers, amylose and amylopectin, in a ratio of about 1:3. Although natural mutations that lead to higher proportions of amylopectin (waxy starches) or amylose (resistant starches) have been detected in genes, these mutations have limited impact on starch composition in hexaploid bread wheat unless they are present on all three genomes.10,11 Such triple mutants are unlikely to occur naturally but have been produced by combining single mutant lines in breeding programs. For example, Slade et al.12 have reported the production of bread wheat with 57% amylose by combining induced and natural mutations in the starch branching enzyme IIa (SBEIIa) gene. The protein content of wheat varies more widely than the starch content. Selection during plant breeding has resulted in differences in protein content of about 2% dry weight when modern breadmaking and feed wheats bred in the United Kingdom are grown under the same conditions.13,14 However, greater variation in protein content has been reported in wider germplasm screens, with the comparison of 212,600 lines in the World Wheat Collection showing a range from about 7 to 22% protein on a dry weight basis.15 It is of interest that the authors ascribed about a third of this variation to genotype. Similarly, comparison of 150 wheat lines grown under the same agronomic conditions in the HEALTHGRAIN diversity screen showed variation in grain protein content from 12.9 to 19.9% in wholemeal and from 10.3 to 19.0% in white flour.16 Differences in the functional properties of the grain proteins were reported for the same material, with the content of wet gluten ranging from 24.3 to 61.2% and the Zeleny sedimentation (an estimate of loaf volume) from 13.5 to 50.0 mL. However, because starch is the overwhelmingly dominant grain component, lines with lower starch contents, which will include unimproved landraces and lines grown outside their area of adaptation, will have higher grain protein contents. Hence, it is important to consider protein content on a per grain basis as well as on a dry weight basis. The availability of nitrogen, usually through application as fertilizer, has a greater effect on grain protein content than
Figure 1. Relationship between grain nitrogen and yield in six elite U.K. wheat cultivars grown in three replicate field plots over three years and at three levels of nitrogen fertilization: (A) colored by variety; (B) colored by N level; (C) colored by year.
six elite U.K. wheat varieties (comprising five varieties bred for breadmaking and one (Istabraq) for feed) grown within their area of adaptation (the experimental farm at Rothamsted Research, UK) over 3 years at three levels of nitrogen fertilization. This shows the well-established inverse correlation between yield and protein content. With the exception of Istabraq, which generally has lower grain nitrogen (protein), there is no clear effect of variety (Figure 1A), but a strong effect of nitrogen fertilization, with the samples grown at 100, 200, 8296
dx.doi.org/10.1021/jf3054092 | J. Agric. Food Chem. 2013, 61, 8295−8303
Journal of Agricultural and Food Chemistry
Review
(cotyledon) and embryonic axis contained about 12 and 25% of neutral carbohydrate, respectively, with arabinose and xylose (presumably derived from AX) accounting for about 65% of the total. AX comprises a backbone of β-D-xylopyranosyl residues linked through (1→4) glycosidic linkages with some residues being substituted with α-L-arabinofuranosyl residues at either position 3 or positions 2 and 3. Furthermore, some arabinofuranosyl residues at position 3 may themselves be substituted with ferulic acid (or in the aleurone p-coumaric acid) at the 5-position. Differences in the extent of these modifications, which may be crudely expressed as the ratio of A:X and content of bound phenolic acids (PAs), affect the properties of AX, including their solubility, with total AX (TOT-AX) often being divided into two fractions, which are extractable (WE-AX) or unextractable (WU-AX) with water. Analyses of AX in white flour and bran fractions of the 150 lines in the HEALTHGRAIN diversity screen are summarized in Table 1, together with analyses of total dietary fiber (TDF)
and 350 kg N/ha falling on parallel regression lines (Figure 1B). There is also an effect of year on yield (being higher in 2009), but this is less clear than for nitrogen content (Figure 1C). The gluten storage proteins account for over half of the total protein content of wheat grain, with the proportion increasing with total protein content.18 Gluten comprises a mixture of many individual proteins, with two-dimensional gel separations usually resolving between about 30 and 50 individual components. There is also polymorphism in the patterns of gluten protein subunits among wheat genotypes: in the number of components, their proportions, and their properties, including their molecular mass, charge (particularly at low pH), and isoelectric point. This allows differences in protein patterns between genotypes to be identified by one- and twodimensional electrophoresis and their exploitation as markers, for varietal identification and purity in grain trading and for quality traits in breeding programs. The polymorphism and genetic variation in gluten protein subunits have been reviewed extensively.19,20
■
Table 1. Variation and Heritability in DF Components in Wheat Samples from the HEALTHGRAIN Study
CELL WALL POLYSACCHARIDES IN WHEAT Wheat is a major source of dietary fiber (DF) in the human diet, which mainly comprises nonstarch polysaccharides (NSP) derived from the cell walls. The HEALTHGRAIN G × E study showed that NSP accounted for between 7.7 and 11.4% of the grain dry weight, with the total content of DF, including Klason lignin (but not fructan), ranging from 9.6 to 14.4%.21 However, there are large differences between the NSP contents of white flour and bran. Total DF content, including fructo-oligosaccharides and fructan, was analyzed in the winter wheat samples in an earlier study, with an average content of 13.4% and a range between 11.5 and 15.5%.7 According to a new international definition for dietary fiber, nondigestible oligosaccharides such as fructo-oligosaccharides and fructan can be included (Codex CAC/GL 2-1985, revised 2010).22 A similar definition has also been approved by the European Commission under Commission directive 2008/100/EC. In this definition all carbohydrates with a degree of polymerization (DP) ≥3 should be included in the dietary fiber content, of which fructo-oligosaccharides are the most common in cereals. The major NSP components in white flour are cell wall polysaccharides. These account for between 2 and 3% of the dry weight, with the major components being arabinoxylan (AX) (about 70%) and (1→3,1→4)-β-D-glucan (β-glucan) (about 20%), with small amounts of cellulose ((1→4)-β-Dglucan) (about 2%) and glucomannan (about 7%).23 The bran fraction from milling comprises a mixture of tissues, which differ in their contents and compositions of cell wall components. The outer layer of endosperm cells, the aleurone, has thick cell walls (which account for about 35−40% of the dry weight24) having a composition similar to that of the starchy endosperm cells walls, with 29% β-glucan, 65% arabinoxylan, and only 2% each of cellulose and glucomannan.25 The grain is surrounded by a number of layers of tissues that are often collectively called “outer layers”. These comprise about 45−50% cell wall material24 with the pericarp, which is the major tissue, being more similar in cell wall composition to wheat straw than to other seed tissues (with about 30% cellulose, 60% arabinoxylan, and 12% lignin (reviewed in ref 26). Little is known about the content and composition of cell wall polysaccharides in the wheat embryo (germ), but a recent study24 showed that the scutellum
DF component dry matter basis
mean value in diversity screen (150 lines)
fold variation in diversity screen (150 lines)a
heritability (%) in G × E study (26 lines)b
TDF wholemeal % β-glucan wholemeal % bound PA wholemeal μg/g WE-AX flour % WE-AX flour A:X ratio WE-AX bran % WE-AX bran A:X ratio
15.1 0.72 485 0.51 0.48 0.42 1.01
1.6 1.93 4.22 4.79 1.46 2.89 2.30
ndc 51 26 60 nd 48 nd
1.93 0.58 17.79 0.62
2.01 1.43 1.75 1.34
72 nd 39 nd
TOT-AX TOT-AX TOT-AX TOT-AX
flour % flour A:X ratio bran % bran A:X ratio
a
Fold variation is defined as the highest/lowest values determined for individual lines. bHeritability is defined as the ratio of genetic variance to total variance, calculated as described previously.5 cnd, not determined.
and β-glucan in wholemeal. This shows that the content of WEAX varied particularly widely, by 4.79-fold in flour and by 2.89fold in bran. However, data from the G × E study showed that the variation in AX amount and composition was highly heritable, particularly AX in white flour (Table 1). The composition and properties of the cell wall polysaccharides can be modified by the action of enzymes, in particular by endoxylanases synthesized as a result of preharvest sprouting. Analysis of the HEALTHGRAIN G × E lines showed that the contents of WE-AX in bran and flour were negatively correlated with the precipitation during the period between heading and harvest, which was probably due to high xylanase activities in the lines grown in Hungary in 2006 and in the United Kingdom in 2007.27 However, only low activity of xylanase was detected in the 150 lines of the HEATHGRAIN diversity screen grown in Hungary in 200527 (authors’ unpublished analyses). Analyses of wholemeals of 129 winter lines from the HEALTHGRAIN diversity screen showed variation in fructan content from 0.84 to 1.85% (mean 1.28%) dry wt.7 A previous 8297
dx.doi.org/10.1021/jf3054092 | J. Agric. Food Chem. 2013, 61, 8295−8303
Journal of Agricultural and Food Chemistry
Review
Table 2. Variation and Heritability in Bioactive Components in Wholegrain Fractions of Wheat Samples in the HEALTHGRAIN Studya mean content (μg/g dm) in HEALTHGRAIN diversity screen (150 lines)
fold variation in HEALTHGRAIN diversity screen (150 lines)
heritability (%) in HEALTHGRAIN G × E study (26 lines)
49.81 843.8
2.96 1.39
76 57
657.42 10.73 162.04 484.65 431.54
3.60 9.75 3.91 4.22 2.81
28 6 10 26 63
1596 221 3.10
3.04 1.56 16.13
36 25 59
0.56 mean content (μg/g dm) in HEALTHGRAIN G × E study (26 lines)
2.38 fold variation in HEALTHGRAIN G × E study (26 lines)
24 heritability (%) in HEALTHGRAIN G × E study (26 lines)
8.44 0.96 0.86 1.89
2.47 1.82 11.2 2.35
31 16 7 12
terpenoids tocols sterols phenolics total phenolic acids free phenolic acids conjugated phenolic acids bound phenolic acids alkylresorcinols methyl donors betaine choline trigonelline B vitamins folates (B9)
thiamin (B1) riboflavin (B2) niacin (B3) bioavailable form pyridoxine (B6) a
Details of methods and statistical analyses are given in the source publications.
■
B VITAMINS Wheat is an important dietary source of B vitamins, particularly thiamin (B1), riboflavin (B2), niacin (B3), pyridoxine (B6), and folates (B9). Their contents were therefore determined in the HEALTHGRAIN wholegrain wheat samples, with folates being determined in the diversity screen and G × E study and the other B vitamins in the G × E study only. This should be borne in mind when comparing the fold variations given in Table 2. All showed low heritabilities, with the highest values being for thiamin (31%) and folates (24%).
study of milling fractions from three wheat lines showed that fructans were concentrated in the bran, with the content in white flour being about two-thirds that in wholemeal.28 This indicates that the contents of fructans in white flours of the HEALTHGRAIN lines probably varied between about 0.6 and 1.2% dry wt.
■
BIOACTIVE COMPONENTS: PHENOLICS, TERPENOIDS, AND METHYL DONORS IN WHEAT The major groups of potentially bioactive components in wheat grain are terpenoids (sterols and tocols, the latter including vitamin E) and phenolics, notably phenolic acids, which occur in free, soluble conjugated (to components such as sugars and ferulate), and alkylresorcinol forms. In addition, wheat is a rich source of glycine betaine (which acts as a methyl donor in the homocysteine cycle) with smaller amounts of choline (the precursor of betaine) and trigonelline (a structural analogue of betaine and choline). These are together called “methyl donors” in Table 2 and the text below. Most minor bioactive components in the wheat grain are concentrated in the aleurone, outer layers, and embryo so analyses of wholemeal grain are discussed here. Because of this the contents of some components are inversely correlated with grain size (1000 grain weight) and directly correlated with the bran yield on milling.4 Table 2 summarizes the variation in content and heritability of phenolics, terpenoids, and methyl donors in the HEALTHGRAIN study. The extent of variation in content among the 150 lines of the HEALTHGRAIN diversity screen ranges from 1.39-fold for sterols to between 3.6- and 9.75-fold for phenolic acid fractions, and the heritabilities calculated from the HEALTHGRAIN G ×x E study from between 6 and 28% for phenolic acid fractions (free phenolic acids) to >50% for sterols, tocols, alkylresorcinols, and trigonelline. Even wider variation occurs in the compositions of these fractions, particularly in the contents of individual phenolic acids.29,30,31
■
MULTIVARIATE ANALYSES OF BIOACTIVE COMPONENTS IN WHEAT The HEALTHGRAIN study has provided the most complete data set currently available for the composition of wheat and related cereal species and has been used to explore the relationships between the contents of individual grain components and between the contents of grain components and environmental and other factors.5 However, the database can also be used to identify the most promising genotypes for plant breeding and to define the range of variation within wheat to assess the effects of modifications in composition resulting from transgenesis (i.e., define substantial equivalence). Both of these applications are facilitated by multivariate analysis of the data set. Principal component analysis (PCA) is a common statistical tool used for visualizing groupings of samples and identifying new meaningful underlying variables. The method involves a mathematical procedure that transforms a number of correlated variables into a smaller number of uncorrelated variables called principal components. PCAs of the data sets from 150 wheat lines based on the phytochemicals, DF components, and combined phytochemicals plus DF components are shown in Figure 2, with parts A, C, and E showing the PCA scores plots and parts B, D, and F the corresponding loadings plots. Data 8298
dx.doi.org/10.1021/jf3054092 | J. Agric. Food Chem. 2013, 61, 8295−8303
Journal of Agricultural and Food Chemistry
Review
Figure 2. Principal component analysis of 150 bread wheats: (A, B) scores and loadings plots of PCA model constructed from phytochemical constituents as model variables; (C, D) scores and loadings plots of PCA model constructed from DF constituents as model variables; (E, F) scores and loadings plots of PCA model constructed from combined phytochemical and DF constituents as model variables; (G) contribution plot of the cultivar Yumai 34 compared to the data set average; (H) contribution plot of the cultivar Disponent compared to the data set average.
sets comprised concentrations for individual phytochemical components, and these were scaled to Unit Variance prior to PCA to ensure that appropriate comparisons could be made
between abundant and nonabundant compound classes. PCA scores plots allow the cultivars to be classified or grouped according to their overall compositions, whereas the loading 8299
dx.doi.org/10.1021/jf3054092 | J. Agric. Food Chem. 2013, 61, 8295−8303
a
40.1−62.7 871−1106 536−1086 7−22 184−416 288−832 194−531 637−891 1660−2770 240−310 1.78−9.34 0.25−0.55 0.30−0.55 1.70−2.35 10.9−13.7 0.25−0.45 1.85−2.55
27.6−79.7 670−959 326−1171 3−30 76−297 208−878 241−677 323−774 970−2940 180−280 0.53−8.55 0.30−1.40 0.30−0.85 1.35−2.75 12.7−22.1 0.50−0.95 1.40−3.25
durum wheat, 10 lines
0.30−0.45 0.30−0.35 1.60−2.15 11.1−13.9 0.55−0.70 1.85−2.90
40.2−50.6 893−963 382−726 3−12 93−191 245−595 490−741 505−647 1830−2770 200−220 1.24−3.35
spelt, 5 lines
0.50−0.65 0.45−0.65 1.45−2.35 9.5−10.4 0.25−0.35 2.25−3.05
42.7−70.2 976−1187 449−816 3−18 127−337 245−595 540−654 429−678 2220−2830 210−300 0.31−1.91
T. monococum, 5 lines
0.15−0.55 0.20−0.45 1.40−1.95 6.1−14.4 0.30−0.40 1.95−2.65
29.0−57.5 796−937 508−1161 6−13 103−208 398−964 531−714 516−937 1510−2450 180−240 0.15−7.94
T. dicoccum, 5 lines
All data are on a dry matter basis. Details of methods and statistical analyses are given in the source publications.
phytochemicals tocols (μg/g) sterols (μg/g) total PA (μg/g) free PA (μg/g) conjugated PA (μg/g) bound PA (μg/g) alkylresorcinols (μg/g) folates (ng/g) betaine (μg/g) choline trigonelline dietary fiber WE-AX flour (%) WE-AX bran (%) TOT-AX flour (%) TOT-AX bran (%) β-glucan wholemeal (%) Klason lignin wholemeal (%)
bread wheat, 150 lines
1.05−1.49 1.04−1.47 3.11−4.31 12.06−14.76 1.7−2.0 2.0−2.9
44−67 1098−1420 491−1082 11−29 153−349 216−711 797−1231 574−775 1760−2980 220−290 15.73−50.15
rye, 10 lines
0.15−0.38 0.15−0.35 1.53−2.24 5.81−9.84 3.7−6.5 3.27−4.68
46.2−68.8 899−1153 253−675 4.6−23.0 86.4−197.7 132.9−522.8 32.2−103.1 518−789 710−1360 270−370 0.01−0.83
barley, 10 lines (2 naked, 8 hulled)
Table 3. Range of Concentrations of Bioactive Components in Bread Wheat Compared with Related Cereals in the HEALTHGRAIN Studya
0.15−0.18 0.19−0.21 0.97−1.26 8.02−13.20 4.5−5.6 2.6−5.9
16.1−36.1 618−682 351−874 50−110 111−314 131−640 absent 495−604 290−550 150−180 97.23−123.9
oat, 5 lines (including hulls)
Journal of Agricultural and Food Chemistry Review
8300
dx.doi.org/10.1021/jf3054092 | J. Agric. Food Chem. 2013, 61, 8295−8303
Journal of Agricultural and Food Chemistry
Review
Figure 3. Principal component analysis of 200 cereal genotypes colored by cereal class: (A, B) scores and loadings plots of PCA model constructed from phytochemical constituents as model variables; (C, D) scores and loadings plots of PCA model constructed from DF constituents as model variables; (E, F) scores and loadings plots of PCA model constructed from combined phytochemical and DF constituents as model variables; (G) contribution plot of rye genotypes compared to the data set average; (H) contribution plot of oat genotypes compared to the data set average.
plots highlight the individual components that are responsible for the separation. The loadings plots also allow us to determine which discriminatory components are potentially
correlated with each other. Figure 2A shows the cultivars grouped according to their phytochemical composition. Figure 2B, the corresponding loadings plot, shows that all of the 8301
dx.doi.org/10.1021/jf3054092 | J. Agric. Food Chem. 2013, 61, 8295−8303
Journal of Agricultural and Food Chemistry
Review
and parts B, D, and F the respective loadings plots. The PCA based on phytochemicals (parts A and B) shows some overlap between rye and the wheat species, whereas PCA based on DF components (parts C and D) shows clear separations of the wheat species from the other cereals. The resolution is improved when both phytochemicals and DF components are considered (parts E and F), with the bread wheat lines forming a tight cluster in the center of the plot, which overlaps with the spelt line, which is consistent with spelt being a hulled form of the same species as bread wheat (Triticum aestivum). Lesser overlaps are also observed with the other wheat species, tetraploid durum wheat T. dicoccum and diploid T. monococcum, but the other cereal species, barley, rye, and oats, form separate, distinct clusters that do not overlap with each other or with the wheat cluster. As with the analyses of the wheat lines discussed above, it is also possible to extract contributions plots describing the broad differences between cereal species (Figure 3G,H). Rye lines are typically characterized by higher alkylresorcinol and sterol contents alongside higher levels of WE-AX in the bran and TOT-AX in the flour. On the other hand, oat genotypes have higher concentrations than average of free phenolic acids, trigonelline, and β-glucan. Similar “signature” plots could be constructed for individual cultivars or accessions within these groups and, hence, this type of plot could be used to determine whether the compositions of GM or other novel cultivars fall within or outside the normal range of composition for bread wheat. Multivariate analysis based on grain composition can therefore be used to determine the substantial equivalence of GM and other novel forms of cereals, as discussed above for wheat.
phenolic acid components are distributed in the bottom-right corner of the loadings plot and therefore cultivars that are in the corresponding corner of the scores plot are high in phenolic acids (e.g., Disponent and Campari). Total phenolic acids and bound phenolic acids are located close together, which implies a strong correlation between these two components. Similarly, the contents of sterols, alkylresorcinols, and tocols reside together in the top-right quadrant of the PCA scores plot, implying that these components are also highly correlated. Parts C and D of Figure 2 show which DF components are responsible for the distribution of the cultivars. Lines such as Atay-85, Courtot, and Fundulea-29 are clearly high in β-glucan, whereas Yumai 34 is high in WE-AX and flour TOT-AX. The ratio of arabinose to xylose is not correlated with the levels of WE-AX and TOT-AX, and lines that have a high A:X ratio in flour (in both TOT-AX and WE-AX) are distributed in the bottom-left quadrant of the scores plot (Figure 2C). Combining both sets of data (Figure 2E,F) allows us to determine whether certain phytochemicals or DF components are responsible for the separation of cultivars. In general, the DF components are well separated from the phytochemical components, with the exception of bran WE-AX. Phytochemicals cluster tightly together on the right-hand side of the PCA scores plot and relate to a group of at least 20 cultivars having higher levels of a number of different phytochemical components while showing no appreciable difference in their DF content or concentration. These cultivars include Disponent, Campari, Cadenza, Riband, and Lynx. Contrastingly, cultivars also separate by virtue of their different DF compositions and concentrations. A high score in PC2 places cultivars with a high flour AX content at the very top of the PCA scores plot. Yumai 34 exemplifies this, whereas cultivars such as Soissons and Alba appearing at the bottom of the PCA scores plot have lower AX levels but, interestingly, show higher A/X ratios in both total AX and WE-AX. It is also possible to extract “contribution plots” for the individual cultivars, which identify their characteristic compositional features. For example, parts G and H of Figure 2 show contributions plots (compared to the average of the data set) for the bread wheat cultivars Yumai 34 and Disponent, showing that the former is characterized by high flour AX (as noted in refs 4 and 32), whereas the latter is characterized by high phenolics (phenolic acids and alkylresorcinols). It will not be feasible to carry out such detailed analyses of such a large number of cultivars in future studies of substantial equivalence33 of GM and non-GM crops. However, it will be possible to select a smaller “core collection” of cultivars that represent the full range of diversity in the collection and a limited number of components as indicators of diversity.
■
AUTHOR INFORMATION
Corresponding Author
*Phone: +44 (0)1582 763133. Fax: +44 (0)1582 763010. Email:
[email protected]. Funding
Rothamsted Research receives strategic funding from the Biotechnological and Biological Sciences Research Council (BBSRC). The work at Rothamsted was part-funded by DEFRA (Department for the Environment, Food and Rural Affairs: www.defra.gov.uk) as part of WGIN (Wheat Genetic Improvement Network) project and by BBSRC Grant BB/ GO22437/1 “Improving the N response of UK wheat varieties”. This study was financially supported by the European Commission in the Communities Sixth Framework Programme, Project HEALTHGRAIN (FP6-514008). This publication reflects only the authors’ views, and the Community is not liable for any use that may be made of the information contained in this publication.
■
COMPARISON OF WHEAT WITH RELATED SMALL GRAIN CEREALS Table 3 summarizes the variation in bioactive components in bread wheats compared with other wheat species and related small grain cereals. Although only small numbers of accessions of the latter were analyzed (5 or 10 per species), it is nevertheless possible to use multivariate analysis to identify the extent to which the compositions of the species overlap and to identify components or groups of components that are characteristic for the individual species. Figure 3 therefore shows such analyses, with parts A, C, and E showing the PCA scores plots for phytochemicals, DF components, and combined phytochemicals plus DF components, respectively,
Notes
The authors declare no competing financial interest.
■
ABBREVIATIONS USED AX, arabinoxylan; AXOS, arabinoxylan oligosaccharide; DF, dietary fiber; ESI-MS, electrospray ionization mass spectroscopy; FT-IR, Fourier-transform infrared; NMR, nuclear magnetic resonance; NSP, nonstarch polysaccharides; PAs, phenolic acids; TDF, total dietary fiber; TOT-AX, total AX; WE-AX, water-extractable AX; WU-AX, water-unextractable AX 8302
dx.doi.org/10.1021/jf3054092 | J. Agric. Food Chem. 2013, 61, 8295−8303
Journal of Agricultural and Food Chemistry
■
Review
HEALTHGRAIN diversity screen. J. Agric. Food Chem. 2008, 56, 9750−9757. (17) Godfrey, D.; Hawkesford, M.; Powers, S.; Millar, S.; Shewry, P. R. Nutritional effects on wheat grain composition and end use quality. J. Agric. Food Chem. 2010, 58, 3012−3021. (18) Shewry, P. R. Effects of nitrogen and sulfur nutrition on grain composition and properties of wheat and related cereals. In The Molecular and Physiological Basis of Nutrient Use Efficiency in Crops; Hawkesford, M. J., Barraclough, P., Eds.; Wiley-Blackwell: Chichester, UK, 2011; pp 103−120. (19) Shewry, P. R.; Halford, N. G.; Lafiandra, D. The genetics of wheat gluten proteins. In Advances in Genetics; Hall, J. C., Dunlap, J. C., Friedman, T., Eds.; Academic Press: San Diego, CA, 2003; Vol. 49, pp 111−184. (20) Shewry, P. R.; D’Ovidio, R.; Lafiandra, D.; Jenkins, J. A.; Mills, E. N. C.; Békés, F. Wheat grain proteins. In Wheat: Chemistry and Technology, 4th ed.; Khan, K., Shewry, P. R., Eds.; AACC: St. Paul, MN, 2009; pp 223−298. (21) Gebruers, K.; Dornez, E.; Bedo, Z.; Rakszegi, M.; Fras, A.; Boros, D.; Courtin, C. M.; Delcour, J. A. Environment and genotype effects on the content of dietary fiber and its components in wheat in the HEALTHGRAIN diversity screen. J. Agric. Food Chem. 2010, 58, 9353−9361. (22) Philips, G. O.; Cui, S. W. An introduction: evolution and finalisation of the regulatory definition of dietary fibre. Food Hydrocolloids 2011, 25, 139−143. (23) Mares, D. J.; Stone, B. A. Studies on wheat endosperm. I. Chemical composition and ultrastructure of the cell walls. Aust. J. Biol. Sci. 1973, 26, 793−812. (24) Barron, C.; Surget, A.; Rouau, X. Relative amounts of tissues in mature wheat (Triticum aestivum L.) grain and their carbohydrate and phenolic acid composition. J. Cereal Sci. 2007, 45, 88−96. (25) Bacic, A.; Stone, B. A. Chemistry and organisation of aleurone cell wall components from wheat and barley. Aust. J. Plant Physiol. 1981, 8, 475−495. (26) Stone, B.; Morell, M. K. Carbohydrates. In Wheat: Chemistry and Technology, 4th ed.; Khan, K., Shewry, P. R., Eds.; AACC: St. Paul, MN, 2009; pp 299−362. (27) Gebruers, K.; Dornez, E.; Bedo, Z.; Rakszegi, M.; Courtin, C. M.; Delcour, J. A. Variability in xylanase and xylanase inhibition activities in different cereals in the HEALTHGRAIN diversity screen and contribution of environment and genotype to this variability in common wheat. J. Agric. Food Chem. 2010, 58, 9362−9371. (28) Haskå, L.; Nyman, M.; Andersson, R. Distribution and characterisation of 425 fructan in wheat milling fractions. J. Cereal Sci. 2008, 48, 768−774. (29) Li, L.; Shewry, P. R.; Ward, J. Phenolic acids in wheat varieties in the HEALTHGRAIN diversity screen. J. Agric. Food Chem. 2008, 56, 9732−9739. (30) Fernandez-Orozco, R.; Li, L.; Harflett, C.; Shewry, P. R.; Ward, J. L. Effects of environment and genotype on phenolic acids in wheat in the HEALTHGRAIN diversity screen. J. Agric. Food Chem. 2010, 58, 9341−9352. (31) Gebruers, K.; Dornez, E.; Boros, D.; Frás, A.; Dynkowska, W.; Bedo, Z.; Rakszegi, M.; Delcour, J. A.; Courtin, C. M. Variation in the content of dietary fiber and components thereof in wheats in the HEALTHGRAIN diversity screen. J. Agric. Food Chem. 2008, 56, 9740−9749. (32) OECD. Safety Evaluation of Foods Derived by Modern Biotechnology; OECD: Paris, France, 1993. (33) Millstone, E.; Brunner, E.; Mayer, S. Beyond “substantial equivalence”. Nature 1999, 401, 525−526.
REFERENCES
(1) Dubcovsky, J.; Dvorak, J. Genome plasticity a key factor in the success of polyploid wheat under domestication. Science 2007, 314, 1862−1866. (2) Feldman, M. Wheats. In Evolution of Crop Plants; Smartt, J., Simmonds, N. W., Eds.; Longman Scientific and Technical: Harlow, UK, 1995; pp 185−192. (3) Poutanen, K.; Shepherd, R.; Shewry, P. R.; Delcour, J. A.; Björck, I.; van der Kamp, J.-W. Beyond whole grain: the European HEALTHGRAIN project aims at healthier cereal foods. Cereal Foods World 2008, 53, 32−35. (4) Ward, J. L.; Poutanen, K.; Gebruers, K.; Pironen, V.; Lampi, A. M.; Nyström, L.; Andersson, A. A. M.; Åman, P.; Boros, D.; Rakszegi, M.; Bedő , Z.; Shewry, P. R. The HEALTHGRAIN cereal diversity screen: concept, results, and prospects. J. Agric. Food Chem. 2008, 56, 9699−9709. (5) Shewry, P. R.; Piironen, V.; Lampi, A.-M.; Edelmann, M.; Kariluoto, S.; Nurmi, T.; Fernandez-Orozco, R.; Ravel, C.; Charmet, G.; Andersson, A. A. M.; Åman, P.; Boros, D.; Gebruers, K.; Dornez, E.; Courtin, C. M.; Delcour, J. A.; Rakszegi, M.; Bedo, Z.; Ward, J. L. The HEALTHGRAIN wheat diversity screen: effects of genotype and environment on phytochemicals and dietary fiber components. J. Agric. Food Chem. 2010, 58, 9291−9298. (6) Shewry, P. R.; Piironen, V.; Lampi, A.-M.; Edelmann, M.; Kariluoto, S.; Nurmi, T.; Fernandez-Orozco, R.; Andersson, A. A. M.; Åman, P.; Fraś, A.; Boros, D.; Gebruers, K.; Dornez, E.; Courtin, C. M.; Delcour, J. A.; Ravel, C.; Charmet, G.; Rakszegi, M.; Bedo, Z.; Ward, J. L. Effects of genotype and environment on the content and composition of phytochemicals and dietary fibre components in rye in the HEALTHGRAIN Diversity Screen. J. Agric. Food Chem. 2010, 58, 9372−9383. (7) Andersson, A. A. M.; Andersson, R.; Piironen, V.; Lampi, A.-M.; Nyström. L.; Boros, D.; Fraś, A.; Gebruers, K.; Courtin, C. M.; Delcour, J.; Rakszegi, M.; Bedo, Z.; Ward, J. L.; Shewry, P. R.; Åman, P. Contents of dietary fibre components and their relation to associated bioactive components in whole grain wheat samples from the HEALTHGRAIN diversity screen. Food Chem. 2013, 136, 1243− 1248 (8) Shewry, P. R.; Van Schaik, F.; Ravel, C.; Charmet, G.; Rakszegi, M.; Bedo, Z.; Ward, J. L. Genotype and environment effects on the contents of vitamins B1, B2, B3, and B6 in wheat grain. J. Agric. Food Chem. 2011, 59, 10564−10571. (9) Corol, D. I.; Ravel, C.; Raksegi, M.; Bedo, Z.; Charmet, G.; Beale, M. H.; Shewry, P. R.; Ward, J. L. Effects of genotype and environment on the contents of betaine, choline, and trigonelline in cereal grains. J. Agric. Food Chem. 2012, 60, 5471−5481. (10) Rahman, S.; Bird, A.; Regina, A.; Li, Z.; Ral, J. P.; McMaugh, S.; Topping, D.; Morell, M. Resistant starch in cereals: exploiting genetic engineering and genetic variation. J. Cereal Sci. 2007, 46, 251−260. (11) Graybosch, R. A. Waxy wheats: origin, properties, and prospects. Trends Food Sci. Technol. 1998, 9, 135−42. (12) Slade, A. J.; McGuire, C.; Loeffler, D.; Mullenberg, J.; Skinner, W.; Fazio, G.; Holm, A.; Brandt, K. M.; Steine, M. N.; Goodstal, J. F.; Kanuf, V. C. Development of high amylose wheat through tilling. BMC Plant Biol. 2012, 12. (13) Snape, J. W.; Hyne, V.; Aitken, K. Targeting genes in wheat using marker mediated approaches. In Proceedings of the 8th International Wheat Genetics Symposium, Beijing, China, 1993; pp 749−759. (14) Monaghan, J. M.; Snape, J. W.; Chojecki, J. S.; Kettlewell, P. S. The use of grain protein deviation for identifying wheat cultivars with high grain protein concentration and yield. Euphytica 2001, 122, 309− 317. (15) Vogel, K. P.; Johnson, V. A.; Mattern, P. J. Protein and lysine content of grain, endosperm, and bran of wheats from USDA World Wheat collection. Crop Sci. 1976, 16, 655−660. (16) Rakszegi, M.; Boros, D.; Kuti, C.; Lang, L.; Bedo, Z.; Shewry, P. R. Composition and end-use quality of 150 wheat lines selected for the 8303
dx.doi.org/10.1021/jf3054092 | J. Agric. Food Chem. 2013, 61, 8295−8303