Snam Rete Gas Annual Report 2010 / Natural gas transportation
Natural gas transportation
17
Snam Rete Gas Annual Report 2010 / Natural gas transportation
The natural gas transportation service Natural gas transportation is an integrated service which involves providing transportation capacity and the actual transportation of the gas delivered to Snam Rete Gas S.p.A. to the entry points of the Italian gas transportation network 2 up to the redelivery points of the regional network, where the gas is redelivered to the users of the service (the Users). The transport capacity which is expressed in standard cubic meters per day represents the maximum volume of gas that each User can inject or withdraw from the system at the aforementioned points each day. Snam Rete Gas S.p.A. provides transportation capacity to the entities that request it and they acquire the right (as Users) to inject and withdraw on any day of the thermal year to and from the entry and exit points of the National Network, the redelivery points along Snam Rete Gas S.p.A.’s regional transportation network and the Virtual Exchange Point6, a quantity of gas not to exceed the daily flow provided. The natural gas introduced into the National Network originates
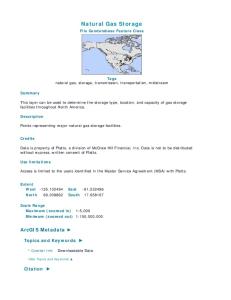
from imports and, to a lesser extent, national production. The gas from abroad is injected into the National Network via seven entry points where the network joins up with the import pipelines (Tarvisio, Gorizia, Gries Pass, Mazara del Vallo, Gela) and the LNG regasification terminals (Panigaglia, Cavarzere). Domestically produced gas is introduced into the Network through 51 entry points7 from the production fields or their collection and treatment centres. Gas storage fields are also connected to the transportation network (two virtual entry/exit points towards the storage hubs). The gas leaving the National Network is transported on the Regional Network up to the redelivery points from which the gas is withdrawn by the users. Snam Rete Gas S.p.A. is the leading domestic Italian natural gas transportation and dispatching operator, and owns almost all the transportation infrastructures in Italy, with over 31,600 kilometres in use of high- and medium-pressure gas pipelines (approximately 94% of the entire transportation system).
Snam Rete Gas S.p.A. – Network Infrastructure as at 31 December 2010 GRIES PASS
SAN DONATO MILANESE
TARVISIO
GORIZIA
CAVARZERE
PANIGAGLIA
National Transportation Network Import Entry Points Regional Transportation Network LNG Regasification Terminal Dispatching Centre Compression Station Maritime Terminal Regional Boundary
MAZARA DEL VALLO GELA
(5) The list of pipelines comprising the National network and the criteria for defining it are provided in the Decree issued on 22 December 2000 by the Ministry for Industry, Trade and Crafts as currently applicable, pursuant to the provisions of Legislative Decree No. 164 issued on 23 May 2000 (the Letta Decree). (6) A virtual point at which Users can exchange and trade gas injected into the National network on a daily basis. (7) Number of entry points as at 31 December 2010.
18
Snam Rete Gas Annual Report 2010 / Natural gas transportation
Key performance indicator
2008
2009
2010
Change
Change %
Core business revenue (*) - of which, natural gas transportation revenue
1,882 1,867
1,865 1,848
64 25
3.4 1.4
Operating costs (*) EBIT Investments - of which with incentives - of which without incentives
388 1,017 1,038 916 122
399 974 926 793 133
(56) 211 (24) (30) 6
(14.0) 21.7 (2.6) (3.8) 4.5
9,736 85.64 31,474 8,779 22,695
10,060 76.90 31,531 8,871 22,660
2,252
2,254
1,929 1,873 343 1,185 902 763 139 10,404 83.32 31,680 8,894 22,786 2,636
(€ million)
Net invested capital at 31 December Volumes of natural gas injected into the gas transportation network (billions of cubic metres) Transportation network (kilometres in use) - of which national network - of which regional network Employees in service at December 31 (number) (*)
344 6.42 149 23 126
3.4 8.3 0.5 0.3 0.6
382
16.9
Before consolidation adjustments.
Financial results Natural gas transportation revenue amounted to €1,873 million, an increase of €25 million, or 1.4%, compared with 2009. The increase was attributable to higher volumes of natural gas transported (+€20 million) and to recognition by the Electricity and Gas Authority of the additional expenses incurred for the acquisition of fuel gas in the period 1 October 2008 - 31 December 2009 (€55 million; +€21 million compared with the contribution of €34 million recorded in the 2009 financial statements as recognition of the additional expenses incurred in the 2007-2008 thermal year). These factors were partially absorbed by the application of new tariff criteria in effect from 1 January 2010, due essentially to the payment in kind by the users for the gas used for the transportation service8.
EBIT for 2010 was €1,185 million, up €211 million, or 21.7%, compared with the previous year. The increase was attributable mainly to: (i) lower operating costs (+€133 million, net of components offset in revenue), owing to the payment in kind of natural gas used in the transportation business and to the net use of provisions for risks and charges in relation to a provision made in 2009 (+€23 million); (ii) lower amortisation and depreciation (+€69 million) due mainly to the extension of the useful life of pipelines (from 40 to 50 years), which was considered in the Electricity and Gas Authority’s tariff review; and (iii) higher transportation revenue (+€10 million, net of components offset in costs).
Operating review Investments
(€ million)
Development Investments with 3% incentive Investments with 2% incentive Maintenance and other Investments with 1% incentive Investments with no incentives
Investments in 2010 amounted to €902 million, a decrease of €24 million, or -2.6%, compared with the previous year. The investments were classified in accordance with Resolu-
2008
2009
2010
813 578 235 225 103 122 1,038
692 451 241 234 101 133 926
671 456 215 231 92 139 902
Change (21) 5 (26) (3) (9) 6 (24)
Change % (3.0) 1.1 (10.8) (1.3) (8.9) 4.5 (2.6)
tion ARG/gas 184/09 of the Electricity and Gas Authority, which identified various categories of project with different incentive levels9.
(8) As of the start of the third regulatory period on 1 January 2010, the Electricity and Gas Authority, enacting the new tariff criteria laid down by Resolution ARG/ gas 184/09, has defined methods for payment in kind, by shippers to transporters, of gas volumes to cover fuel gas, network losses and unaccounted-for gas, owed as a percentage of the volumes respectively injected into and withdrawn from the transportation network. Applying these criteria entailed, on the one hand, reduced operating costs from lower charges for supplying the gas used to provide service and, on the other, reduced revenue in the amount which had been allocated to cover the operating costs. (9) The investment incentives were the same as for the second regulatory period.
19
Snam Rete Gas Annual Report 2010 / Natural gas transportation
Eighty-five per cent of these investments are expected to benefit from incentive-based return. The breakdown of investments in 2010 by category will be submitted to the Authority when the tariffs are approved for 2012. The main investments with a 3% incentive (€456 million) were: · as part of the connection project for the Offshore LNG Toscana (OLT) regasification terminal at Livorno (€136 million), the construction of infrastructure to connect with the plant located off the Tuscany coast, primarily offshore; · as part of the project to upgrade the import infrastructure in Sicily and Calabria (€101 million): (i) materials for and construction work on the Montesano station in Campania; (ii) completion works on operating sections and construction of the tunnel section of the Montalbano-Messina pipeline in Sicily; (iii) turbocompressors at the Enna station in Sicily; and (iv) construction work on the Bronte-Montalbano section of the Enna-Montalbano pipeline in Sicily; · as part of the new transportation infrastructure project on the Adriatic coast (€93 million): (i) construction work on the main line and the design of connection points for the Massafra-Biccari pipeline in Puglia and Basilicata; and (ii) design completion and the purchase of private permits for the Sulmona-Foligno-Sestino-Minerbio pipeline in Abruzzo and Emilia-Romagna; · as part of the Villesse-Gorizia pipeline project in Friuli-Venezia Giulia (€40 million), construction work and materials. The main investments with a 2% incentive (€215 million) were: · as part of the project to upgrade the transportation infrastructure in the Po Valley, with an aim to increase national transportation capacity (€55 million): (i) construction work on the Cremona-Sergnano pipeline in Lombardy; and (ii) design completion and purchase of permits for the Zimella-Cervignano pipeline in Veneto and Lombardy;
· as part of the Palaia-Collesalvetti pipeline project in Tuscany (€23 million), infrastructure construction materials. The main investments with a 1% incentive (€92 million) involved several projects aimed at maintaining adequate safety and quality levels at the stations. Investments without incentive (€139 million) included projects to replace assets and plants, as well as projects relating to the implementation of new IT systems, the development of existing ones and the purchase of other key operating assets.
Effect of investments with incentive (% of total investments)
(%)
12
14
15
10
11
10
26
24
49
51
2009
2010
23
55
2008 Investments with 3% incentive
Investments with 1% incentive
Investments with 2% incentive
Investments with no incentive
Distribution on the Italian Gas Transportation Network Availability of natural gas
(billions of m³)
From imports From domestic output Total gas injected in the network Net balance of storage withdrawals/injections (*) Total natural gas available (*)
2008
2009
2010
76.52 9.12 85.64 (1.12) 84.52
68.67 8.23 76.90 0.78 77.68
75.17 8.15 83.32 (0.64) 82.68
2008
2009
2010
83.34 0.60 0.42 0.16 84.52
76.66 0.48 0.34 0.20 77.68
81.54 0.54 0.47 0.13 82.68
6.50 (0.08) 6.42 (1.42) 5.00
Change % 9.5 (1.0) 8.3 6.4
The balance between the withdrawal from storage (+) and introduction into storage (-).
Withdrawals of natural gas Redelivery to domestic market Exports Snam Rete Gas consumption and emissions Unaccounted-for gas and other changes (*) Total natural gas withdrawals
(billions of m³)
(*) Includes the change of the network capacity For the definition of Unaccounted For Gas (UFG) please see the paragraph below titled “Withdrawals of natural gas.”
20
Change
Change 4.88 0.06 0.13 (0.07) 5.00
Change % 6.4 12.5 38.2 (35.0) 6.4
Snam Rete Gas Annual Report 2010 / Natural gas transportation
Availability of natural gas The availability of natural gas in Italy in 2010 was 82.68 billion cubic meters, up 5 billion cubic meters (+6.4%) compared to 2009. The quantities of gas injected into the National Transportation Network increased by 8.3% to 83.32 billion cubic meters. The increase in the quantities of gas injected into the National Transportation Network is due mainly to higher imports (+6.50 billion cubic meters or + 9.5%). The domestic production of 8.15 billion cubic meters has remained essen-
Imports by entry poin
(billions of m³)
tially unchanged compared to 2009 (8.23 billion cubic meters). The positive balance of around 0.6 billion cubic metres of injections into (+) and withdrawals from (-) the storage system also contributed to the increase in volumes injected into the network, compared to the opposite situation in 2009 where withdrawals from storage exceeded injections by around 0.8 billion cubic metres. The analysis of imports by entry point is:
2008
2009
2010
Change
24.77 24.58 9.87 15.69 1.52 0.09
21.66 22.92 9.17 12.02 1.53 1.32 0.05
26.29 22.49 9.41 7.83 7.04 1.98 0.13
4.63 (0.43) 0.24 (4.19) 5.51 0.66 0.08
76.52
68.67
75.17
6.50
Change %
Entry points Mazara del Vallo Tarvisio Gela Gries Pass Cavarzere (LNG) Panigaglia (LNG) Gorizia
Year-on-year imports rose by 6.5 billion cubic metres, or 9.5%, to 75.17 billion cubic metres compared to 2009. In addition to the contribution of gas from the LNG terminal injected at the Cavarzere entry point and operational from the third quarter of 2009 (+5.51 billion cubic metres), the higher imports from the entry
Volumes of natural gas injected into the Network per User (billions of m³) Eni Enel Trade Other
Natural gas injected into the network by entry point (% the total injected)
2
2
21
1 18
13
13 1
13
32
33 3
30
32
3 32
35
2008
2009
2010
(%)
3 2
Mazara del Vallo
Gries Pass
Tarvisio Gela
Cavarzere Other
9 10
21.4 (1.9) 2.6 (34.9) 50.0 160.0 9.5
point at Mazara del Vallo (+4.63 billion cubic metres; +21.4%) were partly offset by less gas injected at the Gries Pass entry point (-4.19 billion cubic metres; -34.9%) following the blockage in Switzerland of the import pipeline linking Italy to northern Europe. 2008
2009
2010
51.80 9.82 24.02 85.64
39.58 8.65 28.67 76.90
35.45 10.34 37.53 83.32
Change (4.13) 1.69 8.86 6.42
Change % (10.4) 19.5 30.9 8.3
Withdrawals of natural gas The natural gas withdrawn from the National Transportation Network in 2010 (82.68 billion cubic meters) is mainly: (i) for redelivery to users at the network exit points (81.54 billion cubic meters); (ii) exports (0.54 billion cubic meters), mainly to Slovenia; and (iii) consumption by the compression stations and the gas emissions from the network and the Snam Rete Gas S.p.A. plants (0.47 billion cubic meters). In the energy report compiled by Snam Rete Gas S.p.A. the natural difference between the quantity of gas metered at the entrance to the network and the quantity of gas metered at the exit, due to the technical tolerance of the metering devices, is traditionally defined as the Unaccounted For Gas (UFG). With Resolution ARG/gas 192/09, published on 15 December 2009 in application of the new tariff criteria set by Resolution ARG/gas 184/09, the Electricity and Gas Authority defined as from 1 January 2010 the terms for payment in kind by the users of the service to the major transportation company of the gas quantities to cover the un-accounted for gas, due as a percentage of the quantities withdrawn from the transportation network.
21
Snam Rete Gas Annual Report 2010 / Natural gas transportation
The demand for gas in Italy in 2010 was 82.98 billion cubic meters, up 4.96 billion cubic meters (+6.4%) compared to 2009, following the recovery of consumption after the recent economic crisis. The increase has affected all sectors, in particular residential and tertiary (+7.1%), industrial (+7.0%) and thermoelectric (+4.4%).
Gas demand by sector (% of total gas demand)
(%)
In thermal year 2010-2011, the development and upgrading work on the transportation infrastructures have made it possible to increase the network’s transportation capacity to 368.4 million cubic meters/day (+0.8% compared to the 2009-2010 thermal year). The increase is mainly attributable to the increase in transportation capacity at Gela and Mazara del Vallo, following the deployment of an upgrade on the infrastructures for the imports from North Africa.
Reconciliation of the quantities withdrawn from the Network and Italian demand (billions of m³) Quantity withdrawn Exports (-) Gas injected in the regional network of other operators Other consumption (**) Total demand Italy
2
2
2
23
21
21
40
37
36
35
40
41
2008
2009
2010
Residential and services
Industrial
Thermoelectric
Other
2008 84.52 (0.60) 0.09 0.87 84.88
2009 (*) 77.68 (0.48) 0.08 0.74 78.02
2010 82.68 (0.54) 0.06 0.78 82.98
Change 5.00 (0.06) (0.02) 0.04 4.96
Change % 6.4 12.5 (25.0) 5.4 6.4
(*) The demand for gas has been aligned with that published by the Ministry of Economic Development. (**) Includes the consumption of the LNG terminal at Panigaglia, the consumption of the compression stations for storage and the production treatment stations.
Demand for gas in Italy
(billions of m³)
Residential and services Thermoelectric Industrial (**) Other
2008
2009 (*)
2010
Change
Change %
30.18 33.90 19.31 1.49 84.88
31.60 29.02 16.07 1.33 78.02
33.83 30.31 17.19 1.65 82.98
2.23 1.29 1.12 0.32 4.96
7.1 4.4 7.0 24.1 6.4
(*) The demand for gas has been aligned with that published by the Ministry of Economic Development. (**) Includes the consumption of the Industrial, Agricultural and Fishing, Chemical Synthesis and Automotive sectors
Transportation capacity
22
87.7
293.7
91.5
85.9 95.3 90.9 99.7 79.5 55.4
321.6
88.0
Saturation (%)
11.4
102.8 98.7 59.0 32.9 21.0 7.2
Capacity allocated
13.0 4.8 321.0
119.7 103.6 64.9 33.0 26.4 13.0 4.8 365.4
2010-2011 thermal year Available capacity
92.2 91.6 93.7 100.0
Saturation (%)
97.8 93.2 60.8 30.5
Capacity allocated
106.0 101.8 64.9 30.5
Available capacity
Saturation (%)
2009-2010 thermal year
Capacity allocated
Tarvisio Mazara del Vallo Gries Pass Gela Cavarzere (GNL) Panigaglia (GNL) Gorizia
(billions of m³/day)
2008-2009 thermal year Available capacity
Entry points
119.2 105.0 64.8 35.2 26.4 13.0 4.8 368.4
110.3 98.9 55.0 34.3 24.6 7.2 0.5 330.8
92.5 94.2 84.9 97.4 93.2 55.4 10.4 89.8
Snam Rete Gas Annual Report 2010 / Natural gas transportation
The capacity available on the network has made it possible to address the capacity demand of all Users in thermal year 20102011, with an increased capacity of 2.9%. In addition to the aforementioned capacities which concern the entry points interconnected with foreign countries and the LNG terminals, transportation capacity totalling 37 million cubic meters/day is available at the domestic production entry points. Snam Rete Gas S.p.A. put out its long term plan for transportation capacity, which was disclosed to the Ministry of Economic Development on 21 June 2010 and published on the Snam Rete Gas S.p.A. website. The document shows the capacity data on all entry points interconnected with foreign countries and the LNG terminals for the 2010-2011 thermal year and subsequent years up to 30 September 2020. Gas transportation capacity and saturation
500 450 368.4
365.4
400 321.0
350
321.6
331.0
293.7
300 250 200 150
91.5
100
88.0
89.8
50 2008-2009
2009-2010
2010-2011
Available capacity (millions of m³/day) Capacity allocated (milions of m³/day) % saturation (Capacity allocated/Available capacity)
Regulation Resolutions no’s. 166/05 and 102/08 - “Criteria for the determination of tariffs for natural gas transportation and dispatching” and “Approval of the tariff proposals for natural gas transportation and dispatching prices”. With Resolution no. 166/05 “Criteria for the determination of tariffs for natural gas transportation and dispatching” published on 30 July 2005, the Authority for Electricity and Gas outlined the criteria for defining the natural gas transportation tariffs on the national and regional gas transportation network for the second regulatory period (1 October 2005 – 30 September 2009). The mechanisms already in effect in the first regulatory period were confirmed for the determination of the price levels and a real return on invested capital was fixed at 6.7% before taxes. Investment incentives were
provided for the second regulatory period as well through a return rate increased by 1 to 3 percentage points compared to the rate for capital existing at the end of 2004 (6.7%) for a duration of between 5 and 15 years. Both the rate of return and the duration are differentiated according to the various types of investment. The returns associated with the new investments will be recognized starting from the thermal year following that in which the costs were incurred (“spending”) and are guaranteed regardless of the volumes transported. The updating method for the “price cap” tariffs is applied only to revenue components that relate to operating costs and the amortisation and depreciation which is updated for inflation and decreased by a productivity coefficient set at 2% for the capacity component and 3.5% for the component related to volumes transported. The revenue component which is correlated with returns is determined on the basis of the annual update of net capital invested as at 31 December 2004 (RAB). The tariff structure which is based on the entry/exit model was confirmed for the second regulatory period as well, except for the fixed fee, which was replaced by a special measuring fee. With Resolution ARG/gas 102/08 - “Approval of the tariff proposals for natural gas transportation and dispatching prices, in implementation of the Resolution no. 166/05 issued on 29 July 2005 by the Electricity and Gas Authority,” published on 31 July 2008, the Electricity and Gas Authority approved the natural gas transportation tariffs for the thermal year 2008-2009. The tariffs are determined on the basis of the base revenues, the additional revenues of €39 million for development investments made during the first regulatory period and additional revenues of €233 million for investments realised in 2005, 2006 and 2007. The net capital invested as at 31 December 2007 (RAB) is €12.2 billion. The Authority also confirmed, for thermal year 2008-2009, the introduction of an additional fee for coverage of the higher expenses incurred for the purchase of gas for compression and the network leaks. Resolution ARG/gas 184/09 - “Approval of part II – Regulation of the tariffs for the natural gas transportation and dispatch service for regulatory period 2010-2013 (RTTG), approval of part III - Regulation of tariffs for the gas transportation metering service for regulatory period 2010-2013 (RMTG), provisions on the transitory fee for the gas transportation metering service for 2010 and amendments to Attachment A of Resolution no. 11/07.” With Resolution ARG/gas 184/09, published on 2 December 2009, the Electricity and Gas Authority issued the criteria for defining natural gas transportation and measuring tariffs on the national and regional gas transportation network for the third regulatory period (1 January 2010 - 31 December 2013)10. The Authority also set €33.6 million as the amount to be paid to Snam Rete Gas S.p.A. for additional costs incurred in thermal year 2007-2008 for the purchase of fuel gas used to power compression stations.
(10) Resolution ARG/gas 135/09 of the Authority, published on 28 September 2009, extended the validity of tariffs approved for the 2008-2009 thermal year to the period 1 October 2009 - 31 December 2009.
23
Snam Rete Gas Annual Report 2010 / Natural gas transportation
The valuation of the net capital invested (RAB) is based on the revalued historic cost method. The return rate (WACC) of net capital invested is set at a real rate of 6.4% before taxes. The incentives for new investments were confirmed and provide for a higher return compared to the variable base rate (WACC), in relation to the type of investment, from 1% to 3% and for a period from 5 to 15 years. The revenues associated with new investments are paid starting from the second year following that in which the costs were incurred (“spending”) and are guaranteed regardless of the volumes transported. The method for updating the “price cap” tariffs is applied to revenue relating to operating costs and is equal to approximately 15% of the revenues in question, which are updated for inflation and decreased by an annual recovery coefficient set at 2.1% (3.5% in the previous regulatory period). The revenue components which are related to returns and amortisation and depreciation are determined on the basis of the annual update of net capital invested (RAB). In particular, in the third regulatory period, the amortisation and depreciation is deducted from the price-cap mechanism and calculated on the basis of the useful economic and technical life of the transport infrastructure which is 50 years (40 years in the previous regulatory period). The tariff structure is based on an entry/exit model and was confirmed for the third regulatory period as well, together with the capacity fee for the metering service.
24
Finally, fuel gas is treated as a pass-through cost which is payable in kind by the users and is excluded from the price cap mechanism. Resolution ARG/Gas 192/09 - “Amendments to Resolution no. 137/02 of 17 July 2002, for defining criteria on the treatment of non-metered natural gas (gas consumed internally, network leaks, withdrawals/injections into the network and unaccounted-for gas) as part of the balancing service.” With Resolution ARG/gas 192/09, published on 15 December 2009, in application of the new tariff criteria established with Resolution ARG/ gas 184/09, the Authority for Electricity and Gas defined the terms for payment in kind by the users of the service to the major transport company, the gas quantities for coverage of the fuel gas, the network leaks and the unaccounted-for gas due as a percentage of the quantities injected and withdrawn from the transportation network. Resolution ARG/gas 198/09 - “Approval of the proposals for the natural gas transportation and dispatch service tariffs and the transitory fee for the gas transportation metering service for 2010.” With Resolution ARG/gas 198/09, published on 23 December 2009, the Authority approved the transportation, dispatch and metering tariffs for 2010. The tariffs were determined on the basis of the base revenues of €1,703 million (net of all pass through costs, including fuel gas and network leaks), the additional revenues relating to develop-
Snam Rete Gas Annual Report 2010 / Natural gas transportation
ment investment incentives realised in the first regulatory period of approximately €28 million and the revenues associated with the system balancing costs of approximately € 23 million. The revenues in effect from 2010 will have to take account of the increase volumes transported compared to the base amount of 75.7 billion cubic meters. The portion of the revenues associated with the transportation capacity is guaranteed and is equal to approximately 85% of the base revenues. The RAB as at 31 December 2008 for transportation, dispatching and metering is €12.8 billion. Resolution VIS 8/09 - “Closure of the preliminary investigation begun following Authority for Electricity and Gas Resolution VIS 41/08 of 15 April 2008 on the correct application of the provisions concerning unaccounted-for gas in the natural gas transportation networks from 2004 to 2006”. With Resolution VIS 8/09, published on 5 February 2009, the Authority for Electricity and Gas concluded the preliminary investigation for acquisition of the information relating to Unaccounted for Gas (UFG) within the transportation system during 2004-2006 and began a survey on the service and maintenance of a portion of the transportation network’s metering installation, which was scheduled to be completed on 30 September 2009 but was extended to 31 March 2010 with Resolution VIS 96/09; the survey was con-
cluded with Resolution VIS 93/10 on 6 September 2010. Several irregularities were discovered concerning the management of the metering plants owned by entities other than Snam Rete Gas S.p.A. Resolution ARG/gas 218/10 - “Approval of the tariff proposals for natural gas transportation and dispatch, the transitory fee for the gas transportation metering service for 2011 in implementation of the provisions set forth in Resolution ARG/gas 184/09 issued by the Authority for Electricity and Gas on 1 December 2009.” Based on the criteria described, the Authority approved the transportation, dispatch and metering tariffs for 2011 with Resolution ARG/gas 218/10. The tariffs were determined on the basis of the base revenues which amounted to €1,817 million net of the third party portion (of which €113 million relate to development investment incentives and approximately €36 million to revenues associated with system balancing costs). The actual revenues for 2011 will have to take into consideration the increase in the transported volumes compared to the base value, which is 75.7 billion cubic meters. Furthermore, the amount payable to the company for higher costs incurred for the purchase of fuel gas from 1 October 2008 to 31 December 2009 was set at €54.9 million. The RAB as at 31 December 2009 for transportation, dispatch and metering amounts to € 13.1 billion.
25