Final Technical Report
NATIONWIDE FOREST ENCROACHMENT MAPPING USING REMOTE SENSING AND GIS TECHNIQUES - MAMPUR STATE
..
MiI1Iipur Fgrnt Dlpilrtmlnt (MFD), Imphl.l MiI1Iipur Stl.tl RIImgtl Sinlin, Clntu (MARSAC), Imphill
Spiel Applicltianl Clntn (SAC - ISRO ) Ahmed.b.d /)«ember 1007
Final Technical Report
Nationwide Forest Encroachment Mapping Using Remote Sensing and GIS Manipur State
Sponsored by Ministry of Environment and Forests, Govt. of India
Manipur Forest Department (MFD) Imphal,
Manipur State Remote Sensing Applications Centre (MARSAC) Imphal and
Space Applications Centre (SAC - ISRO) Ahmedabad. December 2007
SPACE APPLICATIONS CENTRE ( SAC-ISRO ) AHMEDABAD - 380 015 DOCUMENT CONTROL AND DATA SHEET
1.
Report No
:
GIDD/GTDG/RESA/SAC/TR-01/Dec 2007.
2.
Publication Date
:
December 2007
3.
Title & Sub Title
:
Nation Wide Forest Encroachment Mapping - Manipur State
4.
Type of Report
:
Technical Report
5.
Pages & Figs.
:
92 and 43
6.
No. of References
:
14
7.
Authors
:
Project Personnel
8.
Originating Unit
:
Geo-Informatics and Databases Division (GIDD)
9.
Abstract
:
The report deals with Forest Encroachment mapping of Manipur State using Remote Sensing and GIS techniques on 1:50,000 scale showing Forest status vis-à-vis type of encroachment separately under National Parks (NP), Protected Forests(PF), Reserve Forests (RF) and also under Un-class Forests areas. .
10. Key Words
:
Encroachment, Shifting Cultivation (JHUM), GIS database, Geometric Correction and Registration, Forest Boundaries, NP, PF, RF, Un-class Forest.
11.
Security Classification
:
General.
12.
Distribution Statement
:
Among Concerned
List of Project Personnel Space Applications Centre (SAC - ISRO), Ahmedabad Shri. K.L.N. Sastry Dr. A.K. Kandya Dr. P.S. Thakker Dr. Ajai
Manipur State Remote Sensing Applications Centre (MARSAC), Imphal Shri. L. B. Shangkooptong Mrs. Rajkumari Sunita Devi Dr. N. Shamungou Singh Manipur Forest Department, Imphal Shri K. Jagadishwor Singh, IFS Dr. Khaizalian, IFS Shri K. Thambou Singh, IFS Dr. S. Singsit, IFS, PCCF, MFD
Contents Page
Part - I : Project Sanction Details Part - II
02
1.0
Introduction
03
2.0
Relevance of the project
04
3.0
Objectives
05
4.0
Study area
05
4.1 4.2 4.3 4.4 4.5
5.0
Geographic Physio-geography Drainage Soil Types Socio-economic Profile
Forest Status of Manipur 5.1 5.2
10
Different issues regarding Manipur forests Jhum (Shifting) Cultivation
6.0
GIS database design and organization for Forest Encroachment Mapping
23
7.0
Methodology
26
7.1
8.0
Satellite data analysis 8.1 8.2
9.0
Database Design & Organization for Manipur State
Ground Truth Hybrid Analysis
Results and Findings 9.1 9.2
29
31
State wise Encroachment Status District Wise Encroachment
10.0 Discussion and Conclusion References Part - III : Spin off of the Project
41 41 43
List of Tables Table: 1
Guidelines for Manipur GIS Database Design
Table: 2
Satellite Data Interpretation Key for Forest Encroachment Mapping
Table: 3
Status of Encroachment in Manipur State
Table: 4
Status of Encroachment in Senapati District
Table: 5
Status of Encroachment in Tamenglong District
Table: 6
Status of Encroachment in Ukhrul District
Table: 7
Status of Encroachment in Imphal (West)
Table: 8
Status of Encroachment in Imphal (East)
Table: 9
Status of Encroachment in Thoubal District
Table: 10
Status of Encroachment in Bishnupur District
Table: 11
Status of Encroachment in Chandel District
Table: 12
Status of Encroachment in Churchandpur District
List of Figures Fig: 1 Location Map of Manipur Fig: 2 Watershed Map of Manipur Fig: 3 Schematic Representation of Methodology Field Photographs Fig: 4 Current Jhum within Forest Fig: 5 Permanent Agricultural Patches within Forested Land Fig: 6 Abandoned Jhum within Forest Fig: 7 Current Jhum within Forest Fig: 8 Banana and Pineapple orchards Within Forested Land Encroachment Status Maps Section No 9.1
Title of the Map Encroachment status under Existing and Proposed National Park (NP) – Manipur State Encroachment status under Existing Protected Forest (PF) – Manipur State Encroachment status under Existing and Proposed Reserve Forest (RF) – Manipur State Area of forested land under non-forestry use(Unclass Forest) – Manipur State
9.2
Encroachment status under Existing Protected Forest (PF) – Senapati District Encroachment status under Existing Reserve Forest (RF) – Senapati District Encroachment status under proposed Reserve Forest (RF) – Senapati District Area of forested land under non-forestry use(Unclass Forest) – Senapati District Encroachment status under Proposed National Park (NP) – Tamenglong District Encroachment status under Existing Protected Forest (PF)– Tamenglong District Encroachment status under Existing Reserve Forest (RF) – Tamenglong District
9.2
Encroachment status under Proposed Reserve Forest (RF)–Tamenglong District Area of forested land under non-forestry use(Unclass Forest) –Tamenglong District Encroachment status under Proposed National Park (NP) – Ukhrul District
Section No
Title of the Map Encroachment status under Existing Protected Forest (PF) – Ukhrul District Area of forested land under non-forestry use(Unclass Forest) – Ukhrul District Encroachment status under Existing Protected Forest (PF) – Imphal (W) Encroachment status under Existing Reserve Forest (RF) – Imphal (W) Encroachment status under Proposed Reserve Forest (RF) – Imphal (W) Encroachment status under Existing Protected Forest (PF) – Imphal (E) Encroachment status under Existing Reserve Forest (RF) – Imphal (E) Area of forested land under non-forestry use(Unclass Forest) – Imphal(E) Encroachment status under Existing Reserve Forest (RF) – Thoubal District Encroachment status under Existing Protected Forest (PF) – Bishnupur District Encroachment status under Existing Reserve Forest (RF) – Bishnupur District Encroachment status under Proposed Reserve Forest (RF) – Bishnupur District Encroachment status under Existing National Park (NP) – Chandel District Encroachment status under Existing Protected Forest (PF) – Chandel District Encroachment status under Existing Reserve Forest (RF) – Chandel District Encroachment status under Proposed Reserve Forest (RF) – Chandel District Area of forested land under non-forestry use(Unclass Forest) – Chandel District
9.2
Encroachment status under Proposed National Park (NP) – Churachandpur District Encroachment status under Existing Protected Forest (PF) – Churachandpur District Encroachment status under Existing Reserve Forest (RF) – Churachandpur District Area of forested land under non-forestry use(Unclass Forest) – Churachandpur District
ACKNOWLEDGEMENTS Identification and mapping of forest encroachment is one of the important information needed for forest management including working plan preparation. Spatial inventory on the encroachment including the area and type are not available in many of the states. Therefore, a pilot project was taken up by Space Applications Centre (SAC - ISRO), Ahmedabad, at the behest of Ministry of Environment and Forests (MoE&F) to develop and standardize the methodology based on GIS and Remote Sensing. The project has been successfully executed in collaboration with Manipur Forest Department (MFD), and Manipur State Remote Sensing Applications Centre (MARSAC), Imphal. The project team would like to place on record their deep sense of gratitude to Dr. R.R. Navalgund, Director, Space Applications Centre, Ahmedabad, for constant encouragement and guidance during the execution the project. We are extremely grateful to Dr. Singsit, PCCF, Manipur Forest Department and his team for overwhelming support towards the successful completion of the project. Our sincere thanks are due to Dr. J. S. Parihar, Deputy Director, RESA, for critical and useful suggestions from time to time, to Dr. Manab Chakraborty, Group Director, GTDG, Dr. Sushma Panigrahi, Group Director, AFEG and Dr. S.K. Pathan, Head, GIDD, for their valuable discussions and suggestions in finalization of this report. Our special thanks are also due to the extensive help provided by the territorial DFOs & their staff for logistic support & security during the ground truth. We are grateful to Ministry of Environment and Forests, New Delhi for financial support and Dr. R. Mehta, Advisor, and Dr. R.K. Suri for their support and critical comments/suggestion from time to time during the tenure of the project. We are thankful the members of the Technical and Financial sub-committee of SC-B specially Dr. Bipin Bihari, DIG Forest, MoE&F, and Dr. S. Ashutosh, Joint Director, FSI for critical comments/suggestion during the project review. Finally, We, express our sincere thanks to every individual and all the organisations/ institutions those who have directly or indirectly contributed in the successful completion of this project. (Dr. Ajai)
PART - I
1. Title of the Project
:
Nationwide Forest Encroachment Mapping Using Remote Sensing and GIS Techniques - Manipur State
2. Name of the Members of the Research Team and their designations
:
As per the list of Project Personnel
3. Number and date of Sanction Letter
:
F. No. 13/12/2003-EI / RE Dated : 17/03/2004
4. Duration of the Project
:
03 Years
5. Total outlay of the Project
:
Rs. 36,44,667/-
6. Date of Start of the Project
:
Dec, 2003
7. Date of Completion of the Project
:
Dec, 2007
PART -
II
Abstract of the Project (Executive Summary)
The forests have been substantially influenced by human intervention for at least several thousand of years. Forest resources and land-use changes contribute maximum on sustainable forest management. Without comprehensive information on the status, dynamics and responses of the forest ecosystem, it is impossible to evaluate management strategies, or to clearly identify and quantify changes in forest resources, including forest areas, and the composition and quality of forests. Forestry information requirements are multi-dimensional and include parameters relevant to productive, environmental and socio-economic benefits from and in the forest. The challenge is to improve the management of forests by providing decision makers and stakeholders with the best possible, most relevant and cost-effective information for their purpose at the local, national and international levels. The watersheds of north east mountain regions are characterized by the permanent conflict between the need for conservation of natural resources on one hand and constantly growing population and land use pressure on the other. They are fragile regional ecosystems in which increasing deforestation and forest degradation directly impact on the entire ecological infrastructure (e.g., hydrological and soil resources). Manipur constitute an area of 22, 32700 sq km, in which the forest cover is about 17, 618 sq km. 17,071 sq km, 16,688 sq km and 16,870 sq km in 1997, 1999, 2001 and 2003 respectively (FSI 1997, 1999, 2001 and 2003). Manipur is situated in the extreme North-Eastern Border of India. It is bounded on the north by the State of Nagaland, on the east by the Upper Myanmar, on the south by the Chin Hills of Myanmar and the State of Mizoram and on the west by Cachar district on Assam. It lies between 92059’ E to 94045’ E longitude and 23050’ N to 25041’ N latitude. The total geographical area of the State is 22,327 sq.km. On the basis of geographical features, the state is divided into two physiographical units Hills and Valley Plains. The periphery of the State is bounded by a series of parallel hills, which covers 9/10th of the total geographical area of the State. The Plains consisting of the Manipur Valley covers an area of about 2,238 sq.km. The state is drained by several small rivers and the drainage is mainly from north to south. The major rivers viz., Barak, Imphal, Iril, Thoubal are perennial and of great importance. In Manipur, jhumming is mainly practiced by the tribal families in five hill districts, viz. Chandel, Churachandpur, Senapati, Tamenglong and Ukhrul. The system essentially consists of felling of the forest on a hill slope in November-December and burning of the debris in April-May before dibbling the seeds into the cleared soil. In order to develop a remote sensing based methodology for forest encroachment mapping, this project was taken up by Space Applications Centre under NNRMS-SC-B programme of Ministry of Environment and Forests with the following objectives:
To map and estimate recent status of forest encroachment using Remote Sensing data. To design and organize GIS database for the entire state. To work out statistics of total area under various types of encroachment.
The study area of the project has been taken as the entire Manipur State. IRS P6 data of Dec. 2005 and Feb 2006 (Winter data) and Mar – April 2006 (Summer data) has been used for mapping different categories of forest encroachment. The methodology consists of base map preparation, satellite data analysis, identification of different types of encroachment, design and organization digital database, integration and generation of statistics. A hybrid approach comprising of digital as well as visual interpretation has been developed for analysis of satellite data for identification and delineation of encroachment areas. The GIS database has been designed following the NNRMS standards. Modified Everest datum has been used and the analyzed final output has been projected into map form using LCC projection. The maps showing different categories of encroachment, separately for existing and proposed national parks, existing and proposed RF and PF etc. are prepared on 1:50000 scale. The output maps are created using the ArcMap tools. The statistics for forest encroachment has been generated for each of the districts as well as for the entire state. As per the analysis carried out, it is found that forest encroachments under Existing National Park (NP) is about 58.18 Sq. km. (27.97%), but under Proposed National Park it is 188.20 Sq. km (29.96%). Under Protected Forest it is found 728.56 Sq. km (17.57%) and in Existing Reserve Forest (RF) 421.86 Sq. km (28.56%) and under Proposed Reserve Forest 298.33 Sq. km (17.11%). The major Encroachment is found under Current Jhum and Abandoned Jhum categories.
1. INTRODUCTION India is among the 12 ‘Mega – diversity’ countries of the world and reflects possibly the entire spectrum of eco-climatic zone – from cold deserts to dense tropical forests. The forests of India cover about 23% of the total geographical area of the country. Out of the country’s total forest area of approximately 63.7 million ha, large portion is degraded and under stocked (about 40 per cent of the total forest area is open or degraded forest), particularly near the habitation. This degradation is mainly due to over exploitation, excessive grazing and uncontrolled regular fires (FSI, 1999; Dwivedi, 1980). Increasing industrialization and growing population are also responsible for damaging the forestland. Biotic interference is the most widespread factor of forest damage, which includes illicit cutting, shifting cultivation and encroachment (permanent clearance for agriculture) which is one of the most threatening practices. Other interferences like quarrying and illicit felling of forestland directly or indirectly affect the area. Forestland is encroached upon quite often for illegal agricultural practices and now forest encroachment is a regular phenomenon. As the population increases there is more and more demand for land for agriculture. Forestdwelling communities or people who live in the vicinity of forests mainly make encroachment. They use forestland for cultivation on two counts; firstly, forestlands are taken by the people to be more fertile, secondly, forestlands are in vicinity of their habitations. Hence the encroachment on forestland is generally followed by diversion of forestland to agriculture use. The tribal depends on forests not only for firewood for domestic energy and warmth, and timber for constructing their houses, but also for food in form of fruits, seeds, leaves, succulent shoots and tuber. They also get their medicines from forest. They collect gums, resins, various seeds, fruits and leaves to sell in the market. The committee on Forest and Tribal in India, reported in 1982 that nearly 12 % of the tribal population of the country is involved in shifting cultivation, 2 % reside in forest villages, and about 5 % are encroachers of forest lands. Recognizing the significance of encroachment in forest degradation, National Commission on Agriculture (1976) had defined forest encroachment as unauthorized of forest produce and diversion of such forest land to non forest land use/ cover practices including jhumming. The problem of forest encroachment is not of recent origin. Its genesis lies in the first Forest Act, enacted by the British Government in 1865 wherein the ownership was taken over by the state, ignoring the rights of the indigenous local communities that lived in the forest and depended on it for their basic necessities of life. In the post independence era, the emphasis of the forest management was on the intensive commercial forestry in order to generate revenue from the forests. The first National Forest Policy enacted in 1952, did not account for the need of the local people / communities living in the forest since centuries and those who had been the natural owner of the forest. This policy set in motion, the ecological tragedy from the subordination of ecology to economics. The socio-economic condition of the people / communities living inside the forest or in its close proximity, dictates the intensity of encroachment. This is evident from the reduced jhumming cycles in almost all states where jhumming cultivation is practiced. The serious environmental effects of forest removal through burning are the occurrence of number of ecological catastrophes such as flash floods, soil and land degradation, loss of fertile topsoil decrease in productivity and health hazards.
Recognizing the damage being done to the ecology and environment, the International Conference on Human Environment (1979) stressed that the environment is to be viewed in totality, including physical, biological and socio-cultural environment. It was also observed that each and every part of each environment component is highly responsible for the functioning and regulation of each ecosystem. Any perturbation in the components, which are superimposed on one another, would result in degradation of the ecological balance (Homeostatis) of the ecosystem. Degradation in various land and aquatic habitats often causes serious ecological and socioeconomic turmoil. In the backdrop of the above, the present study had been undertaken to map the forest encroachment in the state of Manipur. 2. RELEVANCE OF THE PROJECT It is now well understood that the survival of the human race depends on the forest. The forests today are more threatened than in the past, owing to the increasing population pressure. Also the forests are being diverted to non-forestry land uses. Thus, the forest and tree cover area in the country in 2003 stood at 23.64 per cent of the country’s geographical area. This is against the national policy of having the forest in 33 per cent of the geographical area as envisaged in the first National Forest Policy enacted in 1952. This meager amount of forest constitutes about 1.8 per cent of the global forest, which support 17 per cent of human population and 18 per cent of bovine population. Such population pressure accelerates deforestation. World Bank (1992) has noted the annual rate of deforestation between 1980 and 1990 averaging 1.2 per cent in Asia, compared with 0.9 per cent in the developing world. In view of these facts, Government of India has been initiating various activities not only to ameliorate the health of the forest but also to bring more areas under forest cover. Hence, the present project was perceived to map the forest encroachment using latest remote sensing data and GIS. As a pilot study, the project was taken up in the state of Manipur. It was envisaged that with the experience gained and expertise developed during the implementation in the state of Manipur, a national program on mapping forest encroachment will be launched in future with the support of MOE&F, Govt. of India, New Delhi. 3. OBJECTIVES To map and estimate recent status of forest encroachment using Remote Sensing data. To design and organize GIS database for the entire state. To work out statistics of total area under various types of encroachment. 4. STUDY AREA 4.1 Geographic Manipur is situated in the extreme North-Eastern Border of India. It is bounded on the north by the State of Nagaland, on the east by the Upper Myanmar, on the south by the Chin Hills of Myanmar and the State of Mizoram and on the west by Cachar district on Assam. It lies between 92059’ E to 94045’ E longitude and 23050’ N to 25041’ N latitude. The total geographical area of the State is 22,327 sq.km. On the basis of geographical features, the state is divided into two physiographical units Hills and Valley Plains.
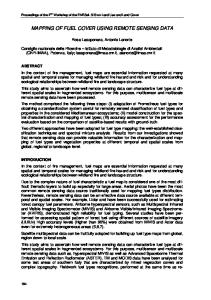
The periphery of the State is bounded by a series of parallel hills, which covers 9/10th of the total geographical area of the State. The Plains constituting the Manipur Valley covers an area of about 2,238 sq.km. The state is drained by several small rivers and the drainage is mainly from north to south. The major rivers viz., Barak, Imphal, Iril, Thoubal are perennial and are of great importance. The State has a sub-tropical monsoon to temperate climate depending on the elevation. It receives rainfall from monsoon and the rainfall varies from 1016 to 1778 mm a year. The rainy season lasts from April to September and the amount of rainfall is more in hills than in the valley. The driest period recorded is from November to March. The maximum rainfall of the State is recorded in the month of July and August. The mean maximum daily temperature is 31.10C and the mean minimum daily temperature during the winter season is 11.80C. The state has a lopsided population distribution with 59% of its population living in the valley and 41% thinly distributed in the hill areas (Economic Survey, Manipur, 2000). The valley is one of the most thickly populated areas in the country with a density of 633 persons per sq km as compared to an all India average of 324 persons per sq km. The hills are sparsely populated with 52 persons inhabiting per sq km. The state experienced a rapid growth of population, registering a decadal population growth rate of 30.02% during 1991-2001 against the national average of 21.34%. There are 9(nine) districts, 38 sub-divisions, and 166gram panchayats in the State. The Imphal-East, Imphal West, Thoubal and Bishnupur districts are valley districts.
Fig: 1 Location Map of Manipur
4.2
Physio-geography
Geologically, Manipur State belongs to the young folded mountains of the Himalayan system. The rocks in the State vary from upper Cretaceous to the present Alluvium. The oldest rocks found in Manipur are mainly confined in the eastern side of the state close to the Indo-Burma border and the rocks are grouped as cretaceous rocks consisting chromite (ophiolites), serpentine, etc. The limestone deposits found in the Ukhrul district belong to the upper cretaceous period. The sandstone, shale of the Disang Group found over the eastern half of Manipur belong to the Eocene period. The rocks consisting of sandstone, shale, clay, etc. of the Barail Group are confined over the rocks of Disang Group and extend along the mid-western portion of the State and they belong to the upper Eocene and Oligocene periods.
Altitudinal zonation of the state ranges from 40m above msl at Jiribam bordering Cachar district of Assam to 2995m (Mt. Iso) in Senapati District bordering Nagaland state. According to National Bureau of Soil Survey & Land Use Planning, Nagpur, the soils of Manipur belong to 4 Orders, 8 Suborders, 13 Greatgroups, 22 Subgroups and 29Families. The Inceptisol covering 38.4% are the dominant Ultisols (36.4%), Entisols (23.1%) and Alfisols (0.2%). Marshy land and lakes constitute about 2% of the area. Major Soil problems are acidity, erosion, low base status, limiting depth in steep slopes and landslides. 4.3
Drainage
Regarding drainage system, it may be said that there are three distinct major river basins viz. the Manipur river basin draining towards south, the Barak river basin draining into Assam/Bangladesh and the Chindwin (Myanmar) river basin. Among the rivers, important ones are the Imphal river, the Iril river, the Thoubal river, the Chakpi river, the Tuivai river, the Irang river, the Makru river, the Jiri river, the Barak river, the Maklang river, the Lokchao river and the Taret river,etc. The state is drained by various streams which belong to the three river systems. The Manipur river and its tributaries - Imphal, Thoubal, Nambul, Nambol, Khuga, Sekmai, and other smaller streams with Loktak and other associated lakes form the water resources of the valley having catchment of 6,332 sq. km about 28.4% area of the state. Discharging maximum quantity of water during the monsoon months (May- September), they frequently inundate the land along their banks. Every year Manipur experience havoc of flood. River Barak and its tributaries Irang, Makru, Jiri and their associated streams which drain the Northern and Western hill areas, have a catchments of 9042 Sq. Km. about 40.5% area of entire State. The Eastern slope of Manipur eastern hills is connected by a number of small streams of the Chindwin river system, which have a catchments of 6953 sq.km., about 31.1% area of the State.
± 3D2B1a 3D2B2a 3C2D5p 3C2D5p
3D2B1b 3D2B1c 3D2B2b
3C2B3 3C2D5b 3C2D5c3C2D5f 3C2D5l 3C2D5n 3C2D4h 3C2D5d
3C2D4e 3C2D4f
3C2D5m
3C2D5h 3C2D5e 3C2E4a
3D2B1e
3D2A9h
3C2D4d
3C2E3k
3C2E3h 3C2E3j
3C2E3f
3D2A6k 3D2D3f 3D2A9b 3D2A9a3D2A9d3D2A9f
3C2D5g 3C2D3d 3C2C6a
3C2E3c 3C2E4d
3C2D5a 3C2E4e3C2E4f 3C2E2a3C2E5a
3C2D3e
3D2B2k 3D2B2l 3D2B1k 3D2C6j
3D2C6e 3D2B1k 3D2A6m 3D2C6e 3D2A6l
3C2E3d
3D2A7c
3D2C6g
3D2A9e
3D2A8e
3D2C6h
3D2A6h 3D2C4p
3D2A8c3D2A8d
3C2E3b 3D2A5k 3C2E4g 3C2D3h 3C2D2b 3C2E4c 3D2A5l3D2A5m 3C2D3e 3C2E3a 3C2C5a
3D2B1j
3D2A6j 3C2E3g 3D2D3e 3D2A8f 3C2E3e
3C2D3j
3D2B2h
3D2B1h 3D2B2j
3C2D2d3C2D3k 3C2C5c 3C2D3l
3C2C5b
3D2B2g
3D2A9c
3C2D4b 3C2E3d 3C2D2e 3C2D4a
3C2D2c
3D2A9g
3D2B2e 3D2B2d 3D2B2c 3D2B2f
3D2B1f
3D2B1g
3D2D5k 3C2C5d3C2D2f
3D2B1d
3D2C4g 3D2C4n
3D2A8b3D2A6f
3D2C4f
3D2C6d 3D2C6c 3D2C6f 3D2C6b
3D2C4m 3D2C4l 3D2C6a
3D2A5k 3D2A7a3D2A8a 3D2A5h 3D2A5j
3D2C4e 3D2A6e
3D2C4d
3D2C4k
3D2C5b
3C2E2b 3D2C4j 3C2E4e 3D2A5g 3D2C5a 3D2A6c 3D2C4c 3C2E5b 3C2E2c 3D2A6d 3D2A5f 3C2E2d 3D2C3f 3D2C4b 3D2C4h 3C2D3a 3D2A5e 3D2A6a 3D2A6b 3C2E2e 3C2E5c 3C2E2f 3C2C6c 3D2C3e 3C2D3c 3D2A5d 3D2C4a 3C2D3b 3D2C3d 3D2A4e 3D2A5c 3C2E1a 3D2A4f 3D2C3b 3C2E1f 3C2C6d 3D2A5a 3C2E1b 3D2A5b 3D2C3c 3C2D1e 3C2E5e 3D2A4a 3C2E1g 3D2A4c 3C2E5f 3D2C3a 3D2A4d 3C2C6e 3C2E1c 3C2E1h 3D2A3b 3C2D1d 3D2C2f 3D2C2g 3D2A3a 3D2A2h 3D2A4b 3C2F6l 3C2F7f 3C2E1j 3C2E1d 3C2C6f 3D2A3c 3D2A2k 3C2D1c 3D2A2g 3D2C2d 3D2A2j 3D2A1h 3D2C2e 3C2F2c 3C2E1k 3D2A2f 3C2F6k 3D2A3d 3C2F6j 3D2A1g 3C2E1e 3D2C2b 3C2D1b 3D2A2a 3D2C2c 3C2F6g 3C2F6h 3C2F7a 3C2F2b 3D2A2e 3D2C2a 3D2A3e 3D2A1d 3C2F6b 3D2A1c 3C2D1a 3D2C1h 3D2A2d 3C2F6e 3D2A3f 3D2A2b 3C2F6f 3C2F2a 3C2F6a 3C2F7e 3C2F6c 3C2F7b 3D2C1f 3D2A1e 3D2A3g 3D2A1b 3D2C1g 3C2F7c 3D2A2c 3D2C1e 3C2F7d 3D2C1d3D2C1c 3D2A1a 3C2F7c 3D2A1f 3D2C1b 3C2C6b
3C2D3d
3D2C1a
Fig: 2 Watershed Map of Manipur 4.4
Soil Types
The soil of the state is of two major types – residual and transported, which cover both the hill and plain of the State. The residual soils are either laterized or non-laterized. The laterized red soils covering an area of 2,500 sq. km. in the Barak drainage on the Western slope of Manipur. It contains rich portion of nitrogen and phosphate, a medium acidity and lesser amount of Potash. The old alluvial is brought down by river Barak basin and Jiri river and their tributaries from their lateritic water shed hills. The compact and less permeable soils contain higher quantity of potash, fair amount of nitrogen and phosphorus with medium acidity. The transported soils are of two types – alluvial and organic. The alluvial soils cover 1600 sq. km. in the valley. These soils have general clayey loam texture and grey to pale brown colour. They contain a good proportion of potash and phosphate, a fair quantity of nitrogen
and organic matter and are less acidic. The organic soils cover the low lying areas of the valley. With dark grey colour and clayey loam texture, these peaty soils have high acidity, abundance of organic matter, a good amount of nitrogen and phosphorus but are poor in potash. The hill soils are more or less rich in organic carbon ( 1 to 3% ) in the top soil, but poor in available phosphorus and potash. They are acidic in nature. 4.5
Socio-economic Profile
Natural resources form the base of economy of Manipur. Forests account for 77% of the total geographical area of the state. Agriculture forms the single largest source of livelihood and is the mainstay of the state's economy. Farming systems in Manipur can be broadly categorized into shifting cultivation or jhum (Paamlou in Manipuri language) practised in the hills and a more settled form of agriculture in the valley region. The natural resource base of the state provides livelihood security to the entire region as well as employment to 68% of the working population. The rugged topography of the hilly regions of the state covered with forests and consequent lack of agriculture opportunities have made Manipur valley as hub of the economic activity of the state. The population of the state is around 26 lakhs now (2007) based on population figure of Census 2001. Of this, 76% and 24% are urban and rural population respectively. The occupation of the people is very interesting. There are main workers (30%), marginal workers (13%) and Non-workers (57%). Among the Main workers, valley people constitute 61% and the rest 39% by hill people. Among the marginal workers, valley people constitute 70% and hill people 30%. Among the non-workers, valley people constitute 66% and hill people constitute 34%. Among the main workers, cultivators account for 43.5%; agricultural labour 6.5%. Manufacturing, Processing, Servicing, Repairing in Household Industry account for 7% and other services account for 43% of the main workers. Paddy is the main crop. There are other Kharif and Rabi crops too. Some peculiar features prevailing in the hill districts of Manipur State The hill districts of the state have no well – defined, strictly, efficiently and uniformly enforceable acts/laws with regard to property rights. In the hills, the property rights system is governed by traditional unwritten laws and conventions. The hill areas are mainly occupied by the different ethnic groups. Among the ethnic groups Nagas are prominent and among them Naga the community ownership is accepted. The entire Naga village is said to have belonged by tradition to the Village – Chief. However, the individuals are permitted to operate with inalienable rights. The land – use pattern of the Nagas has certain clear-cut-divisions. First, they have house-sites. The house-sites by and large permanently belong to them. Second, surrounding the house-sites there is protected area where no felling of trees is allowed. This protected area serves as a defensive well against fire and other attacks. Third, beyond this protected area, there is cultivated land. Another ethnic group the Kukis have land under the ownership of the Chief only. He is by tradition, the sole authority over the use of land. The lands are however, made available to the individual members for agricultural purposes for a particular period of time. The new phenomenon causing concern is the rising population of landless families. Besides, investment in land for improvement in both cases is not made in the absence of inspiring urge of individual ownership.
The land in the hills are not cadastrally surveyed as it is not under the purview of the Manipur Land Records and Land Revenue Act 1960. Though historical records of jhum cultivation exist, sometime, villagers encroached on protected forestland for jhum cultivation destroying the forest. In most of the villages, the lands belong to the community. The Jhum period is reduced to 3-4 years, which results in mass conversion of hilly slopes into barren land. The people in the hilly terrain have been accused now and again for jhum practices, which has a negative role in the environment. They depend entirely on jhum cultivation just like farmers are dependent on their farm lands or agriculture fields. There are very few alternatives for a person living in this terrain for their source of livelihood. Transport bottlenecks and lack of proper market have doubled their miseries. This hill terrain has high potential for plantation of citrus fruits, tea and coffee plantation etc. But due to lack of proper market, storage and roads it could not fetch proper market value. 5.
FOREST STATUS OF MANIPUR
The state is quite rich in forest resources. The forests are the home to a rich variety/ multitude of flora and fauna. Because of different climate, soil conditions, altitudinal variations, Manipur supports unique vegetation and is one of the Biodiversity Hotspots in the world. The following Tables give an idea about the status of forests in the state:Forest classification as per Recorded Forest Area (Legal Status) Sl.N o. 1. 2. 3.
Legal status of Forests as per 2005 Forest Survey of India Report Reserved Forest Protected Forest Unclassed Forest Total
Area in Sq. Km. 1467 4171 11,780 17,418
Percent of Total Forest Area 08.42 23.95 67.63 100.00
Broad Forest Types Sl.No.
Broad Forest Types
1. 2. 3. 4. 5. 6. 7.
Montane Wet Temperate Forests Sub Tropical Pine Forests Sub Tropical Wet Hill Forests Tropical Semi Evergreen Forests Tropical Deciduous Forests Bamboo brakes Others Total
Approx. % to Total Forest Area 8.23 13.86 51.40 3.67 3.48 18.55 0.81 100.00 (Source: FSI Report 2005)
(Source: FSI Report)
Flora:As per the records of Manipur Forest Department the flora of the state is quite rich and represented by species of Indo-Malayan realm. Many of them are endemic like the Siroy lily (Lilium macklinae), Arisaema wattii, Actinodaphne obovata, Begonia obversa, Berberis manipurana, Carex manipurensis, Euphorbia serrulata, Hedychium greenii, Ilex wattii, Impatiens longirama, Iris bakeri, Justicia anfractuosa, Mahonia feddei, Musa itinerans, Pilea miunuta, Piper makruense, Strychnos nux-blanda, Zanthoxylum pseudoxyphyllum, etc. Important tree species include Gmelina arborea, Dipterocarpus tuberculatus, Dipterocarpus turbinatus, Tectona grandis, Melanorrhoea usitata, Terminalia chebula, T. myriocarpa, Emblica officinalis, Toona ciliata, Cedrella serrata, Quercus spp., Bauhinea Spp., Pinus kesiya, Quercus serrata, Castanopsis spp., Acer oblongum, Alnus nepalensis, Cinamomum spp., Engelhardtia spicata, Cassia fistula, Erythrina orientalis, Lithocarpus dealbata, Myrica esculenta, Persea odoratissima, Quercus griffithii, Schima wallichii, Symplocos spp., Rhus semialata, Alstonia scholaris, Bombax ceiba, Neolamarckia cadamba(Anthocephalus cadamba), Callicarpa arborea, Macaranga peltata, Albizzia lebbeck, Podocarpus nerrifolia,etc. There are of course exotic species like the Eucalyptus, Lantana camara, Eichhornia crassipes, Mikania micrantha, Acacia auriculiformis, etc. Some of the species like Tree Fern (Cyathea spp.), Taxus baccata, Aquilaria agalocha,etc. are in the CITES list of endangered species. Climbers are represented by Clematis grouriana, Entada scandens, Mikania micrantha, Smilax spp. Bauhinia Spp., Abrus precatorius, Dioscorea deltoids, etc. Among the epiphytes and grasses, important ones are Platycerium spp., Eragrostis uniboloides, Imperata cylindrica, Phragmites karka, Saccharum spontaneum, Thedema villosa, Thysalonea maxima, etc.
There are 14 Genera and 54 species of Bamboo in the state. Bamboos grow along the banks of rivers and nullah in the valley area and in many parts of the hill districts particularly the forest areas Tamenglong, Churachandpur, Jiribam, Tengnoupal Forest Divisions. Important species belong to the genera of Bambusa, Melocanna, Dendrocalamus, Oxytenanthera, Phyllostachys, Cephalostachyum, etc. Bamboo brakes occur as secondary succession in forest areas where jhuming had been done. Cane species are represented by Calamus arborescens, C. erectus, C. latifolius, C. tenuis and C. garuba. Manipur has also about 450 species of Orchids. Among the endemic species, mention may be made of the Ascocentrum ampullaceum var. auranticum, Schoenochis manipurensis. A few endangered orchid species viz. Blue Vandal (Vanda coerulea), Red Vanda (Renanthera imschootiana) and Ladies Slipper (Paphiopedilum sp.) have been included in the ScheduleVI of the Wildlife (Protection) Act,1972 for their strict protection under the law. There is Orchid Preservation Plot near Imphal where Ex-situ conservation efforts are in full swing under the Forest Department, Manipur. Aquatic flora is represented by Zizania latifolia (Ishing Kambong),Saccharum munja (Khoimom), Saccharum bengalensis, Erianthus procerus (Singang),Dioschoria bulbifera (Phum), Cynodon dactylon (Tingthou), Alpinia galanga (Pullei), Eichhornia crassipes (Kabokang), Hedychium coronarium (Loklei), Nelumbo nucifera (Thambal), Phragmites karka (Tou) and 100 other spp. Many of the floral species of the state have got their medicinal values. Fauna:Besides a lot of species of Amphibians and fishes, the faunal population of the state is represented by reptilian, avian and mammalian species. Among the reptiles, mention may be made of Indian Python, Kraits, Cobra, Viper, Water monitor Lizards, Salamander, etc. Important birds include Mrs Humes Bar-tailed Pheasant, Blyth’s Tragopan, Hornbills, Peacock Pheasants, Quails, Drongos, migratory and resident water fowls,etc. Mammals are represented by the world famous Brow antlered deer, Cervus eldi eldi, which is endemic in Manipur, Serow (Capricornis sumatraensis), Sambhar, Hoolock gibbons, Macaques, leopards, leopard cats, Himalayan Black bear, Pangolin, Hog Badger, Barking Deer, Hog Deer, Slow loris,Civet cats, jackals, jungle cats, etc are also found in Manipur. (Source: Manipur Forest Dept. ) 5.1
Different issues regarding Manipur forests
a) Management challenges •
There is very high biotic interference in all forest areas stretching their carrying capacity sometimes beyond redemption. The biotic factors that cause maximum damage to the forests in the state are man, domesticated animals, semi-domesticated animals, wild animals like bears, rodents, etc. Damage to the forests by wild animals may, however, be said to be negligible considering the role they play in the eco-system.
•
Non-judicious use of forest resources by unscrupulous people is still prevalent.
•
Due to inadequacy in delivering the goods to the people by other related sectors of rural development, there is tremendous pressure on to the forests.
•
Lack of integrated approach by various concerned departments and communication gap among planners, policy makers, field functionaries in Forestry and allied activities towards the conservation of forests are also very tough challenge to foresters.
•
Enjoying of traditional or customary rights and privileges by the tribal who have little responsibility for upkeep of forests is another challenge.
•
Another challenge is inadequate financial inputs in the Forestry sector over the years. Forestry has not been receiving the attention it really deserves in terms of sectoral outlay and financial allocation.
•
Lack of institutional support to communities is also another challenge.
b) Deforestation and Forest Degradation Deforestation Deforestation is usually defined as the loss of forest. It is defined as converting forests to another land use or the long-term (more than 10 years) reduction of tree-canopy cover below the 10 percent threshold. Depending on how it is estimated, over 15 million ha of natural forest are lost in the tropics every year. To put this in proportion, total global forest cover is 3870 million ha, or 30 percent of the earth's land area; tropical and subtropical forests represent 56 percent of this total or 2167 million ha. The trees may be cut for their wood or pulp, to clear the land for agriculture or ranching, for housing, mining and other development. If an area of forest is cleared and houses are built on it, this land is obviously deforested and the forest is lost. If local people clear the trees and grow crops on the land for a few years and then move on that cleared area is also deforested, because it has come under agricultural use. However, if the same area is logged by clear felling but the logging company intends to replant it with trees, this is not considered deforestation. This leads to the odd situation of having a forest without trees. Foresters and Environmentalists are concerned about permanent deforestation, while temporary clearing may be acceptable. Nevertheless, temporary clearing is a very significant activity. Forest clearing tends to follow a pattern. Shifting agriculture creates islands of cleared forest, as does mining, but on a much larger scale. When a road is cut through a jungle or a forest, for whatever reason, people arrive in the new areas that are opened up and may start clearing land for agriculture or logging (legally or illegally) along the corridor the road creates. Resettlement schemes usually branch out from a road. All these uses can overlap and change with time so it is impossible to predict what will happen to a particular area of cleared forest 10 years in the future. Forest degradation Deforestation is widely seen to be one of the key environmental concerns in Manipur. The hilly region of the state has experienced a particularly high level of deforestation in recent decades. The impacts of deforestation are multifarious and affect different environments and social groups in different places in different ways. Similarly, there are complex and numerous causes of deforestation, and these causes are contested by natural and social scientists alike. There are many ways to explain deforestation. In some cases, an instrumental approach examines the proximate causes of deforestation in the form of logging, land settlement, cash cropping, new technologies or forest management practices.
In other cases, a structural approach tries to search for underlying or ultimate causes of deforestation. In fact, it is often difficult to disentangle proximate and ultimate cause. There are also many modes of explanation for deforestation. These modes are overlapping, but they also have discrete aspects. One mode employed to explain deforestation is a listing of various factors and an attempt to develop quantitative analyses of the extent to which particular factors contribute to forest loss. Such attempts (Brown & Pearce, 1994; Rudel, 1998) usually involve regression analysis based on local area data, such as provincial statistics, on forest loss and other indicators that are hypothesized to relate to deforestation. Such a mode can be used at more than one level of causal proximity or distance. A second mode of explanation is structural analysis that examines the interests in forest, forest land and conservation values among different social, corporate and political players. This mode usually involves analytical connection of ultimate with proximate causation. A third mode of explaining deforestation is through historical analysis of changing forest and forest land uses. Such an analysis can be at one or more scales, from local (eg Hirsch, 1988) through national (eg Hirsch, 1987) to global (eg Mather & Needle, 1998). A fourth mode is also historical, but focuses more on issues of resource control and forests as arenas in which relations between peasants and the state are played out (eg Peluso, 1992). The historical modes of explanation tend to be more holistic. In the various debates over deforestation, these different modes often seem to talk past, rather than to, each other. The state has suffered a heavy degree of forest loss over the past several decades. The reasons for deforestation in the four hill districts are varied and complex. One way to examine deforestation in comparative context in such a large and diverse region is to focus on the relationship between deforestation and development. Apart from deforestation, there are many other human interventions in forests that drastically change the structure or canopy cover. These processes degrade forest but do not convert it. The forest remains in some form. Though this degradation does not necessarily cause the loss of forest cover, it is frequently the first step in a chain of events that can lead to permanent deforestation. Selective logging, extracting timber that does not involve clear felling, is the prime cause of forest degradation. Although this type of logging normally does not reduce canopy cover to less than 10 percent, it can easily reduce the tree cover by more than half. Depending on the ecological sensitivity of the area, the impact can be severe. Vegetation, soils and animal populations can all be negatively affected by logging. Historically, shifting agriculture did not have a major effect on forest quality, but when it becomes more widespread, or the recovery time under fallow is too short, then the area can begin to degrade. Forest fires, fuelled by dry debris from logging or slash-and-burn practices may also be damaging like extracting too many non-timber forest products and over-hunting. Over-harvesting a single species, may, for instance, reduce the population of a key pollinator or seed-dispersal species. Taking out too much firewood and seasonal livestock overgrazing can badly affect dry forests. The various causes of deforestation and degradation are shown below: Causes of deforestation
Causes of degradation
Urban/residential area expansion
Selective logging
Forest conversion for permanent pasture
Over-grazing
Forest conversion for permanent agriculture
NTFP over-extraction (e.g. medicinal plants)
Shifting cultivation (intensive)
Shifting cultivation (small-scale, extensive)
Causes of deforestation
Causes of degradation
Open-pit mining
Small-scale clearing for artisan mining
Clear-cutting for charcoal making
Recurrent forest fires
Infrastructure expansion (roads network)
Over-hunting
Dam construction floods forested areas
Deterioration of regeneration processes
Factors driving deforestation and degradation Humans have used the forest in socially acceptable ways for millennia. They have cut down timber to construct the infrastructure of civilizations and they have taken wood from forests for fuel. In many parts of the tropics, farmers have practiced shifting cultivation for generations. With the usual long fallow periods, shifting cultivation treats the land in a sustainable way. That is, it recycles nutrients, conserves the forest, the soil and water, and encourages diversification of crops. But the traditional system is being rapidly replaced by shortened fallow periods in which the forest does not regenerate, the land has little or no chance to recover, fertility declines, weeds take over and the soil erodes. The forces behind this change are familiar: logging, population growth, the arrival of migrants who do not follow sustainable land-use practices and the need to produce crop after crop in order to remain financially secure. Forest fire Every year particularly during the dry season, large tracts of forest areas are set to fire in an uncontrolled manner and unmindful of the harmful effects of fire. Potentially good forest areas are reduced to scrubby conditions on account of repeated fires. It is also no uncommon sight to come across forest fires lit up for the purposes of hunting of wild animals, clearing of vegetation for cultivation, protecting homesteads/village area from devastating fire and allowing grasses to come up for the cattle to freely graze. Almost all the villagers are apparently ignorant and unmindful about the harmful effects of uncontrolled forest fires and the resulting lower biomass production capacity of the forest. Parts of Pine growing areas of the state also suffer from the scourge of forest fire. Young regenerated areas are not free from fire damage and as a result, there is retardation in the growth of the regenerated seedlings and the burnt portions of the growing wood are susceptible to diseases, insect attacks and other infections from fungus. 5.2
Jhum (Shifting) Cultivation
Status of shifting cultivation in NE India Over three decades ago, P. D. Stracey (Borah and Goswami 1973) listed a number of problems caused by slash-and-burn shifting cultivation or jhum as commonly practiced by indigenous tribes in North East India. This ‘primitive’ form of agriculture, according to him, resulted in serious environmental problems: loss of forest cover, erosion of topsoil, desertification, and declines in forest productivity. Others have also decried jhum as an inefficient form of agriculture, an impediment to progress of forestry, and an agent of destruction of biodiversity (Borah and Goswami 1973). Such beliefs have been widespread since British times, and have even resulted in forcible suppression of the practice, oppression and relocation of tribals in Central India and other hill regions. In contrast, studies by ethnologists have tended to view shifting cultivation favorably. It is considered a diversified system, well adapted to local conditions in moist forest and hilly tracts (Conklin 1969). Others have argued that traditional shifting cultivation may not be as destructive as
modern forest exploitation for timber. Clearance of small patches of forest with long fallow periods may even enhance biodiversity in the landscape due to the creation of a variety of habitats (Gadgil 1992). Amidst such contrasting views, there is a clear need for reliable empirical and scientific data on the nature and ecological impact of jhum. Shifting cultivation, variously known as rotational bush-fallow agriculture, shifting cultivation, or slash-and-burn cultivation, is an ancient form of agriculture still commonly practiced in many parts of the humid tropics. Within India, shifting agriculture or jhum is practiced predominantly in the hill tracts of eastern and North Eastern India. At least 100 different indigenous tribes and over 620,000 families in the seven states of North East India depend on jhum for their subsistence (Raman 1996). Although the pattern and details of shifting cultivation differ in different places and tribes, there are broad similarities. Jhum cultivation usually involves cutting of second-growth bamboo forests. Since old growth or primary forest is less extensively available and is more difficult to clear, they are cultivated infrequently. The clearing work usually begins in January-February. The slashed vegetation is allowed to dry on the hill slopes for 1-2 months prior to burning in March-April. Crops are sown with the first rains in April in plots that are 14 ha in area. Usually, inter-cropping of one or more paddy varieties with 15-20 other crops (vegetables, maize, chillies, gourds, cotton, arum, and mustard) is carried out. The economics and efficiency of shifting agriculture has been studied in Meghalaya and other states of North East India by a team of scientists led by P.S. Ramakrishanan (1992). These studies showed that, far from being primitive and inefficient, jhum is an indigenous system of organic multiple cropping well suited to the heavy rainfall areas of the hill tracts. This is mainly because terrace and valley cultivation needs expensive external input such as fertilizers (which often get leached or lost in the heavy rainfall hill slopes) and pesticides, besides labour for terracing. Monetary output-input ratios (rupees/ha/year) range from about 1.8 for jhum cycles of 5-10 years to 2.1 for a 20-year jhum cycle. This is higher than the values for settled terrace cultivation (1.43) and valley cultivation (40% canopy cover) and open (