National Environmental, Economic and Development Study (NEEDS) for Climate Change
NATIONAL ENVIRONMENTAL, ECONOMIC AND DEVELOPMENT STUDY (NEEDS) FOR CLIMATE CHANGE
Submitted by:
REECS
Resources, Environment and Economics Center for Studies, Inc. March 18, 2010
Resources, Environment and Economics Center for Studies, Inc. (REECS)
Page i
CONTENTS Contents.................................................................................................................................................. ii List of Tables .......................................................................................................................................... iv List of Figures .......................................................................................................................................... v Acronyms Used ...................................................................................................................................... vi Executive Summary ................................................................................................................................. x Overview................................................................................................................................................. 1 Current Status of GHG Emissions.......................................................................................................... 3 Climate Change Projections ................................................................................................................. 4 Vulnerability Assessments and Scenarios ............................................................................................. 5 Baseline Scenario ............................................................................................................................. 6 Socio-Economic Projections.............................................................................................................. 6 Sectoral Vulnerabilities to Climate Change........................................................................................ 7 Costs of Implementing Priority Mitigation and Adaptation Measures ...................................................... 9 Reducing GHG Emissions...................................................................................................................... 9 Reference Scenario......................................................................................................................... 10 Maximum RE Scenario.................................................................................................................... 11 Nuclear Scenario ............................................................................................................................ 11 Climate Change Mitigation Scenario ............................................................................................... 12 Adapting to Climate Change............................................................................................................... 14 Adaptation Measures ..................................................................................................................... 14 Findings: State of Adaptation Strategy............................................................................................ 26 Financial and Policy Instruments for Addressing Climate Change ........................................................... 28 Existing Financial Instruments ............................................................................................................ 28 On External Grants ......................................................................................................................... 29 On External Loans........................................................................................................................... 31 External Grants and Loans Indirectly Related to CC A&M ................................................................ 31 Use of funds ................................................................................................................................... 33 Resources, Environment and Economics Center for Studies, Inc. (REECS)
Page ii
Potential Financial Instruments.......................................................................................................... 40 Foreign Financing ........................................................................................................................... 40 Settlement of Climate Debt ............................................................................................................ 42 Local Financing ............................................................................................................................... 42 Policy Instruments ............................................................................................................................. 44 Policies Addressing Mitigation........................................................................................................ 44 Policies Addressing Adaptation....................................................................................................... 44 Institutional framework......................................................................................................................... 46 Lessons learned..................................................................................................................................... 48 Works Cited........................................................................................................................................... 50 Appendix 1: List of ODA Projects Addressing Climate Change ................................................................ 54 Appendix 2: List of People Interviewed.................................................................................................. 70 Appendix 3: Validation Workshop.......................................................................................................... 71
Resources, Environment and Economics Center for Studies, Inc. (REECS)
Page iii
LIST OF TABLES Table 1 Table 2 Table 3 Table 4 Table 5 Table 6 Table 7 Table 8 Table 9 Table 10 Table 11 Table 12 Table 13 Table 14 Table 15 Table 16 Table 17 Table 18 Table 19 Table 20 Table 21 Table 22 Table 23 Table 24 Table 25
Overall 2000 GHG Emissions per Sector (in Gg CO2 –e) INC vs SNC Emissions (in Gg CO2e) Economy-Wide Projections with Climate Change, Using 4 SRES Scenarios Investment Requirements in Electricity Generation Using Reference Scenario, 2008-2030, 10% Discount Rate Investment Requirements in Electricity Generation Using Maximum RE Scenario, 20082030, 10% Discount Rate Investment Requirements in Electricity Generation Using Nuclear Scenario, 2008-2030 CCA S & T Strategies, Crops and Soils CCA S & T Strategies, Livestock and Poultry CCA S & T Strategies, Forestry Sector CCA S & T Strategies, Hydrology and Water Resources CCA S & T Strategies, Institutional and Policy Concerns Priority Policies and CC Adaptation Actions, Agriculture Sector Priority Strategies for CCA, Biodiversity Sector Key Issues and Gaps for CCA in the Infrastructure Sector Key Issues and Gaps for CCA in the Water Sector Number of ODA-funded Climate Change Related Projects, by Funding Category, 19922018 Comparative Flows of Total Direct Grants & Loans by Major Measure, by Funding Category, 1992-2018 Funds for Direct Aid/Relief for Victims of Natural Disasters by Funding Category, by Period Comparative Flows of Total Indirect Grants & Loans Loans by Major Measure, by Funding Category, 1992-2018 Total Funds for Indirect CC A & M, by Funding Category, in USD Ongoing and Proposed Grants by Impact Addressed, by Sector Number of CC-Related Projects by Scale Ongoing and Proposed Loans by Impact Addressed, by Sector Direct and Indirect Climate Change Flows over GNP (2003-2008) National Government Budget Allocations for Climate Change, in USD
Resources, Environment and Economics Center for Studies, Inc. (REECS)
Page iv
LIST OF FIGURES Figure 1 Figure 2 Figure 3
Comparative Costs of Renewable and Non-Renewable Energy Sources Direct Grants for Mitigation and Adaptation, by Funding Category, by Period Comparison of Funds for CC Related Programs, 2008
Resources, Environment and Economics Center for Studies, Inc. (REECS)
Page v
ACRONYMS USED A&M A/RCDM ABI ACC-BIO ADB AFNR ALGAS ARMM AusAid BAR ATI BCA BFO BNPP BOI BPI BSWM CAR CBFM CC CCA CDP CEP CFP CIF CLUP CO2 CRM CSIRO CSR CT CTI DA DAR DBP DECS DENR DepEd DFA DILG
Adaptation and Mitigation Afforestation/Reforestation Clean Development Mechanism Alternative Budget Initiative Adaptation to Climate Change & Conservation of Biodiversity Asian Development Bank Agriculture, Forestry and Natural Resources Asia Least Cost Greenhouse Gas Abatement Strategy Autonomous Region of Muslim Mindanao Australian Agency for International Development Bureau of Agricultural Research – Agricultural Training Institute Biodiversity Conservation Areas Barangay Forestry Organization Bataan Nuclear Power Plant Board of Incentives Bank of the Philippine Islands Bureau of Soils and Water Management Cordillera Autonomous Region Community-Based Forest Management Climate Change Climate Change Adaptation Center for Disaster Preparedness Coastal Environment Program Community Forestry Program Climate Investment Funds Comprehensive Land Use Plan Carbon Dioxide Coastal Resources Management Commonwealth Scientific and Industrial Research Organisation Corporate Social Responsibility Coral Triangle Coral Triangle Initiative Department of Agriculture Department of Agrarian Reform Development Bank of the Philippines Department of Education, Culture and Sports Department of Environmental and Natural Resources Department of Education Department of Foreign Affairs Department of Interior and Local Government
Resources, Environment and Economics Center for Studies, Inc. (REECS)
Page vi
DMAF DOE DOLE DOST DPWH DRR DRRM DTI EC EWS FDC FIP FMU FPA GDP GEF Gg GHG GHGI GNP GOCCs GTZ HDI HFA HWP IACC IAEA IEC INC IPCC IPRA ISF IWRM JICA KwH LCF LGU LLDA LUCF M&E MAC curve MASIPAG
Disaster Management Assistance Fund Department of Energy Department of Labor & Employment Department of Science & Technology Department of Public Works & Highways Disaster Risk Reduction Disaster Risk Reduction & Management Department of Trade & Industry European Commission Early Warning System Freedom from Debt Coalition Forest Investment Program Forest Management Unit Forest Production Areas Gross Domestic Product Global Environment Facility Gigagrams Greenhouse Gas Greenhouse Gas Inventory Gross National Product Government Owned & Controlled Corporations Deutsche Gesellschaft für Technische Zusammenarbeit GmbH (German society for technical cooperation) Human Development Index Hyogo Framework for Action Harvested Wood Products Inter-Agency Committee on Climate Change International Atomic Energy Agency Information, Education & Communication Initial National Communication Intergovernmental Panel on Climate Change Indigenous People’s Rights Act Integrated Social Forest Integrated Water and Resources Management Japan International Cooperation Agency Kilowatt Hour League of Corporate Foundations Local Government Unit Laguna Lake Development Authority Land Use Change and Forestry Monitoring & Evaluation Marginal Abatement Cost Curve Magsasaka at Siyentista Tungo sa Pag-unlad ng Agrikultura
Resources, Environment and Economics Center for Studies, Inc. (REECS)
Page vii
MDB MESSAGE MIROC NIES MTPDP NCSA NDCC NEDA NEEDS NGO NIA NIPAS NPP NWRB ODA PA PAGASA PAR PBSP PCAA PD PEIS PHILVOLCS PPFP PRECIS PRRM RD & E RE REDD REECS RFU RPOA S&T SAFDZ SDU SEMP SIFMP SLR SNC SRES TPES UN
Multilateral Development Banks Model for Energy Supply Strategy Alternatives and their Environmental Impacts Model for Interdisciplinary Research On Climate - National Institute for Environmental Studies Medium-Term Philippine Development Plan National Capacity Self-Assessment National Disaster Coordinating Council National Economic Development Authority National Environmental, Economic and Development Study Non-Government Organization National Irrigation Administration National Integrated Protected Areas System Nuclear Power Plant National Water Resources Board Official Development Assistance Protected Area Philippine Atmospheric, Geophysical and Astronomical Services Philippine Area of Responsibility Philippine Business for Social Progress Philippine Clean Air Act Presidential Decree Philippine Environmental Impact Statement Philippine Institute of Volcanology & Seismology Provincial Physical Framework Plan Providing Regional Climates for Impacts Studies Philippine Rural Reconstruction Movement Research Development & Evaluation Renewable Energy Reducing Emissions from Deforestation and Degradation Resources, Environment and Economics Center for Studies, Inc. Regional Field Units Regional Plan of Action Science & Technology Strategic Agriculture and Fisheries Development Zone Social Development Unit Sustainable Environmental Management Project Socialized Industrial Forest Management Program Sea Level Rise Second National Communication Special Report on Emissions Scenarios Total Primary Energy Supply United Nations
Resources, Environment and Economics Center for Studies, Inc. (REECS)
Page viii
UNFCCC WB WPA
United Nations Framework Convention on Climate Change World Bank Watershed Protection Areas
Resources, Environment and Economics Center for Studies, Inc. (REECS)
Page ix
EXECUTIVE SUMMARY The NEEDS for Climate Change study in the Philippines assesses the country’s existing legal policy framework for addressing CC, and discusses its efforts in vulnerability and adaptation assessments and the implementation of mitigation and adaptation measures. The study also assesses the country’s financing needs and constraints to implement mitigation and adaptation measures at the national, sector and local levels. These study objectives entail the following: 1) an evaluation of existing laws, policies and programs to address climate change; 2) a documentation and critique of existing vulnerability and adaptation assessments; 3) analysis of the available internal and external financial resources, their adequacy for the implementation of mitigation and adaptation measures, and the prospects for generating more resources; and 4) discussion of the other constraints to implementing a national strategy for effective adaptation. With respect to existing legal-policy framework, the country does not lack the necessary laws that aim to address CC and provide both CC mitigation and adaptation measures. The Climate Change Act of 2009 already provides a comprehensive law that addresses climate change, and it complements a number of laws and programs. These are being implemented either as mitigation or adaptation measures on the ground, and thereby gradually mainstreaming CC actions in some sectors and local sites. The Second National Communication (SNC) on Climate Change provides the latest inventory of GHG emissions, together with a comprehensive vulnerability and adaptation assessment of some economic sectors. The inventory of GHG identifies the priority sectors for mitigation, while the DOE addresses these priority sectors, like energy and waste in its present mitigation programs. The DOE’s preferred option for the reference scenario rests on its least-cost feature and contribution to reduction to GHG emissions. Technical and financial assistance is however necessary to establish the cost viability of alternative biomass and wind energy. With regards to the object of overall emissions reduction, the possible underestimation or overestimation of the LUCF sector’s net sequestration capacity baseline needs to be resolved in order to establish and justify the country’s urgent need for Reducing Emissions from Deforestation and Degradation (REDD). And with regards to the waste sector, the extent to which multilateral or bilateral projects for CC and the environment sector have addressed the GHG emissions from the sector must be assessed. With regards to the availability of external financial resources, the flows for CCA and mitigation have been limited because of the following reasons. One, greater amounts of total grants and loans over the entire period (1992-2019) have flowed to projects indirectly related to climate change adaptation and mitigation compared to projects directly related to climate change action. This differential flow suggests that the country’s donors and creditors apparently prefer such projects than those that are directly related to CCA and mitigation. Moreover, while most of the indirect grant flows and loan funds have gone to indirectly-related adaptation projects, the fund sources tend to prefer differing funding mechanism. Bilateral donors and the GEF, for instance, have given more grants than loans, while multilaterals prefer to lend than give grants. Two, the direct loans and grants of multilaterals and bilaterals flow to broad sectors that address only a particular CC impact or the problem it may aggravate. In other words, not all the significant impacts of CC may be addressed, with effective amounts. Moreover, given the limited flows for a particular sector, project scale or its limited spatial coverage is restricted. Resources, Environment and Economics Center for Studies, Inc. (REECS)
Page x
Three, the scale of direct loan projects are more restricted compared to the scale of direct grant projects, thereby suggesting the creditor’s assessment of the limited capacity to pay of the local or national government. The country’s limited borrowing capacity thus implies that the needed funds for CCA would have to come more from external multilateral, bilateral grants, and GEF, apart from local financial resources. Four, the bilateral flows from particular country donors have been inadequate for meeting their climate financing commitments. Over the period 2001 to 2007, the available ODA data for the United States, Australia, Japan, and Germany show that they have not been able to meet the minimum 0.5 to 1% of GNP or the estimated required amount of resources to support adaptation, mitigation and technology transfer. Five, the low involvement of the GEF in grant provision prior to 2004 and its subsequent lower grant flows compared to the bilateral and multilateral donations imply that the latter donors have more greatly influenced the direction of climate change adaptation work in the country compared to the GEF. The limited funds from the UNFCCC delivery vehicles suggest that the criteria of predictability and adequacy of financing required under the Convention from the developed countries cannot immediately be ascertained. External flows from both bilateral and multilateral sources for direct and indirect climate change adaptation and mitigation, moreover, are limited when compared to the budgetary appropriations by the national government for climate change. Over the period from 2004 – 2008, the Philippine government appropriated greater budgetary resources for related climate change programs in various sectors than grants and loans of multilateral and bilateral sources. The budgetary resources set aside by the Philippine government for climate change, however, may need to be increased to make a significant dent. They amount to only 0.9 to 1.9% of the country’s total budget, and on particular years, the share has even dropped. Agriculture is one sector severely affected over the period. The increase in the budgetary share of disaster management, while commendable may not sufficiently represent proactive efforts to mitigate the expected damages and risks from natural disasters. Moreover, the budgetary appropriations do not include particular priority actions that would climate-proof critical socio-economic activities, and shield the most vulnerable/ poor groups from current and future climate risks. Lastly, the budget appropriations may be improved to include the strategic activities for promoting sustainable development and meeting the requirements for CCA. In accounting for the costs of CCA and mitigation in the country and setting the national adaptation strategy and the priority measures, an initial listing of priority measures must be systematized and compared with activities that are already in place and being funded by external, governmental or local financial sources. This comparative exercise would indicate which activities or requirements are being undertaken but are inadequately funded, on one hand, and those that have not been implemented or hardly funded, on the other. Existing project expenditures for particular activities may in turn provide an estimate of the cost of increasing the scope or coverage, or scaling-up a potential priority measure. Potential funds may be drawn at the global level from new commitments, potential international levies on airfares or capital transfers from Annex 1 countries. At the national level, government may also enunciate public finance measures to generate funds for CCA, like a commitment of 0.5% to 1% of GDP as a challenge to bilateral donors among the Annex 1 countries. And it may also set levies on GHG Resources, Environment and Economics Center for Studies, Inc. (REECS)
Page xi
emitters, road and port users, airline and shipping services. These revenue-generating actions at the national level would also require the establishment of a General Fund for CCA and mitigation. With adequate funding resources from external sources, and the capacity of the national government to generate internal resources through various financial instruments and to obtain access to additional external financial resources, the work of the Climate Change Commission and the initiative of various public and private agencies can be supported. The low capacity levels of the regulatory and oversight agencies, including some implementing agencies, however, must be raised to support the work of the Commission, as it carries out its functions to formulate and implement a national adaptation strategy, mainstream climate risk reduction into national, sector and local development plans and programs, recommend policies and key development investments in climate-sensitive sectors, and undertake the work of vulnerability assessments and capacity building.
Resources, Environment and Economics Center for Studies, Inc. (REECS)
Page xii
NATIONAL ENVIRONMENTAL, ECONOMIC AND DEVELOPMENT STUDY (NEEDS) FOR CLIMATE CHANGE OVERVIEW The manifestations of climate change (CC), in the form of rising temperature, variability of precipitation, frequency and intensity of typhoons, sea level rise, and the risks of more droughts, floods, heat waves, and forest and grassland fires have impacts on the economy, environment and communities. Given its geographical location, archipelagic formation in the tropical Pacific, and population distribution, the Philippines is greatly vulnerable to the impacts of climate change, and has already experienced noticeable adverse effects in recent years. Without concerted global and local action, the challenges the country will face as a result of CC are expected to intensify in the medium or long term. In response to the adverse impacts and risks posed by CC on major sectors and locations, such as agriculture and fishery, water supply, food security, human health, forest and coastal ecosystems and resources, biodiversity, and infrastructure, the National Economic and Environmental Development Study (NEEDS) for Climate Change seeks to provide an assessment of the financing needs of State parties to implement mitigation and adaptation measures at the national and sector level. There have already been some initiatives to address climate change and its adverse impacts and risks on the economy, environment, and population. As early as May 1991, the Inter-Agency Committee on Climate Change (IACCC), comprising of 15 national agencies and non-governmental organizations, provided technical support on matters concerning climate change, like ways to mitigate or limit greenhouse gas (GHG) emissions. With the inception of the Initial Communication to the UN Framework Convention on Climate Change (UNFCC) in 1999 the government also began its review of mitigation strategies, and has incorporated mitigation measures in the Medium Term Philippine Development Plan and various sector plans. The latest version of the Medium Term Philippine Development Plan (MTPDP) for 2004-2010 mentions the climate change adaptation and mitigation measures in various areas, like agribusiness, science and technology, and foreign policy. It further recognizes the crucial role of the environment and natural resources sector in reducing climate change impacts and local efforts to adapt to current climate variability, particularly in strengthening policies and programs in forestry management, pollution and hazard control, energy independence and in protected areas and wildlife management. The Philippine government has also passed executive orders and laws, reflecting its commitment to both GHG emissions reduction and sustainable development, such as the Philippine Clean Air Act (PCAA) of 1999, PD 1442 or the Act to promote the Exploration and Development of Geothermal Resources, Electrical Power Industry Reform Act of 2001, the Investment Priorities Act (2001), Biofuels Act of 2007, and the Renewable Energy (RE) Act of 2008. The PCAA mandates the DENR to prepare and implement national plans that are in accordance with the UNFCCC and other international agreements, conventions and protocols on reducing GHG emissions. It also mandates the DENR not only to monitor meteorological factors affecting ozone depletion and GHGs but also to set standards. The Biofuels Act seeks to reduce GHG emissions by mandating the blend of biofuels on diesel and gasoline sold in the country, while the RE Act of 2008 aims to accelerate the exploration and development of renewable energy sources, such as biomass, solar, wind, hydro, geothermal, ocean energy and hybrid systems.
Resources, Environment and Economics Center for Studies, Inc. (REECS)
Page 1
Even before the formal adoption of a Climate Change Act (October 2009), national and regional development planning has slowly mainstreamed climate change into some sector and spatial components. Capacity assessment of some national and local government units has also been undertaken. Noteworthy are three projects that address such objectives. First, a European Union project entitled “Mainstreaming Disaster Risk Management in Sub-national Development and Physical Planning in the Philippines is being implemented by the National Economic and Development Authority (NEDA). Long-term physical framework plans are being updated to introduce natural risk hazard analysis in regional planning, identify areas at risk to natural hazards, ensure proper siting of development, and identify appropriate mitigation measures. Second, an AUSAID project implemented by NEDA seeks to integrate disaster risk reduction and climate change adaptation (DRR/CCA) into local development planning and decision making processes. Finally, at the national level NEDA is also implementing a threeyear project to mainstream climate risk reduction into national development plans and processes by enhancing national and local capacity to develop, manage and administer plans, programs and projects addressing CC risks. With the finalization of the Second National Communication (SNC) on Climate Change, the latest inventory of greenhouse gas emissions would be available, together with a comprehensive vulnerability and adaptation assessment of the country’s economic sectors. Through all these initiatives, the government has begun to address the challenges posed by CC. The recently approved Climate Change Act caps its formal response. The law provides a policy framework; it establishes an organizational administrative structure, the Climate Change Commission, and allocates budgetary resources for its important functions. These functions include the formulation of a framework strategy and program, the mainstreaming of climate risk reduction into national, sector and local development plans and programs, the recommendations of policies and key development investments in climate-sensitive sectors, and undertaking the work of vulnerability assessments and capacity building. All past efforts and existing initiatives will help substantiate the components of the country’s framework strategy and program for CC. The work of the Commission and the initiative of various public and private agencies, however, need to be supported and sustained with adequate funding resources from both internal and external sources. The opportunities and extent by which the government can strategically promote and finance priority mitigation and adaptation measures depend on its capacity to generate internal resources through various financial instruments and to obtain access to additional external financial resources. What are the existing and available internal and external financial resources is thus a relevant empirical question in monitoring current national and global efforts to address CC. What are the prospects and conditions for generating more resources must be resolved at the national and global level. At the global level, State Parties attending the Bali Conference in 2007 agreed to formalize an international response to CC in Copenhagen. In turn, the secretariat of the UN Framework Convention on Climate Change (UNFCCC) launched the National Economic and Environmental Development Study (NEEDS) project1. As a strategic action to complement national initiatives, the project provides an opportunity to document and assess the adequacy or limitations of the existing flow of funds for financing mitigation and adaptation measures. Given its broader perspective on the emerging financial needs of climate change and the knowledge of available strategic external funding opportunities, the project further enables developing countries to determine the costs of both mitigation of greenhouse 1
The NEEDS for Climate Change project is piloted in nine countries: Costa Rica, Egypt, Ghana, Indonesia, Lebanon, Mali, Nigeria, Pakistan and the Philippines.
Resources, Environment and Economics Center for Studies, Inc. (REECS)
Page 2
gas emissions and adaptation to CC impacts, and thereby identify in general the priority funding requirements or the unmet required actions to achieve mitigation and adaptation objectives. The options the government has considered in mitigating GHG emissions and their cost are discussed in the next section. It also discusses the highlights of the SNC in order to set the stage for the discussion on mitigation and adaptation measures and financial and policy instruments for addressing climate change.
CURRENT STATUS OF GHG EMISSIONS 2 In compliance with the submission of the country’s National Communications to the United Nations Framework Convention on Climate Change (UNFCCC), two national inventories of greenhouse gas emissions (GHGI) have been conducted, one in 2000 and the second in 2009. The inventory covers five (5) key sectors that contribute to the increasing amount of greenhouse gases in the atmosphere, namely Agriculture, Energy, Land Use Change and Forestry (LUCF), Industry, and Waste, using the 1996 IPCC guidelines in accounting for the emissions from these sectors. With 1994 as the baseline year for the first inventory, the Philippines Initial National Communication (INC) to the UNFCCC Secretariat reported that the country emitted approximately 100,865 kt of CO2 equivalent or gigagrams CO2e from the four non-LUCF sectors. The Energy sector was the most significant sector accounting for 49% of total emissions, followed closely by the Agriculture sector with 33%, and Industry and Waste respectively with 11% and 7%. With year 2000 as the baseline, the Second National Communication (SNC) noted two main results. One, with overall emissions from non-LUCF sectors amounting to 126,878.78 Gg CO2e ( Table 1), the share of GHG emissions from the four non-LUCF sectors, in comparison with the first inventory, specifically Energy and Waste sectors, has increased respectively to 55% and 9% while the share of Agriculture and Industry declined respectively to 29% and 7%. This finding suggests that Energy and Waste are the two priority sectors for mitigation. Two, overall GHG emissions from the 5 sectors apparently decreased. Comparing the 1994 INC and the 2000 GHG Inventory for the SNC, the decrease in GHG emissions by as much as 81% is mainly due to the increase in the emissions sequestered by the LUCF sector (Table 2). This positive finding, however, does not suggest non-action because if the LUCF sector is not taken into account, the country’s total emissions has in fact increased by 26%, with the increased emissions from the waste sector, energy and agriculture. Moreover, the impressive increase in the net sequestration of the LUCF sector from only 126 Gg in 1994 to as much as 107,387.67 Gg CO2e needs to be verified. The extent in which the sector’s net sequestration capacity baseline is underestimated or overestimated is critical in establishing the urgency of Reducing Emissions from Deforestation and Degradation (REDD) for the country.
2
Both inventories were undertaken by the Manila Observatory. The second inventory results are in Manila Observatory, September 2009. Final Report: Philippine Greenhouse Gas Inventory for the Year 2000. Ateneo de Manila University, Loyola Heights, Quezon City, Philippines. GEF / UNDP PROJECT ID 00037339
Resources, Environment and Economics Center for Studies, Inc. (REECS)
Page 3
Table 1 Overall 2000 GHG Emissions per Sector (in Gg CO2 -e) Overall 2000 GHG Emissions Per Sector A b CO2 CH4 (in Gg) (in Gg) Sector Energy 62,499.10 304.14 Industrial 8,604.74 0.24 Processes Agricultur 1,209.79 e LUCF (106,216.99) (50.58) Waste Totals
(35,113.15)
500.67 1,954.26
C CH4 GW Potential
D N20 (in Gg)
E N20 GW Potential
F CO2e Emission in Gg A+(b*c)+(d*e) 69,667.24 8,609.78
21 21
2.52 -
310
21
37.41
310
37,002.69
21
(0.35)
310
(107,387.67)
21
3.50 43.08
310
11,599.07 19,491.11
Table 2 INC vs SNC Emissions (in Gg CO2e) Overall Result INC vs. SNC Sectors CO2e Emission in Gg (INC) Energy 50,038.00 Industrial Processes 10,603.00 Agriculture 33,130.00 LUCF (126.00) Waste 7,094.00 Totals 100,739.00
CO2e Emission in Gg (SNC) 69,667.24 8,609.78 37,002.69 (107,387.67) 11,599.07 19,491.11
Increase/ (Decrease) 19,629.24 (1,993.22) 3,872.69 (107,261.67) 4,505.07 (81,247.89)
% of increase (decrease) 39% -19% 12% 85128% 64% -81%
CLIMATE CHANGE PROJECTIONS 3 Changes in temperature and precipitation over the Philippines would indicate the potential hotspots or vulnerable areas that must be prioritized in any climate change action plan. With the use of regional climate model developed by the Hadley Center known as PRECIS, local climate changes, in terms of surface air temperature and rainfall have been projected over two time-slices of the 21st century by comparing future simulations with that of the 20th century (1971 to 2000). The model results indicate that significant warming will occur over Mindanao in the middle of the next century, with the largest warming occurring in the third quarter (June, July, August) and second quarter (March, April, May). The country-averaged annual mean temperature is projected to increase by 0.9°C -1.4°C by 2020 and 1.7°C 2.4°C by 2050. While generally higher temperatures are simulated in all regions of the country by 2050, with an average mean minimum rise in minimum temperature of about 2 ºC, the rate of temperature increase by 2050 will generally double the rate of increase simulated for 2020, with the highest seasonal increase in maximum temperature in the island of Mindanao for the 2nd and 3rd quarters. Specifically, a 3
Philippine Rural Reconstruction Movement (PRRM), October 2009. Second National Communication on Climate Change: Philippine SNC Project, Vulnerability and Adaptation Assessment Component. Quezon City, Philippines. GEF / UNDP PROJECT ID 00037339
Resources, Environment and Economics Center for Studies, Inc. (REECS)
Page 4
significant increase of 3 ºC by the 3rd quarter of 2050 will take place in CARAGA. Other parts of Mindanao will also see a notable rise in temperature in the same periods. Apart from CARAGA, the southern part of the Philippines (Regions 9,10,11,12, and ARMM) will be warmer compared to other parts of the country. The model also projected a change in annual precipitation from (-0.5 to 17.4 %) in 2020 and -2.4 to 16.4 % in 2050, with large seasonal differences in the amount of rainfall in all the seasons. Projected seasons temporal rainfall variation is less (-0.5% to 25%) during the seasons of December, January, February and September, October, November. Region wise, there will be a much stronger and more active southwest monsoon on Luzon and the Visayas, given the projected significant increases of seasonal rainfall in the third quarter. Increases in rainfall will particularly be evident in these regions while Mindanao is projected to undergo a drying trend. The highest increase in rainfall during southwest monsoon season (JJA) will likely be in Region 1 (44%), CAR (29%), Region 3 (34%), Region 4 (24%) and Region 5 (24%) in 2050. The drier seasons of March-April-May will become drier, while the wet seasons of June-August and September-November will become wetter. 4 Two other models, namely the CSIRO Australian model (A2) and the MIROC-NIES (B1) Japan model were also used to predict local climate changes, and they provide slightly different spatial projections. Both models show a general warming trend moving to the years 2020 and 2050. Rainfall projections show either negative or positive tendencies for the different regions in the Philippines. With an A2 scenario, on one hand, rainfall will continue to decrease from 2020 to 2050 projecting very dry average conditions for the Philippines, in the range of -0.3 to 2.0 mm per day. The MIROC-NIES model, on the other hand, projects a mixed result for rainfall patterns. Parts of the Visayas and the whole of Mindanao in 2020 will experience increased rainfall ranging from 0.1 to 2.0 mm per day from the normal amounts, while Luzon and other parts of Visayas will have drier conditions. By 2050, Luzon will slightly shift to a positive change in rainfall, with Mindanao having decreased rainfall but still more than the usual for the current climatology (1961 to 1990). The Visayas will remain consistently drier in that period.
VULNERABILITY ASSESSMENTS AND SCENARIOS 5 Apart from the GHG emissions inventory, the other component of the Second National Communication to the UNFCCC is the country vulnerability and adaptation assessment. This shall be the basis of adaptation strategies for identified priority economic sectors and areas. In turn, the strategies as formulated will express how a policy for adaptation to CC can be integrated into national sustainable development plans and programs. The vulnerability assessment for the SNC was prepared by the Philippine Rural Reconstruction Movement (PRRM) component in October 2009. It covered the following economic sectors: agriculture and food security, watersheds (i.e. water resources, forestry and biodiversity), coastal resources and human health, and undertook pilot area studies in Albay, Bohol and Surigao del Norte, given their geographical location, pre-disposition to current climate-related risks, and availability of current climatic data and other environmental information. Local assessments were then scaled up to the national level for three time frames, i.e. current or baseline, 2020 and 2050.
4
Yumul, N. and N. Servando, October 2009. Observed Trends and Climate Change Scenarios for the Philippines. Paper presented at the NATIONAL CONFERENCE ON CLIMATE CHANGE ADAPTATION + 2, October 26-27, 2009, Diamond Hotel, Manila, Philippines. 5 Philippine Rural Reconstruction Movement (PRRM), October 2009. Second National Communication on Climate Change: Philippine SNC Project, Vulnerability and Adaptation Assessment Component. Quezon City, Philippines. GEF / UNDP PROJECT ID 00037339
Resources, Environment and Economics Center for Studies, Inc. (REECS)
Page 5
BASELINE SCENARIO The assessment initially noted the changing climate conditions historically observed in the country, i.e. the increase in annual average mean temperature by 0.620C in the last fifty six years, the frequency of hot days and warm nights, and amount and intensity of rainfall. Economic conditions were also discussed, such as the economy’s stagnant performance over the past decades, the effect of limited productive employment opportunities on overseas migration, the high rural poverty incidence and dependence of the rural poor on agriculture and natural resources, and their vulnerability to climate change. Moreover, the occurrence of climate related disasters have caused increasing economic impacts, estimated at an average of USD 300 million (PhP 15 billion) a year over the past 36 years, according to the World Bank and the National Disaster Coordinating Council (NDCC). The cost of damages from typhoons alone estimated at 0.5% of the country’s GDP has not been matched by calamity fund appropriations.
SOCIO-ECONOMIC PROJECTIONS Economy-wide projections were made for the four scenarios used in the Special Report on Emissions Scenarios (SRES) published by the IPCC in 2000. The SRES scenarios were constructed to explore future developments in the global environment with special reference to the production of greenhouse gases and aerosol precursor emissions. Four narrative storylines were developed, each one representing different demographic, social, economic technological and environmental developments that diverge in increasingly irreversible ways: A1 storyline and scenario family: a future world of very rapid economic growth, global population that peaks in mid-century and declines thereafter, and rapid introduction of new and more efficient technologies. 2. A2 storyline and scenario family: a very heterogeneous world with continuously increasing global population and regionally oriented economic growth that is more fragmented and slower than in other storylines. 3. B1 storyline and scenario family: a convergent world with the same global population as in the A1 storyline but with rapid changes in economic structures toward a service and information economy, with reductions in material intensity, and the introduction of clean and resourceefficient technologies. 4. B2 storyline and scenario family: a world in which the emphasis is on local solutions to economic, social, and environmental sustainability, with continuously increasing population (lower than A2) and intermediate economic development 1.
The PRRM Report provides a detailed description of the projections that were based on quantitative projections of major driving variables, such as population and economic development. Integrated assessment models were used, resulting in families of scenarios for each storyline. There were no assigned probabilities of occurrence for the six groups of resulting scenarios: one each for the A2, B1 and B2 storylines, and 3 for A1, representing alternative developments of energy technologies. The following table attempts to summarize the economy-wide projections contained in the SNC:
Resources, Environment and Economics Center for Studies, Inc. (REECS)
Page 6
Table 3 Economy-Wide Projections with Climate Change, Using 4 SRES Scenarios Scenario/ Indicator Population
Population density Urbanization: NCR population (nth most populous urban agglomeration in the world) Age Structure Dependency Ratio GDP Displacement due to 100 cm SLR
A1
A2
Increasing births over deaths up to 2010 2nd largest population in the region by 2050 421 persons per sq.km. in 2050
B1
Increasing births Increasing births over deaths up to over deaths up to 2025 2010 2nd largest population in the region by 2050, highest population growth rate 559 persons per 421 persons per sq.km. in 2050 sq.km. in 2050 10.7 M 2005 (19th) 11.1 M 2007 (17th) 12.6 M 2015 (16th) 14.8 M 2025 (14th)
B2 Increasing births over deaths up to 2015
487 persons per sq. km. in 2050
% of people under 15 continually declining until 2050 Working aged adults continually increasing Elderly population steadily growing Level of dependency of elderly will start to increase from 2005 Potential support ratio: 5.2 in ’70, 4.8 in ’00, 3.6 in ‘20 3.796% in 2009 5.5% in 2013 2 million people from 28 cities and municipalities
SECTORAL VULNERABILITIES TO CLIMATE CHANGE The following sectors were identified to be most vulnerable: agriculture, forestry, water, and the coastal areas. The agricultural sector has mixed projections on the local impacts of climate change for particular crops. In the case of rice, negative impacts dominate the projections. On the whole, because of the increasing frequency and intensity of extreme climate events, and changes in rainfall patterns, climate change is seen to adversely affect food production. In the forestry sector, the vulnerability of watersheds to climate change is methodologically determined by a number of variables: area sensitivity (e.g. topography, geological hazards), degree of exposure to climate change, vulnerability of natural resources, and the adaptive capacity based on HDI and density of the population. Watersheds are already exhibiting high variability in annual temperatures and maximum temperatures are continuously rising. Increased rainfall will also potentially lead to watershed disasters such as landslides and floods. Water shortages in dry seasons and sudden flooding and mudslides during rainy seasons are already affecting biodiversity in these areas. While Philippine forests are likely not to disappear due to climate change (Lasco et al, 2004), wet and rain forests will significantly expand as dry and moist forests become wetter. However, certain forests are at risk with Resources, Environment and Economics Center for Studies, Inc. (REECS)
Page 7
increased rainfall because of the lack of a distinct dry season, while some forested areas with its biodiversity will likely be reduced as more forest lands are opened with the upland migration of poor lowland households. With regards to the water sector, changes in rainfall patterns, longer periods of drought, and saltwater intrusion into freshwater reserves are most likely going to negatively affect drinking water supply. According to an earlier study on climate change (PINC 1999), a 2 to 3oC increase in annual temperature would constrain domestic water consumption. Moreover, with increased crop activity due to enhanced solar radiation, water demand in the agricultural sector would also increase. Lastly, global warming will affect industrial use of water. Even without considering climate change impacts, the National Water Resources Board (NWRB) had already projected a potential water supply deficit by 2025 in twelve water resources regions of the country. It may be noted that Angat Dam, which supplies Metro Manila, will have the largest water deficit. Thus with climate change, more severe deficits may be expected. The coastal sector is one of the most vulnerable areas to climate change - the Philippines being ranked as one of the ten countries most vulnerable to sea level rise in terms of population exposure. The warming of the ocean will also lead to widespread coral bleaching and a decrease in planktons that will diminish fish catch. Sea level rise may also cause salinity intrusion, as well as add up to storm surge, tsunami damages, and land subsidence impacts. Moreover, arable coastal lands may be lost, affecting people’s livelihoods and income. Mangroves will also not be spared and low-lying tide dependent fish and shrimp ponds may get flooded, thereby subjecting fisheries and aquaculture to increased pressure. Subsistence and small-scale fisherfolk who lack options will suffer disproportionately from these changes in marine and coastal ecosystems. Moreover, the dangers posed by ocean acidification will consist of a disruption in reef and bone formation of marine organisms. Slower reproduction will thus reduce abundance, and affect marine biodiversity on the whole. Finally, the impacts of extreme weather events will lead to either more floods or droughts, and cause the displacement of more people in lowlying coastal areas. The SNC’s VA component has produced a manual for conducting vulnerability assessments which may prove highly useful for future exercises of assessment and adaptation planning. As the country gears towards a changing climate, it will be imperative to incorporate these new planning tools in the government’s regular planning and implementation programs.
Resources, Environment and Economics Center for Studies, Inc. (REECS)
Page 8
COSTS OF IMPLEMENTING PRIORITY MITIGATION AND ADAPTATION MEASURES REDUCING GHG EMISSIONS 6 Given the SNC finding on the increased GHG emissions share of the energy sector, the Department of Energy plays a critical role in addressing this development, specifically in defining the government’s mitigation strategy and identifying the priority mitigation programs/ projects. At the moment, the government’s response is reflected in the MTPDP goal of sustainable energy development that is anchored on energy independence and power sector reforms, thereby addressing the growing energy security issue (MTPDP 2005). Specifically, it is focused on attaining a 60% energy self-sufficiency target by 2010. One of the six strategic directions set by the Department of Energy in 2007 specifically addresses the problem of climate change7 -- that of promoting green and clean energy alternatives and technologies that will mitigate the long-term effects of energy development to global warming. In line with its energy independence and security goals, the DOE has defined its mitigation strategy in terms of the following measures: 1. Aggressive development and utilization of renewable energy (RE) resources; 2. Development and use of alternative fuels and technologies; and 3. Implementation of massive and comprehensive efficiency and conservation programs. In order to formulate its sustainable energy development strategy, the DOE‘s commissioned study employed an International Atomic Energy Agency (IAEA) model for Energy Supply Strategy Alternatives and their Environmental Impacts (MESSAGE) in 2007 to 2009. Using 2007 as the base year, with due consideration of the country’s various reserve resources (coal, oil, gas and bio-fuels feedstock, like sugar and coconut), as well as the primary, secondary and final levels of energy forms for the end-consumers, the study evaluated four investment options for the period 2008 to 2030. The options provide a costing of potential mitigation strategies, and they consist of the following scenarios. 1. Reference Scenario, which includes all existing policies of the government mentioned above. 2. Maximum RE Scenario, which assumes doubling the REPP capacity within the first 10 years of the model starting in 2009.
6
This section is largely based on the following document: Department of Energy, Philippine Nuclear Research Institute, National Power Corporation, National Electrification Administration, National Economic and Development Authority, and Philippine Council for Industry and Energy Research and Development, April 2009. Formulation of Sustainable Energy Development Strategies in the Context of Climate Change for the Philippines (RAS/0/045). Regional Cooperation Agreement, Project International Atomic Energy Agency. 7
The five strategic directions consist of the following: 1) to ensure comprehensive, integrated, responsive and consistent energy policy that will take into consideration the needs and requirements of other sectors in the economy such as transportation and communication, public works such as sea and air ports, highways and information technology; 2) to identify and achieve the optimal energy mix that will ensure stable, secure, sustainable, environment-friendly and reasonably priced energy given the successful implementation of planned policy and program interventions; 3) to continue the implementation of social mobilization and monitoring mechanisms in the local and regional levels that will harness the cooperation of all key stakeholders in carrying out energy programs considering that energy development impacts on all sectors; 4) to establish a research and development program for energy that will be supportive of the foregoing strategic directions; and 5) to develop human resource capacity that will look into the professional and technical skills requirements of energy development particularly in areas such as nuclear, natural gas, climate change and energy service companies.
Resources, Environment and Economics Center for Studies, Inc. (REECS)
Page 9
3. Nuclear Scenario, which assesses the prospect of rehabilitating the 620-MW Bataan Nuclear Power Plant (BNPP) in three periods, i.e. 2015, 2020 and 2025, along with the entry of a new 100-MW NPP. 4. CO2 Reduction Scenario, which is based on the climate change mitigation plan of the country that was submitted to the UNFCCC, and which further targets a CO2 emission limit through the reduction target of 5% of the 1990 CO2 level starting in 2012.
REFERENCE SCENARIO In this scenario, the CC mitigating measures consist of the use of hydropower, biomass, wind and solar power. Hydropower will grow at 5%, faster than geothermal, and will contribute 23.6% to total energy mix. Biomass will have an average share of 11%. Finally, wind and solar power plants are seen to contribute 0.1% to total generation mix, since no additional plants were assumed to be put up due to their high investment costs. Oil however will remain as the dominant fuel, mainly because of the transport sector demand. The share of coal will increase and will grow fastest as it will fuel most of the electricity requirements in the last decade, despite an increase in the utilization of geothermal energy. The share of geothermal to total energy supply is expected to decrease because of increasing steam price and investment costs (an average of 19.6% over the model period). Malampaya reserves will continue to supply energy until 2022, after which the country will have to import its natural gas requirements to keep its share of total energy mix at an average of 27%. The simulation results of the above scenario (Table 4) show that total primary energy supply (TPES) will grow by more than 52% between 2007 and 2030, and the required investments would amount to US$28.74 billion. Table 4 Investment Requirements in Electricity Generation Using Reference Scenario, 2008-2030, 10% Discount Rate Resource Coal Gas Hydropower Geothermal Wind TOTAL
Amount, in USD Billion 16.9 3.7 7.8 0.203 0.139 28.74
% to Total 58.8 12.9 27.1 0.7 0.5 100
Capacity 10 GW 3.6 GW 3.1 GW 70 MW 8.25 MW 16.7 GW
Given the above CC mitigating measures, implementation of these measures is expected to reduce the 2005 emissions level by 5.8% in 2010. This suggests that for this 5-year period, a 1% decrease in GHG would require an investment of US$4.95 billion. However, more investments may apparently be necessary because the projected growth in energy demand will increase CO2 emissions by an average of 3.2% annually henceforth, reaching 163.6 MtCO2 in 2030. Hence, CO2 emission per unit of TPES will continue to increase at an annual rate of 0.7%. CO2 emission per unit of GDP, however, may decrease, as the economy operates with a larger service sector and less energy intensive industries.
Resources, Environment and Economics Center for Studies, Inc. (REECS)
Page 10
MAXIMUM RE SCENARIO In this scenario, RE’s share in electricity generation is projected to reach 35% of TPES for the first ten years of the timeframe. This will come mainly from geothermal and hydropower sources, displacing a portion of fossil fuels relative to the previous scenario. Energy self-sufficiency will reach 60% between 2009 and 2020, but this will decrease due to increasing energy demand and lack of potential capacity to follow suit thereafter. The scenario is expected to reduce CO2 emissions by a total of 188.3 MtCO2 from 2009 to 2030. CO2 emission per capita will likewise decrease by 8.4% in 2010, and 4.3% in 2030. Table 5 Investment Requirements in Electricity Generation Using Maximum RE Scenario, 2008-2030, 10% Discount Rate Resource Coal Gas Hydropower Geothermal Wind Solar Ocean TOTAL
Amount, in USD Billion
% to Total
18.6
61
7.7 3.1 0.7 0.13 0.28 30.51
25.2 10.2 2.3 0.4 0.9 100
Capacity 8.8 GW 3.6 GW 3.1 GW 1.1 GW 400 MW 16 MW 120 MW 16.7 GW
The above Table shows the required investments (US$ 30.51 billion) which is higher by almost 8% compared to the reference scenario. The emission reduction benefit from the investments suggests that a 1% decrease in per capita emission over the period will require an investment of US$ 7.1 billion. The difference of around US$2 B is the implicit result of a 10% displacement of fossil fuels by renewable energy sources, and this will entail higher electricity prices.
NUCLEAR SCENARIO This scenario considers the rehabilitation of the Bataan nuclear power plant (BNPP), and simulates 3 possible launching periods, i.e. 2015, 2020, and 2025. For comparison purposes across scenarios, only the 2015 rehabilitation scenario at 10% will be presented. The use of nuclear energy will result in the displacement of coal, and to some extent reduction in the share of hydro and gas in TPES relative to the reference scenario. A significant reduction in GHG emissions is expected, with CO2 emission decreasing by 60 MtCO2, or around 3% of TPES over the period. Apart from reducing GHG emissions, the nuclear scenario will also result in lower generation costs. The required investments will amount to around USD 615,400,000 (PhP 30.77 billion), almost equal to the maximum RE scenario. Though this scenario provides the most reliable source of base-load power, public acceptability of the BNPP seems to be low. The cost of a proper disposal of highly toxic and hazardous wastes, as well as the safety of the plant’s location needs to be addressed. Table 6 Investment Requirements in Electricity Generation Using Nuclear Scenario, 2008-2030, 2015 BNPP Rehabilitation Period, 10% Discount Rate
Resources, Environment and Economics Center for Studies, Inc. (REECS)
Page 11
Resource Coal Gas Hydropower Geothermal Wind Nuclear TOTAL
Amount, in USD Billion 14.07 3.72 7.75 0.20 0.01 5.02 30.77
% to Total 45.7 12.1 25.2 0.6 0.03 16.3 100
Capacity
7.9 GW 16.7 GW
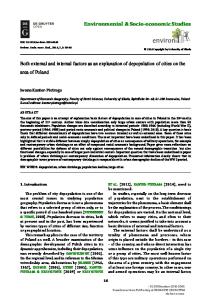
CLIMATE CHANGE MITIGATION SCENARIO The last scenario simulated by the MESSAGE model was the reduction of CO2 emissions by 5% below 1990 levels, equal to a reduction to 41.1 MtCO2. This scenario would entail a substantial decrease in the use of coal, and its replacement by gas, geothermal, hydropower and nuclear energy sources, thereby further diversifying electricity generation. Gas, coal, and hydropower will almost be equally distributed with an average share of at least 25% of total electricity generation. Geothermal energy’s share will be about 17%, while other RE sources will account for 0.9% and nuclear energy the rest. However, upon plotting projected emission levels in this scenario, CO2 emission levels will still continue to increase, despite all the mitigating measures and the use of the cap and trade approach. The 5% reduction based on 1990 levels is thus deemed to be unattainable by this supposed CC scenario. In summary, the reference scenario with its US$ 29 B investment requirement comes out as the least cost option, and the government shall pursue it in the medium and long-term. This least-cost strategy will result in a reduction of GHG emissions, albeit at lower levels than the other scenarios. With coal as the significant energy source in this strategy, the study recommends the following mitigation actions: 1) the application of clean coal technologies; 2) carbon capture and storage activities; and 3) reforestation of plant vicinities to serve as carbon sinks. Though reduction of the dependence on imported coal is not a mitigation measure, the study recommends the construction of coal-fired power plants specifically designed to accommodate domestic coal for cost effectiveness measure. The cost of these additional investments, however, needs to be considered in the above calculations. As a more effective CC mitigation measure, the maximum RE scenario will reduce GHG emissions and provide the longest sustained and highest level of energy self-sufficiency. But its substantially higher generation costs due to high upfront costs make it less feasible to pursue. This constraint may be addressed by the incentives in the current RE Law (e.g. seven years of income tax holidays, duty-free importation of machinery for the first 10 years, and other special tax rates on equipment and machinery) that may lower investment and operating costs, but there is no guarantee that these will translate into lower electricity prices for the end consumer without corresponding government regulation. A simple comparison of existing renewable energy operating costs on a per kwh basis with the current grid rate (Figure 1 below) may indicate that the cost of energy from nuclear and solar is prohibitive without more government support. But it also shows there may be more positive opportunities for RE that the above scenarios may tap in the areas of wind and biomass, sources that have not yet figured significantly in the current energy mix of the country.
Resources, Environment and Economics Center for Studies, Inc. (REECS)
Page 12
Comparative Cost 45
40
35
30
25
US cents/Kwh
Maximum Minimum
20
15
10
Grid Rate 5
0 Nuclear
Slide 3
Coal
Natural Gas
Geothermal
Biomass
Hydroelectric
Wind
Solar
Challenges of Renewable Energy 9 September 2009
Source: Aboitiz, M. Challenges of Renewable Energy, Powertech Business Forum Sept 2009, WTC, Manila.
Figure 1 Comparative Costs of Renewable and Non-Renewable Energy Sources
Resources, Environment and Economics Center for Studies, Inc. (REECS)
Page 13
ADAPTING TO CLIMATE CHANGE ADAPTATION MEASURES Despite the lack of a national framework, the country has begun the process of coming up with its list of adaptation strategies in the various relevant sectors for addressing climate change. The planning process is conducted at the sectoral level, each with varying substance and degree of completeness. All of these will eventually be consolidated and integrated. The objectives of each set of sector strategies are: (1) to reduce the ecological and economic impacts of climate change on economic activities; and (2) establish and enhance technologies and measures that promote productivity in the context of CC, or at least mitigate its impacts. Following is a summary of emerging priorities resulting from various consultations and validation work at the national, regional and local levels, as well as by a host of government and non-government stakeholders. S CIENCE AND T ECHNOLOGY S ECTOR 8 The general objective of building CCA strategies in the science and technology sector is to sustain productivity and competitiveness of the agriculture, forestry and natural resources sectors, based on each of their vulnerability assessments to climate change. The conduct of vulnerability assessments (VA) has, therefore, been considered a priority action in the immediate term before adaptation strategies are formulated. The sector has drafted a long research agenda that would conduct proper vulnerability assessments and propose appropriate adaptation strategies and technologies for the identified sectors. The VA manual produced by the SNC may prove highly useful in this regard, and it is recommended that the proposed VA strategies below be harmonized with the SNC’s VA manual when actual sectoral and/or geographical VAs will be conducted. Table 7 CCA S & T Strategies, Crops and Soils
Vulnerability Assessment
Knowledge & Technology Generation Identification of vulnerable areas (e.g. drought-prone areas, flood-prone areas, and salinity-prone areas) through GIS or remote sensing technology; – to determine what type of crop to plant and the appropriate land use Identification of the critical climate thresholds and evaluation of the impacts of extreme weather events on agriculture such as the impacts of drought, flooding, diseases and insect pests; and sea level
R & D Utilization Modelling the impacts of climate change on major crops based on the IPCC emission scenarios or SRES (IPCC, 2000); using the IPCC SRES emission scenarios will promote consistency in assumptions and will allow comparison of results)
Capacity Building & Governance Strengthening the use of weather and climate-related information (weather forecasting) to improve risk preparedness and to safeguard and maximize agricultural production in the country Establishment and maintenance of observation facilities for the collection and compilation of climatic, social and biophysical data in support of climate change studies;
8
Villar, E. October 2009. Philippine Climate Change S & T Agenda in Agriculture, Forestry and Natural Resources Sectors. Paper Presented at the NATIONAL CONFERENCE ON CLIMATE CHANGE ADAPTATION + 2, October 26-27, 2009, Diamond Hotel, Manila, Philippines.
Resources, Environment and Economics Center for Studies, Inc. (REECS)
Page 14
rise; Effects of elevated CO2 and increasing temperature on the yield of major crops Effects of elevated CO2 and increasing temperature on insect pest and diseases of major crops Adaptation
Sector Mitigation
Adaptation researches concerning agrotechnology and water resources management Evaluation of new varieties for heat/drought tolerance, submergence tolerance, soil salinity tolerance, and resistance to insect pests and diseases Development of new philosophy in farming practices and improvement of existing farming practices to combat climate change Evaluation of different planting dates in major crops for optimum yield Development of marginal abatement cost curve (MAC curve) for potential mitigation options in agriculture Study on efficient use of N fertilizer (precision farming) and practices that reduce N application (and thus N2O emissions) which enhance crop productivity and environmental quality Study on the economics of recycling agricultural residues for bioenergy and the economics of growing energy crops Development of a crop– livestock–forestry integration systems as an effective and sustainable approach to reduce GHG
Development of package of adaptation technologies for vulnerable areas (e.g. adaptation technologies for drought-prone areas, floodprone areas, saline areas)
Development of package of mitigation technologies for agriculture which consider the technical and economic mitigation potential
Improvement of information-sharing and data networking on climate change in the Philippines Awareness campaign, education and training on the impacts of climate change and vulnerability of major crops. Improvement of agricultural facilities and infrastructure in support of developing and promoting adaptation technologies Increase awareness on the availability and utilization of potential adaptation technologies in agriculture (e.g. new rice varieties for salt tolerance, etc.)
Increase awareness on the benefits of implementing mitigation practices in agriculture
Resources, Environment and Economics Center for Studies, Inc. (REECS)
Page 15
emissions
Table 8 CCA S & T Strategies, Livestock and Poultry
Vulnerability Assessment
Adaptation
Mitigation
Knowledge and Technology Generation GIS-assisted identification and evaluation of vulnerable areas for feed grains, pasture crops against drought, salinity, water logging, and shading Trend analysis of livestock productivity by year and season Assessing the impact of climate change on the etiology and virulence of pathogenic organisms on livestock Trend analysis of occurrence of climate sensitive animal diseases Identification and economic valuation of the different effects of climate change on livestock and poultry productivity Improving heat tolerance through breeding Molecular identification of genetic markers for heat tolerance and disease resistance Establishing favourable microclimatic conditions for better housing management Development of vaccines for common and emerging animal diseases Improved nutritional management schemes or feeding strategies adapted to extreme climatic conditions Physical modification of the environment tailor fit to different production systems Development of breeding management interventions attuned to the changing climatic conditions Identification and conservation of indigenous animal genetic resources adapted to extreme climatic conditions Improvement of digestibility of both conventional and unconventional feeds Revisit crop-animal integration for efficient use of resource and conservation and use of biodiversity Study on nutritional intervention to minimize enteric gas emission Study on more efficient and economical means of animal waste management
Table 9 CCA S & T Strategies, Forestry Sector
Mitigation
Problem Areas/Relevant ISP Targets Inadequate biomass equations/rates of carbon sequestration (site/species specific) Lack of info on carbon footprints of forest-based industries Unknown fate of harvested wood products (HWP) Lack of information on REDD and A/R CDM in the Philippines in the context of UNFCCC Lack of economic analysis on mitigation activities in forestry
Research and Development
Expected Outputs
Biomass equation studies for specific sites/species
Site/species specific biomass equations
Studies on C footprints of forest-based industries
C footprints of forest-based industries Proportion of wood that end up in long-term Carbon storage Potential mechanisms to obtain C credits from REDD and A/R CDM Economic analysis of mitigation activities in
Assessment of the fate of wood from the forest to the end-use; link to IPCC issue on HWPs Assessment of potential of the Philippines for REDD and A/R CDM Carbon credits Economic analysis of mitigation activities in forestry
Resources, Environment and Economics Center for Studies, Inc. (REECS)
Page 16
- Valuation studies on environmental services Lack of mitigation strategies in forest-based industries
Adaptation
Inadequate CC impact and vulnerability studies on various forest types and other environmental services (i.e. water) by elevation •Mangrove/ Beach •Terrestrial •Agroforestry •Urban •Plantation No monitoring of impacts •Phenology •Cropping patterns/systems •Insect infestation Lack of information on carrying capacity of and impacts (sea level rise and other climate extreme events) on small island ecosystems (Priority on the Eastern board) Lack of database on: •coping mechanisms of people •Biophysical characteristics (i.e. flora and fauna, soil, climate) •Socio-economics Lack of information on how forest ecosystems help upland/local communities adapt to CC (coping mechanisms) Lack of information on adaptation strategies by ecosystems: • Urban • Mangrove/ Beach • Terrestrial • Plantation • Agroforestry Lack of economic analysis on Adaptation activities in forestry • Valuation studies on environmental services
a) Valuation studies on environmental services b) BCA of mitigation activities a) Utilization of cellulosic waste for bioethanol production b) Enzyme discovery for bioethanol production c) Paper mill sludge for algal production for energy CC impact and vulnerability studies on various forest types and other environmental services (i.e. water) by elevation •Mangrove/ Beach •Terrestrial •Agroforestry •Urban •Plantation
forestry
Monitoring of CC impacts on: •Phenology •Cropping patterns/systems •Insect infestation Assessment of carrying capacity of and CC impacts on small island ecosystem
Observed impacts of CC to forests
Gather information and develop database for: •coping mechanisms of people •Biophysical characteristics (i.e. flora and fauna, soil, climate) •Socio-economics Documentation & assessment of local practices, knowledge, research results on the use of forest resources to enhance resilience of local communities to CC Assessment & documentation of Adaptation strategies by ecosystems: • Urban • Mangrove/ Beach • Terrestrial • Plantation • Agroforestry Economic analysis of adaptation activities in forestry • Valuation studies on environmental services
Resources, Environment and Economics Center for Studies, Inc. (REECS)
Alternative energy/ Biofuels
Vulnerability assessments of various Ecosystems
Carrying capacity
CC Database
Best practices for adaptation using forest resources
Adaptation strategies and measures for terrestrial and other ecosystems
Economic analysis of Adaptation activities in forestry
Page 17
• BCA of adaptation activities
Table 10 CCA S & T Strategies, Hydrology and Water Resources Key Area Vulnerability Assessment
1. 2. 3. 4. 5. 6. 7. 8.
Adaptation
9. 1. 2. 3. 4. 5. 6.
Cross Cutting Concerns
Research Agenda Studies on downscaling climate scenarios and projections at national level. Evaluation of effects of climate change on hydrologic variability including extreme events. Assessment of dependability of water supply from different major watersheds in the country as well as in the different geographical areas has to be evaluated in the light of significant land use and land cover changes. Evaluation of impacts of climate change on water resources scarcity for different uses based on annual and monthly demand and supply. Coupled climate and land-use modeling to account for feedbacks between land use and climate change. Development of indicators of climate change impacts on freshwater for assessment and monitoring. Consideration of “green water” (soil water originating from rainfall) and “blue water”(surface and groundwater) in water resources assessment. Development of techniques and procedures to communicate the results of probabilistic approaches for risk analysis for use by end-users. Exploring applicability of weather index-based adaptation measures. Early warning system (EWS) is an effective strategy to adapt to the impacts of climate change particularly the water resources related processes and hydrologic variables such rainfall, stream flows, floodwaters, etc. Use of reliable seasonal climate forecasts downscaled to a province is useful information for making appropriate adaptation measures at the local level. Adoption of water-efficient technologies and good practices e.g. improving water-use efficiency and water-demand management, are no regrets options to address climate change. Science-based operational policy for hydropower dams and reservoirs are needed to manage and operate the water resources system control structures incorporating climate change risks, and considering the multiple uses of such structures. Wastewater management and water reuse need to be further studied and quantified in the context of water scarcity assessment. Improving irrigation and fertilization strategies in agricultural crop production systems may reduce CO2 emissions from energy systems to deliver the irrigation water, and nitrous oxide emissions through proper timing and dosage of inputs.
1. Development of the Philippine Information Base which include updating of water resources meta-database of current information sources about water resources systems in the country, new indicators to include ecological status of water resources systems, and mapping and assessing the current state of water resources systems. 2. Development of integrated watershed models that depict the linkages and feedbacks among the various key components (e.g. hydrology, biodiversity, water use) which can then be coupled with downscaled local climate scenarios to study future states of water resources systems. 3. Capacity building to reach out to larger community of stakeholders and the society-atlarge through collaborative research, training programs, scientific workshops, and many other educational activities.
Resources, Environment and Economics Center for Studies, Inc. (REECS)
Page 18
IEC Program
1. Seminars on climate effects and impacts and building resilience should be conducted at local level. 2. Communities, families and individuals should be educated on climate risks and natural hazards and how to respond to these hazards safely and effectively.
Finally, regarding institutional and policy concerns for the S & T sector, the research agenda consisted of a number of capacity assessment and capacity-building strategies: Table 11 CCA S & T Strategies, Institutional and Policy Concerns Key Area Capacity Assessment
1. 2. 3.
Capacity Building
1. 2. 3. 4. 5.
Cross-Cutting Concerns
1. 2.
Research Agenda Examine the role of local institutions and their interaction in CRM, and defining their strengths and limitations; Assess institutional capacity, e.g., human resources, skills and performance, management capacity (mandates, availability of financial resources, management practices and processes), level of participation, authority, stability/adaptability of the institution. Determine the extent to which climate risk management measures are institutionalised and streamlined within local government systems; and examine legal and regulatory environments that would reduce vulnerability among the population. For adaptation, develop tools and approaches for mainstreaming CC into local agriculture and natural resources development and investment plans. Study feasibility of CC risk insurance mechanisms and products for private sector, and household level; as well as for farming communities. The weather index insurance can also be an alternative or can complement the crop insurance scheme now in use. Clarify roles, mandates, functions and tasks of existing CC institutions. Local institutions should be strengthened and inter- local linkages built. Study the collaboration between managers of weather data, water resources, farmers and policy makers and strengthen extension services. Formulate a consistent strategic climate change framework and national action plan for the AFNR sectors. There is need to assess sector level policies that can address climate change issues; but it is also important to study and analyze inter-sectoral policy contradictions. There must be a strong political will and advocacy for legislative measures on land use conversion and irrigation systems development to attain food security under episodes of climate risks
A GRICULTURE S ECTOR The agriculture sector’s set of strategies is premised on the framework that “The knowledge of CC science is within the scientists’ domain, (but) the knowledge of response of ecosystems and their resources to CC can be provided by farmers”9. As coordinated and consolidated by the Bureau of Soils and Water Management (BSWM) of the Department of Agriculture (DA), and through the GTZ-funded ACC-BIO project, the following matrix provides the various outcomes, strategies and outputs that the agricultural sector intends to pursue in adapting to CC:
9
Tejada, S. October 2009. Agriculture Sector Climate Change Adaptation Strategy within the Context of the Devolution. BSWM-DA. Paper Presented at the NATIONAL CONFERENCE ON CLIMATE CHANGE ADAPTATION + 2, October 26-27, 2009, Diamond Hotel, Manila, Philippines.
Resources, Environment and Economics Center for Studies, Inc. (REECS)
Page 19
Table 12 Priority Policies and CC Adaptation Actions, Agriculture Sector10 Strategy Objective Outputs Implementers Outcome 1: Enriched Climate Change Risk Data Base and Establishment of Climate Change Informed Stakeholders DA,DA-BSWM, • SAFDZ-CLUP Map To develop local capacity Operationalization & DENR, DILG, • Data base on climate risks for the generation, analysis, and Integration of DAR, LGUs, •Land Use Plan and integration of climate related Weather- Based SAFDZ and Farmer Planning Process that risks, land use and resources at Climate Risks Association, integrates climate change risks and appropriate adaptation Adaptation Strategies adaptation with disaster risk NGOs, Academe, measures into the disaster risk in CLUP Process Private Sectors mitigation management and local land use planning processes Farmer-Scientist Partnership To establish science enhanced • Participatory Early DA, Farmer for Climate Change local knowledge on agriculture Warning Scientists Intelligence Network / For and ecosystem responses to Systems and Vulnerability (GAWAD Saka Monitoring C impacts of microclimate changes Maps and Information Awardees), needed for real -time spatial and • Network of well informed DENR, Academe, temporal changes in microlocal CC champions and PAGASA/DOST, climate in the agro-ecosystem science NGOs, LGUs specific CC warning systems validated Biological Indicators of CC as ground truths for identifying communities and areas at risk to CC DA, DA-RFU, • National Experts To establish a dedicated National R, D and E Agenda for CC DA-BAR-ATI, Budgetary Program for Climate RD Consortium on RD and E Adaptation for Coastal Academe on Climate Related Risks and E Agenda for Climate Change Areas, Small Islands Areas adaptation measures; Adaptation with Active • National Agenda and Volcanisms, and Priority Research and Sequestration and Emission Technology Development Capacity/ Potential of priority crops, livestock and Agriculture aqua-culture Outcome 2: Climate Resilient Agriculture, Agro-biodiversity and Self Reliant Communities DA, DA-RFU, • CC- Well To establish national program for National Pilot Program DENR, DAR, informed farming pilots in selected areas for Support To Replication and Academe, LGUs communities; replication and up scaling of best Up-scaling of Climate Based Farmers • Climate resilient farming farmer initiated practices and Conservation Farming and systems that produce create association, technologies on conservation Conservation of Agroself reliance and ensure safe NGOs, private farming biodiversity institutions and nutritious food that are less dependent on imported (PRRM, MASIPAG, etc) fertilizers and other farm inputs. Integrating To establish policy support and Rice production adaptation DA, DA-RFU, NIA, Production, Supply pilots to demonstrate integrated program agreed and DAR, Management and irrigated and rain fed rice implemented to reduce risk Farmers/Irrigators Restoration of Lowland production program that reduce of farming communities Association, Ecosystems Functions risks of loss in production, income from crop losses attributed NGOs, LGUs for Flood Water Control and restore productivity of to extreme climate disasters & Management & Agrolowland Ecosystems and income losses caused by Biodiversity Enhancement oversupply and reduced farm gate prices 10
Tejada, S. October 2009. Agriculture Sector Climate Change Adaptation Strategy within the Context of the Devolution. BSWM-DA. Paper Presented at the NATIONAL CONFERENCE ON CLIMATE CHANGE ADAPTATION + 2, October 26-27, 2009, Diamond Hotel, Manila, Philippines.
Resources, Environment and Economics Center for Studies, Inc. (REECS)
Page 20
To improve national support program for community-based small water reservoir systems as front line CC adaptation measures with complimentary function for agrobiodiversity and disaster risk reduction To enhance the implementation of urban agriculture and develop capacity of women and youth in the basic food processing, packaging and marketing and other skills with immediate market demand
Enhancing National Support to Community-based Rain and Flood Water Management for Upland Ecosystems Restoration and Productivity Improvement Urban Agriculture and Home-based Indigenous and Local Food Processing and Livelihood
Community-based Network of Water Detention Systems for flood mitigation and improved rain fed and upland crop diversification in the country
DA, DA-RFU, NIA, LGU, DAR
Food self sufficient and climate resilient Urban dwellers with women and youth sector capacity for basic food processing, packaging and marketing home produced food, herbal plants and food related products
DA, DA-RFU, DENR, LGU, DECS, DOST, DTI, DAR, Academe, Private sector, LGUs
B IODIVERSITY S ECTOR 11 Biodiversity is defined as the “common thread that makes the living fabric of forest and coastal/marine ecosystems stable and resilient”. Hence, conserving biodiversity ensures that ecosystems are more functional in providing us material goods and life support services as well as giving them a higher degree of adapting to CC. There are quite a number of issues and gaps that need to be addressed in order to allow the biodiversity sector to contribute to adapting to CC. Information, data and knowledge gaps on CC impacts on biodiversity still need to be refined to come up with sound predictions and research and monitoring plans, and there are still very limited vulnerability assessment studies done on critically endangered species and fragile ecosystems. Current biodiversity conservation programs are poorly funded, fragmented and uncoordinated, and are not yet properly monitored due to the absence of national baselines, standards and indicators. Worse, they are not even properly integrated in development planning especially in the development of human settlements. Some policies and strategies run into conflict with each other, such as the promotion of mariculture and mining which in some places aggravate the effects of CC. Native species of forests are being displaced due to the expansion of plantation forests. In the fisheries sector, the absence of population management programs has resulted in unsustainable patterns of production (such as the use of destructive fishing practices) and consumption within coastal areas thus lowering the capacity of the sector to adapt to CC. Finally, institutional concerns include non-complementation of existing management structures, resulting in weak coordination among them. Strategies to address these concerns in the biodiversity sector include the following: Table 13 Priority Strategies for CCA, Biodiversity Sector Key Area Knowledge Management
1.
Strategies Develop understanding on climate change impacts on biodiversity, forest and coastal/marine ecosystems;
11
Lim, M. October 2009. Biodiversity, Coastal and Marine, and Forestry Sectors. PAWB-DENR. Paper Presented at the NATIONAL CONFERENCE ON CLIMATE CHANGE ADAPTATION + 2, October 26-27, 2009, Diamond Hotel, Manila, Philippines.
Resources, Environment and Economics Center for Studies, Inc. (REECS)
Page 21
2. 3. 4. 5. Vulnerability Assessment
Institutional and Capacity Building
1. 2. 3. 1. 2. 3. 4.
Adaptation
1. 2. 3. 4.
Monitoring and Evaluation Cross-cutting Concerns
1. 2. 1. 2. 3. 4.
Develop research agenda and monitoring systems on the impacts of CC on highly vulnerable and threatened species and ecosystems; Conduct research, knowledge management and knowledge transfer on CC and biodiversity and forest and coastal/marine ecosystems; Encourage leading universities to institute in their degree programs (undergraduate and graduate degree programs on science-related courses ) subjects on biodiversity conservation and management Develop a data base and networking system to share information on biodiversity, forest & coastal/marine adaptation measures and conservation strategies. Develop vulnerability and risk assessment models on climate change impacts on biodiversity Assess vulnerability of species and ecosystems and preparing adaptation plans and programs; Identify, delineate and map climate vulnerable species and ecosystems; Develop and disseminate to concerned organizations the tools and models for vulnerability assessment, climate change impact prediction and adaptation measures determination; Build capacities of implementing organizations/agencies on biodiversity, forest and coastal/marine ecosystem management; Bring down the efforts to address climate change at the local level through the involvement of LGUs and local organizations; Provide the enabling conditions in terms of policy and institutional development to ensure the implementation of adaptation measures on biodiversity, forest and coastal/marine conservation; Manage PA’s, enforce zoning and establish wildlife corridors; Develop and adopt sustainable financing mechanisms (e.g., biodiversity heritage trading, payment for ecosystem services) Promote ex situ conservation of highly vulnerable species; Formulate a national strategic plan for biodiversity, forest & coastal/marine adaptation to climate change impacts; Monitor climate change impacts on highly vulnerable species and ecosystems Conduct CC M&E system at national and local levels; Integrate biodiversity adaptation strategies in development policies, plans, programs and projects; Integrate biodiversity, forest & coastal/marine ecosystem adaptation measures in disaster risk management plans and action programs Formulate urban development designs that are supportive of ecosystem diversity; Integrate biodiversity, forest and coastal/marine conservation in local development plans (CLUP, CDPs, PPFP) and master plans for tourism and infrastructure development
For the forestry sector in particular, the main adaptation strategy is keeping forest ecosystems intact by protecting these from being destroyed or degraded. Other adaptation strategies are secondary and operational in nature, such as siting safe places for human settlements, or selecting CC-resilient tree species for forest rehabilitation. The approach to protecting forest ecosystems is by active management in all forest lands. There should be no open access areas. Forest stewards given appropriate forestland tenure should practice sustainable forest management, which requires the following activities: 1. Partitioning of all forest lands into Sustainable Development Units: a) Biodiversity Conservation Areas Resources, Environment and Economics Center for Studies, Inc. (REECS)
Page 22
2. 3. 4. 5. 6. 7. 8. 9.
b) Watershed Protection Areas, and c) Forest Production Areas Zoning all BCA, WPA, and FPA into strict protection zones and controlled-use zones, and formulating a Management Framework Plan for each and every SDU. Dividing all SDUs into barangay cluster or barangay based Forest Management Units (FMU) for effective management. Establishing a barangay cluster or barangay forestry organization (BFO) to manage each FMU, providing them with permanent tenure. Formulating and implementing a Forest Management Plan for each FMU by the BFO supported by LGUs and other stakeholders and monitored by the DENR. Realignment of roles of all stakeholders. Motivating, capacitating, and supporting on-ground forest managers. Removing institutional constraints to sustainable management practices. Applying strict monitoring and control measures, like forest certification.
For the coastal and marine sector, some strategies that have been identified to allow the sector to adapt to climate change include the following: 1. Relocate people on low, small islands to higher ground; 2. Set up marine reserve networks with refugia as source of coral/fish larvae to replenish degraded reefs; refugia in deeper, cooler water near upwellings; 3. Prepare IEC programs on links between ecosystems and biophysical stresses to enable affected communities to understand climate change 4. Develop programs that emphasize the synergistic interactions of mangroves, seagrass beds and coral reefs in a given area; 5. Implement programs that protect coastal areas from storm surges, tsunamis and minimize, prevent human-related stresses; 6. Strengthen capacities of coastal communities, including stabilization of coastal populations I NFRASTRUCTURE SECTOR 12 Current standards in the infrastructure sector are generally based on historical climate patterns with shorter or inadequate records. Most infrastructure facilities are not yet designed to take CC into account, and there is very little evidence that shows that climate change in factored into infrastructure development decisions. As such, damages to infrastructure brought about by CC can result in inefficient operations, displacement of vulnerable groups, disruption of delivery of basic services, inaccessibility of damaged areas, all of which may result in decreases in total economic output and threats to national security. Key issues and gaps have been identified, as composed of the following:
12
Navida, C. October 2009. Adaptation to Climate Change and Conservation of Biodiversity in the Philippines (ACCBio) Project: Adaptation Strategies, Infrastructure Sector. Paper Presented at the NATIONAL CONFERENCE ON CLIMATE CHANGE ADAPTATION + 2, October 26-27, 2009, Diamond Hotel, Manila, Philippines.
Resources, Environment and Economics Center for Studies, Inc. (REECS)
Page 23
Table 14 Key Issues and Gaps for CCA in the Infrastructure Sector Key Issues Assessing risks – vulnerability check
Managing Risks
Practicalities of reducing risks
Gaps Reliable baseline hydrological, meteorological information and forecasting Vulnerability maps specific to project location Analytical tools, methods and models Climate change adaptation strategies not in place Knowledge of decision makers, investors, government agencies, private sector and academe Readiness of inputs from other sectors Outdated codes, standards and specifications Funding Cross-cutting issues with other sectors
Strategies in the immediate term are thus composed of the following: 1. Sustainable meteorological and hydrological baseline data collection; 2. Collaboration between engineers/planners with CC scientists on regional development scenarios and the data needed to analyze the impacts; and 3. Conduct inventory of existing infrastructure that may be at-risk from the effects of climate change. In the medium-term, the following strategies need to be conducted: 1. Develop coordinated adaptation plans to secure these assets based on specific climate change projections on the regions; 2. Review of existing building codes, specifications and standards; and 3. Draft design guidelines for new infrastructure that take into account anticipated CC impacts. Finally, long-term plans for the sector include: 1. Identify adaptation strategies for further study that are beyond the scope of individual stakeholders. i.e. technology, financing, land use patterns and economy; 2. Institutional Capacity Building/Integration to curriculum; and 3. Goals and efforts across sectors need to be harmonized. W ATER S ECTOR 13 The country’s water sector currently faces a lot of problems which global warming and the local CC impacts will further aggravate. For instance, nine major cities are already at risk of water shortage, and many areas are experiencing water supply shortages during the dry season. Only a third of the country’s river systems are classified as sources of public water supply and 50 (12%) of the country’s rivers are considered biologically dead (World Bank’s Philippine Environment Monitor, 2003). As much as 58% of groundwater sampled is already contaminated with coli-form and needs treatment. 13
Penaranda, I. October 2009. Proposed Adaptation Strategies: Water Sector. Paper Presented at the NATIONAL CONFERENCE ON CLIMATE CHANGE ADAPTATION + 2, October 26-27, 2009, Diamond Hotel, Manila, Philippines.
Resources, Environment and Economics Center for Studies, Inc. (REECS)
Page 24
The Table below identifies some of the key issues and gaps in the water sector and the accompanying capacity requirements it needs for CC adaptation. Table 15 Key Issues and Gaps for CCA in the Water Sector Key Issues Inadequate national and local capacity on CC adaptation and IWRM as an adaptation strategy Lack of updated scientific water resources information Lack of coherence in and conflicting water resources policies and plans at the national and local levels Ineffective water resources regulatory policy Inadequate public awareness of CC and water use consumption efficiency Inadequate knowledge on and access to CC adaptation technologies in the water sector Inadequate water sector financing for CCA and DRRM
Gaps •Capacity assessment •Research on water resources (supply and availability) •Regular monitoring of water quality •CC scenarios for water resources at local / river basin level •Harmonization of policies and development plans •Mainstreaming of water resources plans and CCA-DRRM •Harmonization of regulatory and oversight functions of various government agencies •IEC on CC and impacts on water resources •Research and development •Technology transfer •IEC on low cost technologies •Diversification and mobilization of financing sources •Innovative financing schemes •Incentive schemes
To address the issues and gaps, the following strategies have been formulated: 1. Building understanding and adaptive capacity on IWRM for CC adaptation at the national and local levels a. Strengthen the technical capacity of key national and local institutions on CCA and IWRM b. Build the capacity of communities and all sectors on CC adaptation and DRRM c. Build capacity for knowledge management d. Ensure access to knowledge systems on CC-IWRM e. Increase general public awareness on CC impact on water and potential CCA-DRRM measures 2. Reducing national and local vulnerability to climate change through no regret, low regret CCA measures a. Formulate alternative management mechanism of existing water supply i. small water impoundments vs. large dams ii. river basin / small island water resources mgt b. Adopt no regret, low regret options 3. Mainstreaming CC adaptation in water resources policies, plans and programs 4. Ensure sustainable water sector financing for CCA a. Encourage public-private sector partnership in IWRM and CC adaptation technologies b. Design NG-LG financing framework to encourage LGU investment in IWRM-CCA measures c. Mobilize and diversify financing sources Resources, Environment and Economics Center for Studies, Inc. (REECS)
Page 25
d. Design appropriate incentive systems to encourage investments in CCA measures Policy studies are needed for amending the Water Code and the Local Government Code for these laws to better address CCA strategies. Furthermore, a system of incentives for CCA has to be set up, guided by proper valuation of scarce water resources to guide the water pricing structure. The incentive scheme can encourage investments and mobilize financing in CCA technologies. D ISASTER RISK REDUCTION : L OCAL L EVEL A DAPTATION 14151617 There are several successful local level adaptation practices that are being implemented in various parts of the country. In the Bicol region, agricultural and coastal livelihood projects have been introduced simultaneous with proper solid waste management to address the problems that CC has caused on the local economy. In Iloilo, adaptation was tackled first by rooting out economic activities and community practices that were seen to exacerbate climate change impacts, then developing agricultural techniques that allowed farming to adjust to climate changes. What is common among all of these local examples is the emphasis on several fundamental steps to adapt to CC: 1) reducing risks through early warning systems and improving disaster response and; 2) improved infrastructure such as bridges, roads, shelter, seed banks, warehouses, food storage, etc.; 3) introducing livelihood activities that are not as susceptible to CC impacts; 4) proper solid waste management; and 5) continuing efforts to raise community awareness on global warming, climate change and vulnerability assessments at the community level.
FINDINGS: STATE OF ADAPTATION STRATEGY A nascent, evolving national framework for CC adaptation is already in place. There have been consultations, some general vulnerability assessments, and a growing list of concrete adaptation measures. Apparently, consensus is emerging on the identified needs for CCA and mitigation, such as information systems, sector research agendas, policy changes, institution and capacity building, sector programs and infrastructure. The lessons learned from local adaptation experiences also identify the following: 1) the need for local early warning systems and higher community awareness; 2) enhanced capacities to identify areas of climate risks to reduce and measures to improve disaster response; 3) local direct adaptation actions, such as climate–proofing existing livelihoods or introducing new livelihoods less susceptible to CC impacts, and investment in infrastructures and facilities; 4) programs indirectly related to CC impacts, or preventive of adverse secondary impacts of CC, such as the impact of floods and lack of solid waste management on health conditions. Given the above country list or inventory of activities and requirements for CCA and mitigation, these measures, researches, information systems, policy studies, strategies, agency programs, capacity14
Binoya, C. October 2009. Camarines Sur: Adaptation to Climate Change of Agriculture and Coastal Communities. Paper Presented at the NATIONAL CONFERENCE ON CLIMATE CHANGE ADAPTATION + 2, October 26-27, 2009, Diamond Hotel, Manila, Philippines. 15 Coastal Core, Inc. October 2009. DRR and Climate Change Adaptation in Coastal Communities Exposed to Climate Risks. Paper Presented at the NATIONAL CONFERENCE ON CLIMATE CHANGE ADAPTATION + 2, October 26-27, 2009, Diamond Hotel, Manila, Philippines. 16 Golez, R. October 2009. Climate Forecast Application in the Municipality of Dumagas, Iloilo. Paper Presented at the NATIONAL CONFERENCE ON CLIMATE CHANGE ADAPTATION + 2, October 26-27, 2009, Diamond Hotel, Manila, Philippines. 17 Tionko, A. October 2009. Adapting to a Changing Climate: Agricultural Community. Paper Presented at the NATIONAL CONFERENCE ON CLIMATE CHANGE ADAPTATION + 2, October 26-27, 2009, Diamond Hotel, Manila, Philippines.
Resources, Environment and Economics Center for Studies, Inc. (REECS)
Page 26
building and investment requirements all entail financial resources. Moreover, because of limited funds, they need to be further systematized, and the priorities have to be set. These are the initial steps in accounting for the costs of CCA and mitigation in the country. The initial systematic, qualitative listing of priority measures can then be compared with activities that are already in place and being funded by external, governmental or local financial sources. In turn, this would indicate which activities or requirements are being undertaken but are inadequately funded, on one hand, and those that have not been implemented or hardly funded, on the other. Existing project expenditures for particular activities may provide an estimate of the cost of increasing the scope or coverage, or scaling-up a potential priority measure. The DOE study, for instance, gives an estimate of the investment requirements for a 1% reduction of GHG emissions within a given period. The existing financial flows for CCA and mitigation from external and internal fund sources provide information on the costs of particular CC-related actions, the relative distribution of funds for particular activities or requirements, or the preferences of different fund sources. This may then be compared with the more desirable flow and allocation of funds. With the given or available activity costs, the total amount of desirable funds for CCA and mitigation can then be estimated. In sum, estimating the costs for CCA can be undertaken through the following steps: 1. Systematize and prioritize the list of adaptation measures for the country 2. Compare the list of priority measures with existing programs and projects that directly and indirectly address climate change adaptation 3. Determine which areas are inadequately funded based on the comparison of ideal and actual CCA measures 4. Use existing project expenditures to provide an estimate of the cost of increasing the scope or coverage, or scaling up of a potential priority measure a. Determine the relative distribution of funds for particular activities or requirements b. Determine preferences of different fund sources c. Estimate desirable flow and allocation of funds based on best available information d. Compare actual project costs with the desirable flow and allocation of funds 5. Estimate total amount of desirable funds for CCA
Resources, Environment and Economics Center for Studies, Inc. (REECS)
Page 27
FINANCIAL AND POLICY INSTRUMENTS FOR ADDRESSING CLIMATE CHANGE EXISTING FINANCIAL INSTRUMENTS In general, the documented financial flows that directly meet the challenges of climate change have taken the form of external grants and loans, government counterpart to external flows, and budgetary appropriations and disbursements. External grants have come from the following sources: 1) multilateral agencies like the World Bank, the Asian Development Bank, United Nations and the European Community; 2) bilateral or country donor sources; 3) the Global Environment Facility (GEF); and 4) foreign NGOs and foreign and local private foundations. External funds for relief from natural disasters may also be considered an external flow related to climate change impacts. External loan funds are accounted as an external flow, even if they will have to be paid with internally provisioned resources in the future because they provide a fresh supply of funds that are not locally available to address present climate change concerns. Government counterpart funds are locally raised resources to augment external funds and are drawn from budgetary appropriations. The coverage period of external grants and loans extend from 1992 to the present. Projects being supported by such funds this year and those planned to be undertaken within the 2009 to 2018 period are included. These external grants and loans have been classified as either directly addressing CC mitigation or adaptation or only indirectly related to CC adaptation or mitigation (A&M). The latter measures fund projects that address existing livelihood, health or current resource/ environmental management concerns, and they neither explicitly intend to bring GHG emissions down nor anticipate the impacts CC may bring for a particular sector or location. These flows are included because they may have the potential of being re-conceptualized and redirected to more direct adaptation or mitigation measures. There are a total of 558 grants and loan projects from the above sources that have come within the coverage period, consisting of 130 direct A&M projects and 428 indirect A&M (see Table 16). Bilaterals and multilaterals respectively have a total of 228 and 208 projects; majority of which are indirect A&M. The Table also shows the projects coming from the GEF (64), the GEF together with multilaterals (18), private foundations (24), and NGOs (16). If the 267 projects for relief from natural disasters are considered part of external flows, then the total number of projects is 825. Table 16 Number of ODA-funded Climate Change Related Projects, by Funding Category 1992-2018 Direct
Indirect
Relief
Grand Total
Bilateral
46
182
154
382
GEF
17
47
Multilateral
50
158
Multilateral-GEF
10
8
NGOs
5
11
51
67
Private/Foundations
2
22
8
32
Resources, Environment and Economics Center for Studies, Inc. (REECS)
64 54
262 18
Page 28
Grand Total
130
428
267
825
ON EXTERNAL GRANTS About $1.09 billion in grants for direct climate change mitigation and adaptation projects have flowed into the country. In Appendix 1, the list of adaptation or mitigation projects gives a profile of the type of CC measures being implemented in the country. Over the entire period, a greater amount of grants have gone to mitigation projects (636 million) compared to adaptation projects (370 million) (Table 17). And these grants for mitigation have come mainly from multilateral agencies (544 million), compared to bilateral sources (71.6 million). Most of the multilateral grants for mitigation flowed during the initial 1992-2003 period. Table 17 Comparative Flows of Total Direct Grants & Loans by Major Measure, by Funding Category, 1992-2018 Grants
Loans
Grand Total
Adaptation
369,847,995
586,592,639
956,440,634
Bilateral GEF Multilateral Multilateral-GEF NGOs Private/Foundations Aid/Relief
59,636,121 254,500 157,255,460 152,169,088 185,000 347,826 2,418,874
378,988,524 41,500,000 166,104,115 -
438,624,645 254,500 198,755,460 318,273,203 185,000 347,826 2,418,874
Bilateral Multilateral NGOs Private/Foundations Both
378,450 2,040,424 83,448,507
9,344,512
378,450 2,040,424 92,793,019
Bilateral Multilateral NGOs Private/Foundations Mitigation Bilateral GEF Multilateral Multilateral-GEF NGOs Private/Foundations Grand Total
22,705,528
9,344,512
32,050,040
41,742,979 19,000,000 636,385,385
491,635,179
41,742,979 19,000,000 1,128,020,564
71,617,180
110,522,125
182,139,305
3,580,105 544,160,302 11,965,000 62,798 5,000,000
329,427,855 51,685,199 -
3,580,105 873,588,157 63,650,199 62,798 5,000,000
1,092,100,761
1,087,572,329
2,179,673,090
Resources, Environment and Economics Center for Studies, Inc. (REECS)
Page 29
Multilateral agencies by themselves, and together with the GEF, have also respectively provided grants (amounting to 157 million and 152 million) for climate change adaptation projects, compared to bilateral contributions (59.6 million). While bilateral grants for adaptation declined from the 1992-2003 period to the 2004-2008 period, multilaterals grants together with GEF grew and comprised the greater portion (279.8 million) of the total grants for adaptation (369.8 million). Multilateral grants for adaptation from 2004 onwards grew, exceeding those for mitigation in the same period, and further widened the gap in the current 2009-2018 period, as grants for mitigation declined. In contrast to the multilateral and bilateral donors who account for at least 84.8% of total direct grants, the GEF or UN agencies (together with NGOs and private foundations) have played a minor grantprovisioning role. The low involvement of the GEF in grant provision prior to 2004 and its subsequent lower grant flows (Figure 2) compared to the bilateral and multilateral donations imply that the latter donors have more greatly influenced the direction of climate change adaptation work in the country compared to the GEF. The limited funds from the UNFCCC delivery vehicles, like the GEF, suggest that the criteria of predictability and adequacy of financing required under the Convention from the developed countries cannot immediately be ascertained.
Figure 2 Direct Grants for Mitigation and Adaptation, by Funding Category, by Period Within the same coverage period, another source of free funds has emerged separate from the adaptation or mitigation grants. Specifically to meet some of the disastrous impacts of natural disasters (floods, landslides, earthquake, etc.), about $120.5 million of direct grants for relief and assistance have flowed from bilateral and multilateral sources, together with NGOs and private foundations, to the victims of natural disasters. This trend in the provision of such grants is expected to increase over time.
Resources, Environment and Economics Center for Studies, Inc. (REECS)
Page 30
Table 18 Funds for Direct Aid/Relief for Victims of Natural Disasters by Funding Category, by Period Period
Amount, USD
Bilateral
85,222,368
1992-2003
1,272,594
2004-2008
70,558,340
2009-onwards
13,391,434
Multilateral
22,980,499
1992-2003
1,032,676
2004-2008
16,397,823
2009-onwards
5,550,000
NGOs
4,697,089
1992-2003
1,379,151
2004-2008
2,797,938
2009-onwards
520,000
Private/Foundations
7,636,441
1992-2003
-
2004-2008
1,075,650
2009-onwards
6,560,791
Grand Total
120,536,397
ON EXTERNAL LOANS Apart from providing grants (1.09 billion) for direct climate change adaptation or mitigation projects, multilateral agencies and foreign governments creditors have also supplied total loan funds (1.09 billion) for direct CC adaptation and mitigation projects. A slightly larger amount has been lent for direct adaptation projects (587 million) while loans for direct mitigation projects amounted to 492 million. While most of total credits for mitigation have come from both multilateral agencies and creditor countries, the total loan funds for adaptation have come mainly from bilateral donors (379 million) and multilateral-GEF (166 million) (Table 17).
EXTERNAL GRANTS AND LOANS INDIRECTLY RELATED TO CC A&M External financial flows also include project funds that finance actions that are indirectly related to climate change adaptation or mitigation. For instance, such indirect measures include projects on biodiversity/ environmental conservation, resource (fishery, forestry, watershed, coastal resource environmental, water quality) management, ecotourism, river rehabilitation, irrigation or water supply development, solid waste management, health and community development, etc. In other words, these projects address existing economic/ livelihood or resource/ environmental conditions, and they neither explicitly intend to bring GHG emissions down nor anticipate the impacts climate change may bring for a particular sector or location. While these development or environmental projects undoubtedly bring additional external funds into the country, these flows may potentially be tapped for climate change action if bilateral donors and multilateral creditors were to reorient their grants and loan objectives for Resources, Environment and Economics Center for Studies, Inc. (REECS)
Page 31
adaptation or mitigation. Given the greater amount of external funds that have flowed in for indirect climate change actions, there is indeed much potential. Over the entire period (1992-2018), total grants (1. 9 billion dollars), as well as total loans (1.6 billion) have flowed in greater amounts to projects indirectly related to climate change adaptation and mitigation (see Table 19) than to projects directly related to climate change action. Given this differential flow of both grants and loans to projects indirectly related to climate change adaptation compared to the projects that directly promote adaptation, it may be inferred that the country’s donors and creditors apparently favor the former type of indirect-adaptation projects. Table 19 Comparative Flows of Total Indirect Grants & Loans Loans by Major Measure, by Funding Category, 1992-2018
Adaptation Bilateral GEF Multilateral Multilateral-GEF NGOs Private/Foundations Aid/Relief Bilateral Multilateral NGOs Private/Foundations Both Bilateral Multilateral NGOs Private/Foundations Mitigation Bilateral GEF Multilateral Multilateral-GEF NGOs Private/Foundations Grand Total
Grants 1,725,544,098 850,945,776 108,461,864 646,036,070 101,684,900 2,706,903 15,708,585 185,093,121 62,004,130 123,008,991 80,000 3,792,000 3,792,000 1,914,429,219
Loans 1,266,686,965 99,493,889 1,059,791,424 107,401,652 333,860,779 60,777,780 273,082,999 1,600,547,744
Grand Total 2,992,231,063 950,439,665 142,463,516 1,705,827,494 175,084,900 2,706,903 15,708,585 518,953,900 122,781,910 396,091,990 80,000 3,792,000 3,792,000 3,514,976,963
Moreover, while most of the indirect grant flows (1.71 billion) and loan funds (1.38 billion) have gone to indirectly-related adaptation projects, the fund sources tend to prefer differing funding mechanisms. Bilateral donors and the GEF, for instance, have given more grants than loans, and they account for a Resources, Environment and Economics Center for Studies, Inc. (REECS)
Page 32
greater portion (56.2%) of total indirect grants, compared to the specific share of multilaterals (37.8%). On the other hand, multilaterals by themselves and with the GEF have preferred to extend more loans than grants, and they account for a greater portion (85%) of total indirect loans, compared to the bilateral and GEF (15%). It may be noted that it is with these indirect grants and loans that government provides counterpart funds. Out of the total indirect flows (3.75 billion), government counterpart funds amounted to US$ 238 million. Government funds consisted mainly of contributions to bilateral (110 million) and GEF flows (45 million), and a small portion (19.5 million) to multilateral with GEF flows (Table 20). Table 20 Total Funds for Indirect CC A & M, by Funding Category, in USD
Bilateral
Grants
Loans
GEF Grants
916,741,906
160,271,669
-
Government Counterpart 118,245,297
Grand Total 1,195,258,872
GEF
97,129,453
11,332,412
45,134,140
153,596,004
Multilateral
769,045,061
1,332,874,423
-
55,341,462
2,157,260,946
NGOs
2,786,903
-
-
-
2,786,903
Multilateral-GEF
94,684,900
107,401,652
7,000,000
19,520,000
228,606,552
Private/Foundat ions Grand Total
15,708,585
-
-
267,000
15,975,585
1,896,096,807
1,600,547,744
18,332,412
238,507,899
3,753,484,862
USE OF FUNDS To what sectors have the current flows gone? And are they adequate? In general, direct grants for mitigation which have mainly come from multilaterals have gone to energy and climate change. Grants to energy, for instance, have funded energy and lighting efficiency, development of wind energy, hydropower and non-conventional energy. Grants to climate change have funded GHG emissions inventory, solar energy, renewable energy, investment fund for pollution, biogas production and emission reduction, vehicle emission and methane reduction, capacity building and development of RE, and reforestation for carbon sequestration. Direct grants for adaptation which have come mainly from multilaterals and GEF have gone to climate change, disaster management, environment, agriculture, and water supply and sanitation. Specifically, the grants for CCA were for coral triangle bio-diversity protection, local government capacity building, and strengthening institutional capacity and watershed resilience to CC, vulnerability and risk assessment. Grants for disaster management were directed towards preparedness, early warning and monitoring, volcano and earthquake monitoring, hazard mapping, integrating risk reduction in local planning, research and communication, and hazard mitigation. Grants for the environment went, for instance, to environmental governance, private sector participation, research, and infrastructure. In turn the grants for agriculture supported renewable energy and livelihood development. Enabling activities at the national level were supported by UN grants such as drafting of National Communications, National Capacity Self-Assessment (NCSA), and the Asia Least-Cost Greenhouse Gas Abatement Strategy (ALGAS). Noteworthy is the absence of direct grants for mitigation measures.
Resources, Environment and Economics Center for Studies, Inc. (REECS)
Page 33
The direct loans for adaptation which came mainly from bilaterals went to climate change, environment and disaster management. Loans for CC, for instance, supported research on risk reduction in key sectors, adaptation policy coordination, and flood control. Direct loans for mitigation which came mainly from multilaterals and bilaterals went to energy. These funded the establishment of a wind farm, urban air quality improvement, renewable energy rehabilitation, sustainable energy finance, industrial energy efficiency, electric cooperatives, and the rehabilitation of a coal-fired power plant. Indirect grants for adaptation have come mainly from bilaterals and GEF, and they have funded the environment, forestry, land use management, and water and sanitation, fisheries and marine resources. Grants to the environment for indirectly-related CC activities have supported IEC, research on environmental management, accounting, policy support, solid waste management, ecotourism, reducing health care waste, and river and bay rehabilitation. Indirect grants to forestry have gone to natural resource management project, biodiversity conservation, protected area management, and topographic mapping. Grants for land use management went to remote sensing, mapping, policy and institutional support. Indirect grants to the water sector have gone to watershed and waste water management, and capacity building. Indirect grants to fisheries and marine resources have gone to natural resource management, sustainable aquaculture, coastal and marine resource development. Indirect loans for adaptation have come mainly from multilateral and GEF to support environmental management, river rehabilitation, forest development, irrigation system development, regional rural and community development, regulation of water providers, and integrated river basin management. While grants are allocated to broad sector categories, they address a particular CC impact or a problem it may aggravate. In the present period (2009-2019), for instance, grants to the environment, agriculture, biodiversity, energy, climate change, health, and water supply and sanitation in that order respectively address only a given problem or requirement, like solid waste management, resource conservation, production constraints, biodiversity loss, GHG emissions, institutional capacity, outbreak of infectious diseases, and water shortages (Table 21).
Resources, Environment and Economics Center for Studies, Inc. (REECS)
Page 34
Table 21 Ongoing and Proposed Grants by Impact Addressed, by Sector
Grants + GEF Grants
Biodiversity Loss
Constrained agricultural production
Damage to property
GHG emissions
Institutional capacity
Outbreaks of infectious diseases
Resource Conservatio n& Managemen t
Waste managemen t
Water shortage, water quality
Grand Total
Row Labels Agriculture
-
145,207,363
-
-
-
-
-
-
-
145,207,363
Biodiversity
80,977,966
-
-
-
-
-
4,896,000
-
-
85,873,966
Climate Change
-
5,783,000
-
30,000,000
32,094,429
-
-
-
-
67,877,429
Disaster Management Energy
-
-
30,290,506
-
2,020,000
-
-
-
-
32,310,506
-
-
-
79,993,557
-
-
-
-
-
79,993,557
Environment
-
-
-
-
-
-
194,340,340
6,177,436
-
200,517,776
Fisheries, Coastal & Marine Resources Forestry
-
925,000
-
-
-
-
57,011,436
-
-
57,936,436
7,360,000
-
-
-
477,890
-
7,214,887
-
-
15,052,777
Health
-
-
-
-
-
67,363,540
-
-
-
67,363,540
Land Use
-
-
-
-
-
-
19,972,200
-
-
19,972,200
Science and Technology Water Supply and Sanitation
-
-
35,635,676
-
-
-
629,870
-
-
36,265,546
-
1,000,000
-
-
-
-
40,280,725
6,400,000
11,200,000
58,880,725
88,337,966
152,915,363
65,926,182
109,993,557
34,592,319
67,363,540
324,345,458
12,577,436
11,200,000
867,251,821
Grand Total
Resources, Environment and Economics Center for Studies, Inc. (REECS)
Page 35
The limited objective of such grants is also reflected in the limited grant amount and the resulting project scale. The restricted scale, for instance, can be seen in an integrated area project that would cover at most only 2 cities/ municipalities; a provincial project involving only 2 inter-cities or municipalities; a regional project of 3 provinces; a watershed/ ecosystem project for only 1 province or 2 municipalities; or a nationwide project restricted to either only 6 to 7 provinces or 4 interregional areas, if not 10 inter-cities or municipalities (Table 22). The limited geographical coverage of grant projects would thus simply result in project benefits being confined to particular area niches. Interestingly, the limits set on the spatial coverage of projects are a consequence of the limited funds, a project piloting mode of introducing change, and the turfing among country donors and multilateral agencies. Table 22 Number of CC-Related Projects by Scale Grants Agency/internal Barangay/s City/Municipality Integrated Area InterCity/Municipality InterProvincial Interregional Nationwide Provincial Regional Watershed/ Ecosystem Grand Total
7 10 28 11 30 76 37 437 64 59 47 806
Loans
GEF Grants 1
7 1 12 33 6 24 9 6 9 107
4 1 9 2 5 22
Grand Total 7 11 35 12 42 113 44 470 75 65 61 935
With regards to loans, the flows differ from those of grants in terms of the ranking of the sectors, but the sector flows from both sources confine themselves to a particular impact or problem. For instance, the loans for the following broad sectors, i.e. energy, agriculture, environment, water supply and sanitation, disaster management, and fisheries respectively address particular impacts, like GHG emissions, constraints to production, resource conservation, water shortage and quality, and damage to property. Furthermore, the object of these loans is to effect technology transfer or provide financing (Table 23). Like the grants, the scale of loan projects seems to be more restricted, if not differing only in degree. A province or regional project may only be confined to one inter-city or municipality, while a nation-wide project covers either 3 provinces or 3 interregional ones. The much more limited scale of a loan project, compared to a grant, may suggest the creditor’s assessment of the limited capacity of the local or national government to pay.
Resources, Environment and Economics Center for Studies, Inc. (REECS)
Page 36
Table 23 Ongoing and Proposed Loans by Impact Addressed, by Sector Loans
Biodiversit y Loss
Constrained agricultural production
Damage to property
GHG emissions
Institutiona l capacity
Resource Conservation & Management
Waste managemen t
Water shortage, water quality
Grand Total
41,500,000
Outbrea ks of infectiou s diseases -
Agriculture
-
206,733,854
-
-
-
-
-
248,233,854
Biodiversity
-
-
-
-
-
-
-
-
-
-
Climate Change
-
-
-
-
-
-
-
-
-
-
Disaster Management Energy
-
-
79,835,000
-
-
-
-
-
-
79,835,000
-
-
-
380,504,054
-
-
-
-
-
380,504,054
Environment
-
-
-
-
-
-
192,633,600
-
-
192,633,600
Fisheries, Coastal & Marine Resources Forestry
-
-
-
-
-
-
66,988,052
-
-
66,988,052
-
-
-
-
-
-
5,777,780
-
-
5,777,780
Health
-
-
-
-
-
-
-
-
-
-
Land Use
-
-
-
-
-
-
18,995,300
-
-
18,995,300
Science and Technology Water Supply and Sanitation Grand Total
-
-
-
-
-
-
-
-
-
-
-
-
350,935
-
-
-
52,049,275
-
68,834,304
121,234,514
-
206,733,854
80,185,935
380,504,054
41,500,000
-
336,444,007
-
68,834,304
1,114,202,154
Resources, Environment and Economics Center for Studies, Inc. (REECS)
Page 37
If the country has limited borrowing capacity, the needed funds for CCA may only come from external multilateral and bilateral grants, apart from local financial resources. Are the external flows for CC then adequate? In general, the answer is an unequivocal no. The external financial flows are generally limited as reflected in the ratio of the direct and indirect flows for climate change in a donor country’s ODA and the ratio of its ODA to GNP. Based on available data, the ratio of climate change flows to ODA from Australia, the United States, Japan, and Germany ranges from 11.5 to 28.5 percent. Multiplied by their respective ODA-GNP ratio which fails to meet the target commitment of 0.7% of GNP, the resulting ratio of climate change flows to GNP would indicate if these donor countries would be able to meet the minimum 0.5 to 1% of GNP or the estimated required amount of resources to support adaptation, mitigation and technology transfer (South Centre, 2009). Over the period 2001 to 2007, the ratios obtained for the United States (0.01 – 0.03%), Australia (0.03 - 0.036%), Japan (0.04 – 0.05%), and Germany (0.04 – 0.05%) show that the bilateral flows from these country donors have been inadequate for meeting their climate financing commitments (Table 24). Table 24 Direct and Indirect Climate Change Flows over GNP (2003-2008) Direct & Indirect Flows for CC / ODA (in %)
ODA / GNP
Australia
11.5
0.25 – 0.32
CC Flows / GNP (Proposed = 0.5 % - 1%) (in %) 0.03 – 0.036
US
15.1
0.11 – 0.22
0.01 – 0.03
Japan
20.1
0.2 – 0.28
0.04 – 0.05
Germany
28.5
0.27 – 0.36
0.07 – 0.1
Donor Country
In the particular case of the Philippines, external flows from both bilateral and multilateral sources for direct and indirect climate change adaptation and mitigation may be adjudged limited when compared to the budgetary appropriations by the national government for climate change. Over the period from 2004 – 2009 (see Table 25), the Philippine government appropriated US$1.576 billion dollars for direct and indirect climate change programs in various sectors while the external multilateral and bilateral sources gave US$0.509 billion dollars in (direct and indirect) grants and US$0.354 billion in (direct and indirect) loans. One may even argue that the figures on the Philippine end may actually be bigger since loans are actually internally provisioned resources because they will have to be paid at some future time.
Resources, Environment and Economics Center for Studies, Inc. (REECS)
Page 38
Table 25 National Government Budget Allocations for Climate Change, in USD
Agriculture Biodiversity Climate Change Disaster Management Energy Environment Fisheries, Coastal & Marine Resources Forestry Land Use Science and Technology Water Supply and Sanitation TOTAL
2003/2004
2005/2006
2007
2008
2009
111,499,114 7,569,465 22,380 27,370,923 2,180,018 18,558,100 32,094,041 23,409,317 12,356,882 33,210 130,443 235,223,893 (1.59%)
73,230,418 8,998,284 24,309 108,797,145 12,258,564 32,475,436 8,066,836 24,169,309 36,364 22,844,818 32,727 290,934,212 (1.76%)
162,317,397 14,558,654 40,675 212,052,315 18,354,608 32,131,740 5,921,398 39,509,587 36,846 17,192,125 38,944 502,154,288 (1.96%)
27,653,476 10,495,298 278,065 120,982,587 5,824,319 9,452,328 18,371,834 52,622,452 10,270,101 1,410,011 23,847 257,384,319 (0.93%)
2,809,630 17,903,435 1,074,457 39,560,304 4,722,783 38,315,848 12,472,826 78,824,022 5,691,065 18,438,326 4,645,391 224,458,087 (0.7%)
Resources, Environment and Economics Center for Studies, Inc. (REECS)
Page 39
While significant vis-à-vis external funds, the budgetary resources set aside by the Philippine government for climate change may have not been adequate. First of all, they amount to only 0.9 to 1.9% of the country’s total budget. Second, while the total budget for climate change increased from 2004 to 2007, it dropped almost by half in 2008—all this time, the budgetary share of agriculture also declined from 47% to only 2%. Third, while the increase in the budgetary share of disaster management from 2003 to 2008 is most notable, it funded the necessary post-disaster relief and rehabilitation efforts. Fourth, while the only other sector share that has increased from 2007 to the present is forestry, it is not apparent how these budgetary allocations were used. Fifth, the budgetary appropriations do not include particular priority actions that would climate-proof critical socio-economic activities, and shield the most vulnerable/ poor groups from current and future climate risks. To date, there is no assessment of whether the priority projects supported by external grants cover all, if not most of the strategic action areas for mitigating the adverse impacts of climate change and enabling adaptation to them. It may be worthwhile to consider the proposed activities for promoting sustainable development and meeting the challenges of climate change proposed by the Alternative Budget Initiative (ABI) of NGOs and civil society. Estimates of the required additional budget in these proposed activities have also been made. For instance, the ABI proposes the following actions in the public land sector: (1) survey and delineate foreshore reservations, ancestral lands, geologically hazardous areas; (2) arrest the decline of forest cover and the loss, if not degradation of critical habitats and watersheds; and (3) close the open dumpsites and establish sanitary landfills in the 114 noncompliant municipalities. In the health and water sectors, some of the critical actions that should be undertaken would include intensification of epidemiology and disease surveillance, control of infectious diseases, local production of vaccines, prevention if not remediation of polluted groundwater sources, establishment of water impounding systems, and direct intervention in the unfunded critical water bodies of the Visayas and Mindanao. Other direct adaptation and mitigation strategies are currently being formulated both at the subnational and national levels of government and some local governments have gone forward and started the process of integrating CC into their respective development plans. These concrete strategic actions among the proposed activities may comprise the priority needs for a climate change program against which the potential impact of externally funded projects in advancing the country’s climate change-related agenda might be assessed. It must, however, be noted that in undertaking these initial priority actions, follow-through activities requiring greater political will and resources are imperative to realize the strategic goals for adapting to CC in the long-run.
POTENTIAL FINANCIAL INSTRUMENTS As presented in the earlier sections, current allocations for addressing CC are sorely lacking and are barely scratching the surface as far as the required funds for both mitigation and adaptation are concerned. There are, however, some initiatives that are underway that are worth noting.
FOREIGN FINANCING
Resources, Environment and Economics Center for Studies, Inc. (REECS)
Page 40
There are a number of upcoming Funds that specifically deal with climate change mitigation and adaptation. One is the Cool Earth Partnership funded by Japan which aims to fund up to US$ 8 billion for assistance in climate change mitigation, and up to US$ 2 billion for grants, aid and technical assistance for countries switching to clean energy18. For the loan component, preferential interest rates will be provided (0.2 – 0.6%) for projects that deal with either climate change mitigation or adaptation. The Iloilo Flood Control Project, for instance, is an adaptation project that has been funded through this facility, to enable the province to withstand floods within a 20-year return period 19. Another upcoming fund is the Climate Investment Fund (CIF) where Multi-lateral Development Banks (MDBs) have pledged at least US$6.1 billion. Managed by the World Bank and implemented jointly with the Regional Development Banks, i.e. the African Development Bank, the Asian Development Bank, the European Bank for Reconstruction and Development, and the Inter-American Development Bank, the CIF is an interim measure to scale up assistance to developing countries and strengthen the knowledge base in the development community. Another newly-approved program is the US$350 M Forest Investment Program (FIP) which will hopefully provide “much-needed upfront investment to developing countries and forest-dependent communities to help them prepare for and benefit from financial flows for the sustainable management of forests”. Under the program, degraded forests will be restored and managed on a sustainable basis, and investments will be made both within and outside the forest sector to reduce the pressure on the resource base.20 Another approved program under the CIF is the Clean Technology Fund (CTF) for which the Philippines’ Investment Plan has been recently approved. This Clean Technology Fund Investment Plan for the Philippines proposes CTF co-financing of $250 million to support Philippines’ efforts to transform the energy sector through scaled-up distributed generation with renewable energy resources to match the country’s archipelago configuration and address transmission constraints through demand side management. The Investment Plan will also implement the Government’s National Environmentally Sustainable Transport Strategy (NESTS), which aims to reduce energy consumption in the transport sector. Specifically, the Investment Plan proposes CTF co-financing for (i) catalyzing private sector investment in distributed generation through renewable resources and increasing the number of viable off-takers (Electric Cooperatives) for such renewable energy (RE); (ii) investment support and risk mitigation for the private sector’s entry into energy efficiency and cleaner production sectors; (iii) solar generation with net metering; and, (iv) introduction of Bus Rapid Systems in Cebu and Metro Manila. The CTF investments will mobilize financing of about $2.5 billion from the government, multilateral development banks, carbon finance and the private sector.21 Another potential source is the Coral Triangle Initiative (CTI) Program where the pledged funds have not been fully committed. Covering six countries in the Asia Pacific Region, it is one of the largest programs for CCA in the coastal and marine sector22. The GEF and the ADB are joining together to support the preservation of Asia’s Coral Triangle, with the GEF committing $63 million to fund conservation of “the 18
http://www.weforum.org/en/media/Latest%20Press%20Releases/PR_26jan_Japan http://www.wamis.org/agm/meetings/rsama08/S606-Noda-JBIC.pdf 20 World Bank, November 2009. http://beta.worldbank.org/climatechange/node/4964
19
21
http://www.climateinvestmentfunds.org/cif/sites/climateinvestmentfunds.org/files/ctf_investment_plan_philippines_final_keydoc_122309. pdf 22 The six countries that make up the Coral Triangle (CT) are composed of Indonesia, Malaysia, Papua New Guinea, Philippines, the Solomon Islands and Timor Leste. All six governments have committed to implementing the RPOA. In the Philippines, the government has officially adopted the Plan as the overarching framework in dealing with marine and coastal conservation and management.
Resources, Environment and Economics Center for Studies, Inc. (REECS)
Page 41
Amazon of the seas.” An objective of CTI ten-year Regional Plan of Action (RPOA) is to sustain and conserve dwindling and severely degraded marine resources, and undertake CC adaptation. A series of vulnerability assessments will be conducted and priority CCA steps implemented in the short-term period, even with the scientific uncertainties of future climate change impacts. Also, a range of management scales and frameworks, such as trans-boundary seascape management plans, integrated coastal zone management plans, and Marine Protected Area Network Plans will be established at the regional or country level. Other potential sources of funds being discussed at the international level include the assessed contributions of developed countries, such as 0.5% of their GDP commitment, the carbon market and private investments, share of proceeds from “flexibility mechanisms”, potential international levy on airfares, a 2% levy on capital transfers in Annex 1 countries, and fines on non-compliance of Annex 1 parties to upcoming agreements in Copenhagen.
SETTLEMENT OF CLIMATE DEBT23 The concept of climate debt is one solution being proposed by some NGO actors in the CC negotiations. Based on this argument, the most developed countries, i.e. the so-called Annex 1 countries are said to be mainly responsible for CC because of their carbon-intensive industrialization strategy for development. With less than 20% of the world population, developed countries account for more than 70% of historical emissions since 1850. Having consumed more than their fair share of environmental space, which has denied an equivalent level of development to developing countries, they owe the latter “Emission Debts”. They are also said to be accountable for the adverse impacts to poor communities and countries, i.e. their “adaptation debt” which may be measured by the sector losses and damages of the affected countries. Whether the government will take on this claim or tack as a threat or a means to generate more external funds through debt renegotiation or outright withdrawal of debt service payments for CCA and mitigation is a policy issue or option that the new Congress or cabinet may seriously deliberate upon in the future.
LOCAL FINANCING The Climate Change Act of 2009 (details of which are discussed more lengthily in the next sections) provides for an initial budget allocation for the operations of the Climate Change office and the Climate Change Commission in the amount of $1M. Unutilized funds allocated to the former Presidential Task Force on Climate Change and the Office of the Presidential Adviser on Global Warming and Climate Change, sourced from the President’s contingent fund, shall likewise be turned over to the Commission. All relevant government agencies and LGUs are likewise mandated to allocate from their annual appropriations adequate funds for the formulation, development and implementation of their respective climate change programs and plans. Apart from the fiscal/ tax incentives provided to Board of Incentives (BOI)-registered firms, government financial institutions have set up local facilities that cater to programs that directly address climate change. The Department of Finance has established the Disaster Management Assistance Fund (DMAF), a lending facility to LGUs whose objectives are to provide timely financial support to disaster risk and damage management initiatives of LUGs, enhance community resilience to natural hazards, promote 23
Freedom from Debt Coalition, October 2009. Debt Cancellation and Repudiation can and must finance Climate Adaptation and Disaster Recovery Measures. FDC Position Paper, 11 Matimpiin Street Barangay Pinyahan Quezon City.
Resources, Environment and Economics Center for Studies, Inc. (REECS)
Page 42
economic growth through disaster risk management, and attract supplemental funding from local and international donors. Eligible proposals for lending include disaster prevention and mitigation projects, response and relief related projects, and recovery and rehabilitation projects, all offered at very low interest rates between 3 and 5%. Other Fund features include concessional terms, no commitment charge, no pre-termination charge upon early payment, option for full cost financing and free technical assistance for project development. Similarly, the Development Bank of the Philippines (DBP) has set up funding windows for reconstruction and rehabilitation programs, mitigation programs that cover energy efficiency, solid waste management, pollution prevention and control and the DBP forest program, and a third program they have entitled “adaptation” that caters to renewable energy technologies, water resources, and the clean development mechanism. LGUs and Government Owned & Controlled Corporations (GOCCs) are eligible for these funding windows. Government may also enunciate public finance measures to generate funds for CCA. It may commit 0.5% to 1% of GDP, also as a challenge to bilateral donors among the Annex 1 countries. While it may also set levies on GHG emitters, road and port users, airline and shipping services, the legislature must amend the transfer of such tax revenues to the General Fund. Finally, the private sector is slowly emerging as a source of additional funding for CC A&M through their Corporate Social Responsibility (CSR) funds. In 2008 alone, the League of Corporate Foundations, which is made up of 70 operating and grant-making corporate foundations and corporations, together with the Philippine Business for Social Progress (PBSP) reported CSR contributions of USD 32 M (PHP 1.6 Billion) for environmental and sustainable development projects24, all of which contribute to CC A&M objectives. 1.2 billion pesos were reported by BPI Foundation under their Sustainable Energy Financing Program. The rest of the amount consists of tree planting and reforestation initiatives of about 13,000 hectares, energy efficiency, coastal clean-ups, watershed rehabilitation projects, eco-tourism and advocacy. Comparing CSR contribution with ODA loans and grants and government budgetary allocation in 2008, private sector financing represented 6% of total funds allocated to address direct and indirect adaptation and mitigation measures (Figure 3). The private sector can thus be encouraged to continue with such CSR programs, and hopefully the country can experience an increasing trend of CSR CC-related investments during the years to come as climate change impacts intensify and become more imminent.
24
League of Corporate Foundations, 2009. Social Investments Report: 2008. http://www.lcf.org.ph/
Resources, Environment and Economics Center for Studies, Inc. (REECS)
Page 43
Figure 3 Comparison of Funds for CC Related Programs, 2008
POLICY INSTRUMENTS POLICIES ADDRESSING MITIGATION In terms of policy, the country does not lack the necessary laws that aim to address both mitigation and adaptation measures to address climate change. The Climate Change Act (CCA) already provides a comprehensive law that addresses climate change. This complements the many existing policies discussed in the Overview. In the energy sector, the necessary policy framework to mitigate climate change impacts seems to be in place, consisting of the following: PD 1151 in 1977 known as the Philippine Environment Policy which was followed by PD 1586 in 1978 or the Philippine Environmental Impact Statement (PEIS), the Philippine Clean Air Act (PCAA) in 1999, the Biofuels Act in 2007, and the Renewable Energy Act in 2008. Other relevant laws relating to emissions include the Solid Waste Management Act, the Toxic Substances & Hazardous & Nuclear Wastes Control Act of 1990, and the Marine Pollution Decree of 1976.
POLICIES ADDRESSING ADAPTATION There are also many significant existing policies that may be related to CC adaptation measures, such as the Philippine Environment Code, Revised Forestry Code of the Philippines, Republic Act 8435 or the Agriculture and Fisheries Modernization Act of 1997, the National Integrated Protected Areas System (NIPAS) Act of 1992, the Philippine Mining Act of 1995, the Indigenous People’s Rights (IPRA) of 1997, the Fisheries Code of 1998, the Comprehensive Agrarian Reform Law, Environmental Impact Statement System, Water Code of the Philippines, and various administrative orders issued by individual government departments such as the DENR. Some policies may be site-specific, but they are comprehensive in nature to deal with CC-related problems, such as the Strategic Environmental Plan for Palawan Act (SEMP), the creation of the Laguna Lake Development Authority, and the Subic Watershed Forest Reserve Law. Furthermore, numerous watersheds have been designated all throughout the country as reserves either for strict protection or Resources, Environment and Economics Center for Studies, Inc. (REECS)
Page 44
for limited resource use. Other relevant programs that deal with forest and natural resources management outside protected areas include the Integrated Social Forestry (ISF) Program, the Community-Based Forest Management (CBFM) Program, the Ancestral Domains Program, Coastal Environment Program (CEP), Forest Land Management Program, Community Forestry Program (CFP) and the Socialized Industrial Forest Management Program (SIFMP). The CBFM is considered to be the national strategy for sustainable forest management and social justice, referring to all organized efforts of the government to work with local communities in and adjacent to public forestlands. It is seen as a key forestry program that can meet the challenges of climate change since its activities can alter the social and production system in the uplands, thus leading to either positive or negative impacts on the environment25. Another supportive policy is a pending bill in Congress that aims to address disaster risk reduction and management, called the DRRM Bill. The bill proposes the adoption of principles and strategies consistent with the international standards set by the Hyogo Framework for Action (HFA)26 - a comprehensive, action-oriented response to international concern about the growing impacts of disasters on individuals, communities and national development. It encourages the government to shift its focus to disaster prevention and risk reduction by putting more emphasis on strengthening the communities’ and people’s capacity to anticipate, cope with, and recover from disasters, as an integral part of development programs. Mainstreaming disaster risk reduction in the country’s policies, programs, and plans therefore lies at the very heart of the DRRM Bill.
25
Philippine Rural Reconstruction Movement (PRRM), October 2009. Second National Communication on Climate Change: Philippine SNC Project, Vulnerability and Adaptation Assessment Component. Quezon City, Philippines. GEF / UNDP PROJECT ID 00037339 26 The HFA was formulated and adopted by 168 governments at the World Conference on Disaster Reduction held in Kobe, Hyogo Prefecture, Japan in 2005. Center for Disaster Preparedness, Oct. 11, 2009. http://www.cdp.org.ph/features/drrm-bill/
Resources, Environment and Economics Center for Studies, Inc. (REECS)
Page 45
INSTITUTIONAL FRAMEWORK The multi-sectoral character of climate change necessitates a concerted effort among most government agencies in addressing both adaptation and mitigation. In effect, they all have a role to play in planning, implementation, monitoring and budgeting. With their mandates, the DENR and DOE have been the de facto lead agencies. Prior to the passage of the Climate Change Act, national government agencies involved in addressing climate change were subjected to a capacity assessment in dealing with climate change. Agencies were grouped according to the following roles: 1. Service agencies, composed of: DA, DepEd, DOH, DILG, DOLE, DND, DPWH, PAGASA, and PHILVOLCS 2. Technical service agencies 3. Regulatory agencies 4. Implementing agencies 5. Oversight agency, i.e. NEDA 6. Organizations for stakeholder mobilization, research and education Surveys were conducted to identify the agencies’ areas of capacities to: (1) engage multi-stakeholder dialogues; (2) assess a situation and create a vision and mandate; (3) formulate policies and strategies; (4) budget, manage and implement; and (5) monitor and evaluate. On a score of 1 to 5, agencies ranked highest in terms of engaging multi-stakeholder dialogues (with a mean score of 2.69). Capacity to assess a situation and create a vision and mandate scored almost equally with formulating policy and strategy (2.6 and 2.59, respectively). The agencies ranked lowest with respect to budgeting, managing and implementing the policies and strategies, as well as in monitoring and evaluation (2.46 and 2. 49, respectively). Overall mean score was 2.57. According to the rating system, a score of 2.00 means “capacity, strategy, or approach exists” but presumably has to be developed. Technical service agencies were considered as the most equipped, with an overall mean score of 2.97, followed by the sixth category of agencies at 2.75. Regulatory agencies were lowest with 2.09, followed by the oversight agency at 2.15. Finally, service agencies and implementing agencies were near the mean, at 2.61 and 2.34, respectively. The DENR is the main regulatory agency tasked to deal with climate change adaptation. In its own assessment, it admits there is still a lack of capacity in formulating policies mainly due to the lack of a national climate change framework, adaptation plan and strategy, as well as the absence of mainstreaming climate change adaptation in plans, programs and budgets. This, however, is true for all other agencies, according to the survey. There is not much experience yet in implementing CCA activities. Nevertheless, the increasing number of CCA projects in the department over the past 2 years underscores the recognition of the urgency to adapt to climate change. Furthermore, the designation of an Undersecretary for CC concerns within the department raises hopes that a major policy shift within can be expected soon. The low capacity levels of the regulatory and oversight agencies, and including some implementing agencies, however, may constrain the performance of the Climate Change Commission, while it is also expected to address many of the concerns enumerated in the capacity assessment. Resources, Environment and Economics Center for Studies, Inc. (REECS)
Page 46
Under the Climate Change Act, the Commission is tasked to formulate the country’s framework strategy which shall serve as the basis for a program for climate change planning, research and development, extension, and monitoring of activities to protect vulnerable communities from the adverse effects of climate change. As the overall agency that will ensure the mainstreaming of climate change into national, sectoral and local development plans and programs and that all climate change programs of national government agencies are coordinated and synchronized, the leadership of the Commission and its synergy with the regulatory, oversight, technical, service and implementing agencies will be critical, as well as the support of experts and critical stakeholders. Assisting the Commission and the advisory board is a panel of experts that will be made up of practitioners in disciplines that are related to climate change, including disaster risk reduction. The Panel shall provide advice to the Commission in climate science, technologies, and best practices for risk assessment and enhancement of adaptive capacity of vulnerable human settlements to potential impacts of climate change. Local government units will also play a major role in CC adaptation and mitigation. LGUs constitute the frontline agencies in the formulation, planning and implementation of climate change action plans in their respective areas. Barangays (villages) shall be directly involved with municipal and city governments in prioritizing climate change issues and in identifying and implementing best practices and other solutions. Mandated to carry out CCA as one of their regular functions, provincial governments must have technical capacity, enforcement and information management to support the municipalities and cities in their CC change action plans. In turn, the national government must have the technical and financial resources to assist the LGUs in the formulation and implementation of local CC action plans. The following specific roles of national government agencies suggest the capacity requirements they must possess: 1. DepEd shall integrate climate change into the primary and secondary education curricula 2. DILG and Local Government Academy shall facilitate the development and provision of a training program for LGUs in climate change 3. DENR shall oversee the establishment and maintenance of a CC information management system and network, including climate change risks, activities and investments 4. DFA shall review international agreements related to climate change and make the necessary recommendation/s for ratification and compliance by the government 5. Philippine Information Agency shall disseminate information on climate change, local vulnerabilities and risk, relevant laws, and protocols for adaptation and mitigation measures 6. Government financial institutions shall provide preferential financial packages for climate change-related projects Particularly for planning and implementing climate change adaptation strategies and programs, the Commission must thus avail and use the results of the Capacity Assessment Study conducted by the NEDA. The Assessment has come up with detailed action areas that aim to improve capacities of government agencies to deal with climate change, all of which can speed up the work of the Commission and make the institutions more efficient and effective in the long-run.
Resources, Environment and Economics Center for Studies, Inc. (REECS)
Page 47
LESSONS LEARNED With the onset of the international climate change framework through the UNFCCC in 1992, the country has had a number of initiatives in translating the framework into national programs and policies, along with the identification of institutions that will carry these programs and policies out. The Climate Change Act already provides a comprehensive law that addresses climate change. The Act complements the many existing policies that address both climate change mitigation and adaptation. It also creates a Commission that is tasked to formulate the country’s framework strategy which shall serve as the basis for a program for climate change planning, research and development, extension, and monitoring of activities to protect vulnerable communities from the adverse effects of climate change. As the overall agency that will ensure the mainstreaming of climate change into national, sectoral and local development plans and programs and that all climate change programs of national government agencies are coordinated and synchronized, the leadership of the Commission and its synergy with the regulatory, oversight, technical, service and implementing agencies will be critical, as well as the support of experts and critical stakeholders. A nascent, evolving national framework for CC adaptation is already in place. There have been consultations, some general vulnerability assessments, and a growing list of concrete adaptation measures. Apparently, consensus is emerging on the identified needs for CCA and mitigation, such as information systems, sector research agendas, policy changes, institution and capacity building, sector programs and infrastructure. The lessons learned from local adaptation experiences also identify the following: 1) the need for local early warning systems and higher community awareness; 2) enhanced capacities to identify areas of climate risks to reduce and measures to improve disaster response; 3) local direct adaptation actions, such as climate–proofing existing livelihoods or introducing new livelihoods less susceptible to CC impacts, and investment in infrastructures and facilities; 4) programs indirectly related to CC impacts, or preventive of adverse secondary impacts of CC, such as the impact of floods and lack of solid waste management on health conditions. Given the inventory of activities and requirements for CCA and mitigation, these measures, researches, information systems, policy studies, strategies, agency programs, capacity-building and investment requirements all entail financial resources. Needless to say, existing sources are definitely not enough to fund all these identified measures to enable the country to meet the challenges of climate change. At the local level, while significant vis-à-vis external funds, more government budgetary resources may be set aside for climate change and directed for the priority actions. The external financial flows are also generally limited as reflected in the ratio of the direct and indirect flows for climate change in a donor country’s ODA and the ratio of its ODA to GNP. Moreover, because of limited funds, A&M strategies need to be further systematized, and the priorities have to be set. Existing ODA investments can provide an indication of which sectors are already being funded, and which ones sorely lack financing. The initial systematic, qualitative listing of priority measures can be compared with activities that are already in place and being funded by external, governmental or local financial sources. In turn, this would indicate which activities or requirements are being undertaken but are inadequately funded, on one hand, and those that have not been implemented or hardly funded, on the other. Existing project expenditures for particular activities may provide an estimate of the cost of increasing the scope or coverage, or scaling-up a potential priority measure. Resources, Environment and Economics Center for Studies, Inc. (REECS)
Page 48
ODA investments are still seen to be the major source of financing CC A&M measures. The Cool Earth Partnership, CIF and CTI Programs are potential sources of CC funds, but one has to bear in mind that these funds will come in the form of loans which the country will have to settle at a certain point in the future. If the country has limited borrowing capacity, the needed funds for CCA may only come from external multilateral and bilateral grants, apart from local financial resources. Through appeals for a common humanity or the moral responsibility of Annex 1 countries, if not the possibility of debt cancellation, more external resources may be raised climate adaptation and mitigation needs. Finally, the report strongly recommends supporting measures being discussed at the international level which include assessed contributions of developed countries, such as 0.5% of their GDP commitment, the carbon market and private investments, share of proceeds from “flexibility mechanisms”, potential international levy on airfares, a 2% levy on capital transfers in Annex 1 countries, and fines on noncompliance of Annex 1 parties to upcoming agreements in Copenhagen.
Resources, Environment and Economics Center for Studies, Inc. (REECS)
Page 49
WORKS CITED Adams, M. (2008, January 26). Japanese PM unveils 10 billion dollar fund on climate change. Davos, Switzerland. Binoya, C. (October 2009). Camarines Sur: Adaptation to Climate Change of Agriculture and Coastal Communities. NATIONAL CONFERENCE ON CLIMATE CHANGE ADAPTATION. Manila. Center for Disaster Preparedness (CDP). (2009, October 11). Advocating the Disaster Risk Reduction Management (DRMM) Bill. Chan, F. (2009, October 23). Senior Program Officer, Poverty Reduction Section, Japan International Cooperation Agency. Coastal Core, Inc. (October 2009). DRR and Climate Change Adaptation in Coastal Communities Exposed to Climate Risks. NATIONAL CONFERENCE ON CLIMATE CHANGE ADAPTATION. Manila. Congress of the Philippines. (2003). General Appropriations Act, FY 2003 January 1 - December 31, 2003. Quezon City: Republic of the Philippines. ------------. (2005). General Appropriations Act, FY 2005 January 1 - December 31, 2005. Quezon City: Republic of the Philippines. Congress of the Philippines. (2007). General Appropriations Act, FY 2007 January 1 - December 31, 2007. Quezon City: Republic of the Philippines. -------------. (2008). General Appropriations Act, FY 2008 January 1 - December 31, 2008. Quezon City: Republic of the Philippines. -------------. (2009). General Appropriations Act, FY 2009 January 1 - December 31, 2009. Quezon City: Republic of the Philippines. Dacanay, M. (2009, October 23). In-house Consultant, Japan International Cooperation Agency. Daclan, M. (2009, October 20). Conservation Intenational - Philippines. Deparment of Energy, Philippine Nuclear Research Institute, National Power Corporation, National Electrification Administration, National Economic and Development Authority, and Philippine Council for Inudstry and Energy Research Development. (April 2009). Formulation of Sustainable Energy Development Strategies in the Context of Climate Change for the Philippiness. Echanove, J. (2009, September 7). Project Officer, European Commission. Freedom from Debt Coalition. (October 2009). Debt Cancellation and Repudiation can and must Finance Climate Adaptation and Disaster Recovery Measures. Quezon City: FDC. Resources, Environment and Economics Center for Studies, Inc. (REECS)
Page 50
Golez, R. (October 2009). Climate Forecast Application in the Municipality of Dumagas, Iloilo. NATIONAL CONFERENCE ON CLIMATE CHANGE ADAPTATION. Manila. http://www.wamis.org/agm/meetings/rsama08/S606-Noda-JBIC.pdf League of Corporate Foundations. (2009). Social Investment Report: 2008 Lim, M. (October 2009). Biodiversity, Coastal and Marine, and Forestry Sectors. NATIONAL CONFERENCE ON CLIMATE CHANGE ADAPTATION. Manila: PAWB-DENR. Manila Observatory. (2009). Final Report: Philippine Greenhouse Gas Inventory for the Year 2000. Quezon City. Navida, C. (October 2009). Adaptation to Climate Change and Conservation of Biodiversity in the Philippines. NATIONAL CONFERENCE ON CLIMATE CHANGE ADAPTATION. Manila: ACCBIO. National Economic Development Authority. (1992) 1st ODA Portfolio Review. National Economic Development Agency. Retrieved from http://www.neda.gov.ph. ----------. (1993) 2nd ODA Portfolio Review. National Economic Development Agency. Retrieved from http://www.neda.gov.ph. ----------. (1994) 3rd ODA Portfolio Review. National Economic Development Agency. Retrieved from http://www.neda.gov.ph. ----------. (1995) 4th ODA Portfolio Review. National Economic Development Agency. Retrieved from http://www.neda.gov.ph. ----------. (1996) 5th ODA Portfolio Review. National Economic Development Agency. Retrieved from http://www.neda.gov.ph. ----------. (1996) 6th ODA Portfolio Review. National Economic Development Agency. Retrieved from http://www.neda.gov.ph. ----------. (1997) 7th ODA Portfolio Review. National Economic Development Agency. Retrieved from http://www.neda.gov.ph. ----------. (1998) 8th ODA Portfolio Review. National Economic Development Agency. Retrieved from http://www.neda.gov.ph.
Resources, Environment and Economics Center for Studies, Inc. (REECS)
Page 51
----------. (1999) 9th ODA Portfolio Review. National Economic Development Agency. Retrieved from http://www.neda.gov.ph. ----------. (2000) 10th ODA Portfolio Review. National Economic Development Agency. Retrieved from http://www.neda.gov.ph. ----------. (2001) 11 th ODA Portfolio Review. National Economic Development Agency. Retrieved from http://www.neda.gov.ph. ----------. (2002) 12 th ODA Portfolio Review. National Economic Development Agency. Retrieved from http://www.neda.gov.ph. ----------. (2003) 13 th ODA Portfolio Review. National Economic Development Agency. Retrieved from http://www.neda.gov.ph. ----------. (2004) 14 th ODA Portfolio Review. National Economic Development Agency. Retrieved from http://www.neda.gov.ph. ----------. (2005) 15 th ODA Portfolio Review. National Economic Development Agency. Retrieved from http://www.neda.gov.ph. ----------. (2006) 16 th ODA Portfolio Review. National Economic Development Agency. Retrieved from http://www.neda.gov.ph. ----------. (2007) 17 th ODA Portfolio Review. National Economic Development Agency. Retrieved from http://www.neda.gov.ph. ----------. (2008) 18 th ODA Portfolio Review. National Economic Development Agency. Retrieved from http://www.neda.gov.ph.
Penaranda, I. (October 2009). Proposed Adaptation Strategies: Water Sector. NATIONAL CONFERENCE ON CLIMATE CHANGE ADAPTATION. Manila. Philippine Rural Reconstruction Movement (PRRM). (2009). Second National Communication on Climate Change: Philippine SNC Project, Vulnerability and Adaptation Assesment Component. Quezon City. Quibilan, M. (2008). Vulnerability of the Verde Island Passage to Climate Change. Conservation International - Philippines. Santiago, C. (2009, October 23). Climate Change Department, Japan International Cooperation Agency. Resources, Environment and Economics Center for Studies, Inc. (REECS)
Page 52
Social Watch. (2007). Alternative Budget 2008: Attaining the MDGs and Sustainable Growth with Equity. Philippines: Alternative Budget Initiative. Social Watch. (2008). Ensuring Sustainable Responses to Global Challenges: The 2009 Alternative Budget for Environmental Sustainability. Philippines: Alternative Budget Initiative. Social Watch. (2006). Imperatives of Real and Equitable Growth: An alternative Proposal for Financing the MDGs in the 2007 Budget. Philippines: Alternative Budget Initiative. Sorkin, L. (2009, September 18). Climate Change Coordination Unit, Regional and Sustainable Development Department, Asian Development Bank. South Centre. (2009). Developed Country Climate Financing Initiatives Weaken the UNFCCC. South Centre Global Governance Program for Development. Retrieved 2009, from www.southcentre.org. Tejada, S. (October 2009). Agriculture Sector Climate Change Adaptation Strategy within the Context of Devolution. NATIONAL CONFERENCE ON CLIMATE CHANGE ADAPTATION. Manila. Tionko, A. (October 2009). Adapting to a Changing Climate: Agricultural Community. NATIONAL CONFERENCE ON CLIMATE CHANGE ADAPTATION. Manila. United Nations Framework Convention on Climate Change. (2009). Investment and Financial Flows to Address Climate Change: An Update. Germany. Villar, E. (October 2009). Philippine Climate Change S & T Agenda in Agriculture, Forestry and Natural Resources Sectors. NATIONAL CONFERENCE ON CLIMATE CHANGE ADAPTATION. Manila. World Bank. (2009, October 20). Developed and Developing Countries Join Forces to Fight Climate Change with $350 Million in New Forest Financing. Washington, D.C. World Bank (2009, November 11). CTF Investment Plan for the Philippines. World Bank, Washington DC, USA. Yumul, N., & Servando, N. (2009). Observed Trends and Climate Change Scenarios for the Philippines. NATIONAL CONFERENCE ON CLIMATE CHANGE ADAPTATION. Manila.
Resources, Environment and Economics Center for Studies, Inc. (REECS)
Page 53
APPENDIX 1: LIST OF ODA PROJECTS ADDRESSING CLIMATE CHANGE Direct Adaptation Project Description
Project Cost (USD) 100,000
Funding Source ADB
Livelihood Development Project Integrated Water Resources Management Project Natural Resources and Environmental Management Coastal and Marine Resources Management Adapting to Climate Change
1,978,089 76,075,000 105,530,000 86,310,000
ADB ADB ADB ADB ADB, UN
Coral Triangle Initiative
442,837,500
ADB, USAID, UN
Disaster Preparedness and Emergency Response Vulnerability Assessment
5,530,231 125,000
AusAID CI
Tropical Forest and Climate Change Adaptation Climate Change and Conservation Air Quality Improvement
728,710 4,838,890 307,630,000
EC GTZ JICA
Agno River Flood Control Project (Phase II) Flood Control
73,128,088 30,287,234
JICA JICA
Flood Control and Drainage System Disaster Prevention and Reconstruction Flood Control
96,964,761 46,261,606
JICA JICA JICA
Earthquake and Volcano Monitoring Flood Control
14,920,000 68,512,787
JICA JICA
Flood Mitigation
2,845,737
JICA
4,500,000
JICA Netherlands
347,826 540,000 23,831,000 8,000,000 254,000 260,000 1,960,000 2,020,000
Toyota UK UK UN UN UN UN UN
1,400,000 439,000
UN UN
INREM
Strengthening Flood Management Environmental Improvement for Economic Sustainability Climate, Community and Biodiversity Climate Change and Rural Development Media Forum and Reporting Workshop Institutional Capacity to Adapt to Climate Change Maintenance and Enhancement of National Capacities First National Communication Program on Climate Change Hazard Mapping and Assessment Integrating Disaster Risk Reduction and Climate Change Adaptation in Local Development Planning Private Sector Participation in Managing the Environment Self-Assessment Exercise for Climate Change Enabling Activity
Resources, Environment and Economics Center for Studies, Inc. (REECS)
Page 54
Institutional Capacity
8,000,000
UN
current marine current exploitation technology Capacities for Climate Change Interagency Committee on Climate Change UACC Mainstreaming Disaster Risk Reduction Maintenance and Enhancement of National Capacities Integrated Risk Assessment and Monitoring Project-Awareness Enhanced Management of Renewable Natural Resources Klima Climate Change project
350,000 154,500
UN UN UNDP UNDP, EC UNDP-GEF UNEP USAID USAID
254,500 in-kind 4,800,000 409,073
Volunteers in Environmental Governance Coral Triangle Support Program PhilGARP
250,000 130,000
USAID USAID USAID
Philippine Climate Change Adaptation Program Environment and Natural Resources Management Climate Change Adaptation Phase 1: improve coordination of adaptation policy by DENR Implementing climate risk reduction Climate Change Adaptation Rural Development Phil. Climate Change Adaptation
7,170,000 50,000,000 1,500,000
WB WB WB
40,000,000 283,000 130,963,000 283,000
WB WB WB WB/GEF
Direct Mitigation Projects Project Description WIND FARM DEVELOPMENT Energy Efficiency Renewable Energy Renewable Energy Rural Electric Cooperatives Development Development of the Natural Gas Industry Rehabilitation of the Masinloc Coal Fired Thermal Power Plant Decentralized renewable energy systems Municipal Solar Infrastructure Reforestation project 10% Staff Salary Co-generation ECOPROFIT Policy Support Switch Asia Renewable Energy Quirino Carbon Project Phase 2
Project Cost (USD) 200,000 32,600,000 450,000 1,978,089 550,000 800,000 200,000,000
Funding Source
23,962 30,687,125 60,000 3,563 1,166,585 728,710 5,838,139 7,299,134 72,998,855 31,110
AECID AusAID CI CI EC EC EC EC EC GEC/MRI
Resources, Environment and Economics Center for Studies, Inc. (REECS)
ADB ADB ADB ADB ADB ADB ADB
Page 55
Reducing methane emission Hazard Mitigation Renewable Energy Monitoring System Quirino Protected Landscape Carbon Project renewable energy development New and Renewable Energy Phase out of CFCs-11 PELMATP Biogas Production Micro-Hydropower Biodiversity Conservation and Micro Hydropower Promotion and Development of Non-Conventional Energy Community-Based Watershed Management and Micro Hydropower Alternative Source of Energy Community-Based Renewable Energy Micro-Hydropower Renewable Energy Renewable Energy Renewable Energy Training Micro Hydropower Micro-Hydropower ALGAS Accelerated Renewable Energy AMORE I AMORE II ECAP
462,000,000 79,835,000
IRRI JICA
6,143,000 2,550,000 190,000 2,318,644 5,767 1,999 49,875 20,988
JICA KOICA RDP-People, PAs & Conservation UN UN UN UN UN UN UN UN
36,484
UN
49,511 2,000 41,131 38,783 4,032 2,000 8,142 49,642 8,137,000
UN UN UN UN UN UN UN UN UN USAID USAID USAID USAID
1,000,000 28,125
8,000,000 15,254,996 8,948,810
Global Climate Change Mitigation Philippine Climate Change Mitigation PEPP Philippine Renewable Energy Reduced Emission of Greenhouse Gases SEDP SEDP Clean Cities Project Vehicle Emission Reduction
24,000,000 8,500,000
894,000
USAID USAID USAID USAID USAID USAID USAID USAID
Vehicle Emission Control
400,000
USAID
TA on the National Forestation Photovoltaic Demonstration
139,000 5,800,000
USAID WB
Investments in Energy Efficient Chillers Monitoring and Verification
50,747,895 1,525,000
WB WB
3,400,000 8,183,464 8,183,464
Resources, Environment and Economics Center for Studies, Inc. (REECS)
Page 56
Technical Assistance Activities Project management
84,000 1,513,304
WB WB
Laguna de Bay Community Carbon Finance Geothermal Power Plant
358,450 700,000
WB WB
Northwind
42,000,000
WB
Ozone Depleting Substances Phaseout Philippines Sustainable Energy Finance Rural Power Project
2,700,000 25,300,000 500,000
WB WB WB
Ethanol plant wastewater biogas project Geothermal Power Plant
19,328,000 35,500,000
WB WB
Indirect Adaptation Projects Project Description Pasig River Environment Management and Rehabilitation Low Income Upland Communities Integrated Coastal Resources Management Irrigation System Efficiency Improvement Environment Management & Rehabilitation Sector Environmental Management and Rehabilitation Sustainable aquaculture Water District Development Sector Project Health Sector Development Credit for Better Health Care Water District Development Sector Project Irrigation Sector Irrigation Sector Forestry Sector Project Biodiversity Conservation and National Integrated Protected Areas Systems Integrated Coastal Resource Management Project - TA Fisheries Sector Program Loan - DENR Component Formulation of Environmental Quality Criteria and Standards in the Philippines Improving the Implementation of Environment Impact Assessment Project, Philippines TA for Evaluation on Environmental Standards for Selected Industry Subsector Environmental Management and Rehabilitation Irrigation Sector Proj Low-Income Upland Communities Project
Project Cost (USD) 1,941,000 36,000,000 62,320,000 1,000,000 63,000,000 800,000 573,000 1,500,000 13,000,000 50,000,000 50,000,000 60,000,000 3,149,014 55,000,000 600,000
Funding Source
930,000 9,988,250 625,000
ADB ADB ADB
in-kind
ADB
540,000
ADB
930,000 1,633,000 34,353,000
ADB ADB ADB
Resources, Environment and Economics Center for Studies, Inc. (REECS)
ADB ADB ADB ADB ADB ADB ADB ADB ADB ADB ADB ADB ADB ADB ADB
Page 57
Management, Supervision and Institutional Support to the IFP Program(Piggy-backed to the IFP) Philippine Forestry Development Project in Ilocos Norte (PFDPIN) Tree Improvement in Industrial Forest Plantation Program Loan for the Forestry Sector Integrated Area Development Agusan River Basin Development Advisory Technical Assistance on Environmental Impact Assessment Study on Rationalization of Water Tariffs for Private Utilities Phase 1 Preparation of the Forestry Master Plan Municipal Waste Management Advanced seminar on aquaculture Agriculture, Social Support, and Environment Facilities Integrated solid waste management Integrated Solid Waste Management Improvement of agricultural techniques Strengthening Environmental Impact Assessment Natural Resources Management and Development RP-Australian Remote Sensing Project Environmental Quality Criteria Development of Dessication and Moisture Standards for Selected Mangrove Species Local Sustainability Program FMD Eradication Project, Phase 2 International Agricultural Research WHO Roll Back Malaria Project Coastal Zone Environmental and Resource Management Project
728,000
ADB
32,300,000
ADB
580,000 120,000,000 2,455,000 1,390,000 300,000
ADB ADB ADB ADB ADB ADB
1,200,000 19,200 24,000 1,680,000 170,048 280,264 968,000 20,150,000 9,405,000 in-kind 5,000 33,823,320 9,200,000 3,800,000 3,000,000 100,000 5,010,990 1,987,000
ADB/FINNIDA AECID AECID AECID AECID AECID AECID AIDAB AIDAB AIDAB ASEAN-Canada ASEAN-CANADA Tree Seed Prog. AusAID AusAID AusAID AusAID AusAid
Philippines-Australia Human Resources Development Regional Office Environment PAHRDF Integrated Agrarian Reform IBAT for Marine Outcomes
9,600,000 24,420
Adopt-a-Species Program Human Well-being Eastern Mindanao Corridor Facilitation PhilSCAT hydrological processes in defining the bounds of management
31,889 100,000 290,000 7,000,000 23,030
AusAID AUSAID AusAID Belgium CELB- Business Practices CEMEX CEPF CEPF China CI
Integrated Site-Corridor Monitoring Project
15,000
CI
Resources, Environment and Economics Center for Studies, Inc. (REECS)
Page 58
CTI Tropical Marine PA Networks Building Local Capacity in Environmental Economics Environmental Security and Management Environment and Economic Management Urban Environmental Management Multiple Data Set Environmental Information System and Planning ASEAN Forest Tree Centre TYDAC-SPANS GIS Training International Provenance Trial of Casuarina Equisetifolia Pasig River Rehabilitation Program Improvement of EMB Laboratory Pasig River Rehabilitation Program Project Component-River Rehabilitation Secretariat Watershed Management Improvement Component Effects of Land Titling ARCBC ACB Building Forest Corridors Agricultural Development Agricultural Programme Community Forest Management Integrating Forest with Local Governance NIPAP Sharing and Promotion of Awareness Urban Environmental Resources Management and Food Security National Park Biodiversity Conservation utilization of plant genetic resources Cultural and Environmental Information Exchange International Scientific Cooperation Agroforestry and Watershed Management Philippine Rural Institutional Strengthening Programs(PRISP) EC-ASEAN Geodynamics Projects Toxic Chemicals and Hazardous Wastes Management RP-ERSDAC National Integrated Protected Area Project Forest Resources Assessment Project Forest Fire Management Project Production of Superior Seeds and Propagules of Priority Tree Plantation Species Sustainable Forest Management, Poverty Alleviation and Food Security in Upland Communities
8,000 34,723 2,018,945 760,000 8,640,000 9,964,649 551,000
CI CI CIDA CIDA CIDA CIDA CIDA
14,500,000 3,000 79,550,000 1,020,000 2,623,480 5,329,920 1,090,000 698,000 10,362,600 728,710 707,256 9,420,200 16,169,000 1,391,940 1,712,573 31,440,000 1,427,144 344,470
CIDA CIDA CSIRO DANIDA DANIDA DANIDA DANIDA DANIDA DRDAP EC EC EC EC EC EC EC EC EC EC
927,644 294,916 589,737 1,098,673 442,360 6,008,000 89,000 950,000 291,780 15,142,000 204,000 393,000 53,000
EC EC EC EC EC EC EC EEC ERSDAC EU FAO FAO FAO
165,000
FAO
Resources, Environment and Economics Center for Studies, Inc. (REECS)
Page 59
APAN - Philippine Secretariat Globally Important Agricultural Heritage System (GIAHS) Restoration/Rehabilitation of Waterways DENR-Upland Development NAMRIA/SCOT CONSEIL Methodology and Training and Monitoring of Deforestation Using Satellites National Cartographic Center Project Mt. Mantalingahan Establishment of the Mt. Mantalingahan Protected Landscape protected area Technical assistance for developing sustainable financing mechanism Globally Important Agricultural Heritage System Community Forestry Project in Quirino EnRD Integrated solid waste management sustainable management of natural resources sustainable management of natural resources Protection of Water Catchment Areas Integrated Resource Management solid waste management Coastal Resources and Fisheries Management Program for Applied Tropical Ecology Water supply and waste water management Water supply and waste water management Water supply and waste water management Water supply and waste water management Water supply and waste water management integrated management rehabilitation multi-stakeholder partnerships project management Support to the Implementation of Executive Order No. 247 Visayan Sea Coastal Res. & Fisheries Mgt. Advisory Support to the ENR Sector - TA Sustainable Management of Natural Resources Price Policy for Public Goods, Philippines (Study on Raw Water Pricing) Development of Knowledge Management Portal for Water Supply and Sanitation Development of the Water Supply Sector Roadmap Strengthening of Verde Passage enforcement Verde Passage
5,020,000 2,000,000 434,783 533,000 6,737,000 630,000
FAO FAO/GEF Finland Ford Foundation France France
5,734,000 491,771 155,000
FRG/GTZ GCF GCF
25,000
GCF
15,000 7,563,000 8,350,800 2,559,726
GEF-FAO GTZ GTZ GTZ GTZ GTZ GTZ GTZ GTZ GTZ GTZ GTZ GTZ GTZ GTZ GTZ GTZ GTZ GTZ GTZ GTZ GTZ GTZ GTZ
1,675,636 3,560,000 1,950,000 2,010,000 1,630,000
3,473,054 4,694,032 5,291,180 1,831,680 1,800,365 80,000 120,370 1,951,000 6,279,430
GTZ
7,500 7,500
Resources, Environment and Economics Center for Studies, Inc. (REECS)
GTZ Henry Foundation Henry Foundation
Page 60
Ulot Watershed Model Forest
28,150
Agricultural Resource Mgt. Documentation support Corridor Learning Initiative Production and Utilization Technologies for Rattan Sustainable Development Adoption and Implementation of the Forestry Information System (FIS) in the Philippines Adoption and Implementation of an Appropriate System of Criteria and Indicators (C & I) for the Philippines Forestry Statistics Information System Developing Tropical Forest Resources Through CBFM Pre-Project Proposal on the Development of the Forestry Statistics Information System Critical Habitat Management, EMBC, Philippine eagle Economic Valuation of Impacts of Environmental Degradation
5,875,620 8,000 5,625 899,870
IDRC-Canada thru IMFNS IFAD ITPI ITPI ITTO
707,890
ITTO
620,080
ITTO
425,280 858,520 71,000
ITTO ITTO ITTO
116,060 90,000
Economic Incentives to Promote Water Pollution Prevention and Abatement Training and Information, Education and Communications (IEC) Plan for Industrial Efficiency and Pollution Control Preparation of Industrial Common Treatment Facilities and Waste Abatement for Individual Enterprises Preparation of Regional Resource Management Studies
150,000
IUCN-Netherlands Jap. Grant Fac.,CTF ofKorea,WB Japan TA Grant
85,000
Japan TA Grant
320,000
Japan TA Grant
1,432,000
92,306,022 22,088,288 17,391,304 476,000
Japanese grant thru WB JBIC JICA JICA JICA JICA JICA JICA JICA JICA JICA JICA JICA JICA JICA
7,700,000 3,840,000
JICA JICA
Ecological Solid Waste Management Plan Integrated Coastal Zone Mgt. Special Economic Zones Environment Mgt. Environmental Management After-care Cooperation Forestry Development Capacity Development Community-Based Forest Management Local Governance and Community Empowerment Toxic Red Tide Solid Waste Management Pasig Marikina River Channel Improvement Sustainable Environmental Management Water Revolving Fund Technology Development for Electronic Navigational Chart (ENC) in the Philippines Rural Environmental Sanitation Project for the Enhancement of CBFM Program in the Philippines
in-kind 30,340,160 4,910,000 10,920,000 825,240 5,011,640
Resources, Environment and Economics Center for Studies, Inc. (REECS)
Page 61
National Database System for Watershed Information & Dev't. of Guidelines Master Plan Study for Integrated Watershed Management Marikina Watershed Development Project, FS Agroforestry Scheme for Profit and Conservation Mapping Policy and Topographic Mapping Enhancement of Hydrographic Capabilities Mapping & Land Cover Assessment of Mangrove Areas Acquisition of Magnetic Observation Equipment Technical Cooperation in Hydrographic Surveying and Nautical Charting Improvement of the Meteorological Radar System Short Term Expert on IWRM Study on IWRM for Poverty Alleviation and Economic Development for the Pampanga River Basin Community-Based Forest & Mangrove Mgt. Project in Panay & Negros - FS Research on Philippine Eagle Phil Eagle Safety and Control of Toxic Chemical and Hazardous Wastes
in-kind
JICA
in-kind 1,473,000 6,061,000 4,690,000 70,000 1,810,000 in-kind in-kind
JICA JICA JICA JICA JICA JICA JICA JICA
35,635,676
JICA JICA JICA
236,000
KFW
21,182 22,523 612,000
KNCF KNCF Korea, Sing., China, Malaysia. Phils. Margot Marsh
Field Methodology for Tarsier Research
5,000
Tarsier action planning workshop Triple Benefit Type CDM Feasibility Study
25,000 33,610
Assessment of the Marine Resources of Tikling Island - A Proposed Marine Park/Reserve EX-SITU Genebank for Philippine Teak
6,000
Land use analysis and boundary delineation in Quirino
15,000
Sustainable Development of Laguna de Bay Environment Marine Environmental Masterplan for the Philippines TA on the Waste Management Plan for Cebu Sustainable Integrated Rural Development Industrial Plantation Project Inter-Institutional Linkages
1,690,000 346,000 607,000 228,970 18,613,140 5,000,000
Verde Passage Enforcement Work Support to Philippine Maritime Claims under UNCLOS Bioecological, Social and Economic Assessment of Assisted Natural Regeneration (ANR) as an Approach to Forest Cover Restoration
59,612 285,000 43,630
Resources, Environment and Economics Center for Studies, Inc. (REECS)
Margot Marsh Mitsubishin Research Institute NAGAO NAGAO, Nat. Env. Foundat'n Jap National Philanthrophic Trust Netherlands Netherlands Netherlands New Zealand New Zealand New Zealand Government NFWF NORAD NRMP/USAID
Page 62
Forest Concept In Critical Watersheds and Forest Reserve Areas
76,320
NRMP/USAID
Coastal Resources Management National Eco Tourism Plan PNOC Social Forestry Project National Ecotourism Programme – Phase II Project Enhancing Natural Resources Management through Enterprise Development Tubbataha Reefs National Marine Park and World Heritage Site 1 Support for the 3rd National PHE Conference
2,174,880 112,000 1,340,000 847,220 302,400
NZAID NZAID NZAID NZAID NZAID
385,777
Packard
28,582
SMBC Conservation of KBAs
20,682 159,839
Quirino PDD Potential NTFP Asset Engineering and Management Credit Facility ENVIRONMENTAL MANAGEMENT FOR SUSTAINABLE DEVELOPMENT Municipal Environmental Protection and Solid Waste Management Project Micropolis Solid Waste Management Solid Waste Management Solid Waste Management and Sanitary Landfill Modernizing Environmental Management International Coral Reef Initiative Project Establishment of an ISO 14001-based EMS at the DENR Industrial Restructuring Program Industrial Restructuring Program: Environment Component Leachate Pollution from Open Dumping Sites in Metro Manila Develop GIS for Local Government Units - TA RWATERSHED AND BIODIVERSITY CONSERVATION Joint Research & Monitoring Large Marine Ecosystem and Adjacent Area Sustainable Fisheries Oceanic Fisheries Management Fisheries Bycatch Management Accelerating the Response to Malaria Advancing Malaria Control Towards Elimination By 2020 malaria control Malaria Control Capacity Building Needs for Biodiversity Conservation and
28,125 7,500
Population Reference Bureau Ricoh Foundation RNHP-Australian Government RPD/PPC SANREM/USAID SIDA SIDA SIDA
10,000,000
SIDA 410,000
2,426,830 238,000 in-kind 400,000 950,000 400,000 1,478,261 150,000 6,310,000
SIDA SIDA SIDA SIDA SIDA SIDA SIDA SIDA SIDA SIDA Toyota Toyota UN
333,333 9,700,000 11,828,587 4,563,148 14,340,684 12,800,392 197,000
UN UN UN UN UN UN UN
Resources, Environment and Economics Center for Studies, Inc. (REECS)
Page 63
Management environmental assessment CHM support via add-on modules implementation of measures for in-situ and ex-situ conservation for sustainable use initial assessment and monitoring programs, including taxonomy Assessment of Capacity Building Needs for Biodiversity Conservation and Management in the Philippines: conservation and sustainable use of biodiversity important for agriculture
256,350 36,300 30,450
UN UN UN
33,800
UN
25,400
UN
preservation/maintenance of biodiversity related knowledge of indigenous and local communities consultations for the 2nd National Report Assessment of Capacity Building Needs for Biodiversity Conservation and Management in the Philippines: countrydriven project for participation in CHM
27,150
UN
13,500 27,050
UN UN
Bantay Dagat Biodiversity Conservation and Management of the Bohol Islands Marine Triangle environmental protection and management of East Asian seas
2,120,000 1,380,000
UN UN
28,545,000
UN
Community-Based Ecological Solid Waste Management Tubbataha Reefs National Marine Park and World Heritage Site
426,000 749,714
UN UN
Public-Private Partnerships in Environmental Investments Sustainable Development of Ancestral Domain Sustainable Agriculture Towards Poverty Reduction Environment and Natural Resources CORE Programme Environment and Natural Resources CORE Programme II
1,808,000 10,000 370,000 111,000 1,264,000
UN UN UN UN UN
Environmental Justice Project Sustainable Livelihood Component Expanding and diversifying the national system of terrestrial protected areas multi-stakeholder mechanisms to promote global environmental priorities SDS-SEA Sustainable Development of the Ancestral Domain NCSA Mainstreaming in local agricultural landscapes Institutional capacities for decentralized governance Mainstreaming key ecosystems Mainstreaming key ecosystems PEMSEA
1,309,607 770,000 7,360,000
UN UN UN
750,000
UN
44,250,736 43,712 299,960 2,500,000 2,300,000 7,850,000 950,000
UN UN UN UN UN UN UN UN
Resources, Environment and Economics Center for Studies, Inc. (REECS)
Page 64
Biodiversity Biodiversity Local Environmental Planning and Management Sustainable Fisheries Management Support to Fisheries Resource Management SUMMIT monitoring and data enhancement policy, institutional strengthening and fishery management project management Community-Based Resource Management Community-Based Watershed Management Greenwell, Landcare and Biodiversity Project
12,882,890 1,680,000 2,584,000 185,000 2,048,000 2,230,000 1,152,333 1,677,333 295,333 43,911 42,412 49,646
UN UN UN UN UN UN UN UN UN UN UN UN
Indigenous Resource Management System Sustainable Development Program Sustainable Management of Coastal Resources and Seaweed Production Reef Monitoring and Evaluation Coastal Marine Reserve Management and Development Coastal Resource Development and Management Coastal Resource Management Initiatives Gaynawaan Project Integrated Resource Restoration System Community-Based Resource Management Integrated Coastal Enhancement Resource Management Community Resource Development Biodiversity Conservation and Policy Formulation Global reduction of environmental impact from tropical shrimp trawling Reversing degradation trends in the South China Sea Strategies for Fisheries Bycatch Management policy and decision framework development and demonstration monitoring and evaluation roll-out of bycatch management reduction communication awareness
1,587 7,658 35,739
UN UN UN
46,384 49,902 34,005 39,412 38,783 38,783 28,182 36,188 27,713 41,543 8,700,000
UN UN UN UN UN UN UN UN UN UN UN
35,684,000 9,521,330 1,323,585 2,650,205 976,520 1,973,585 1,667,715
UN UN UN UN UN UN UN
92,390 -
UN UN
project management Environmental Management for Industry Competitiveness (EPIC) Project Enhancing Access to and Provision of Water Services with the Active Participation of the Poor integrated coastal management policy framework PRIME Convergence for Solid Waste Co-Governance
UN 300,000 1,743,000 173,300
Resources, Environment and Economics Center for Studies, Inc. (REECS)
UNDP UNDP UNDP Page 65
Environmental Improvement Study Improved Productivity of Man-made Forest Sustainable Forest Management, Poverty Alleviation and Food Security in Upland Communities UNDP/FAO Bamboo Research and Development Project Environment and Natural Resources Capacity and Operations Enhancement ENR-SHELL Program Empowerment of IPs for Sustainable Management of Ancestral Domains Human Resources Development in Environmental Planning and Management Integrated Environmental Management for Sustainable Development Landuse and Land Cover Using Remote Sensing and Geographic Information System MEIP
250,000 78,000 165,000
UNDP UNDP UNDP
1,666,000 1,333,740
UNDP UNDP
851,700 70,000
UNDP UNDP
693,000
UNDP
4,526,000
UNDP
124,000
UNDP
4,600,000
UNDP-FAO Strengthening of the ISF Programme Manila Bay Environment Management Project
1,733,680 2,639,000
UNDP & other multi-bilateral UNDP/FAO UNDP/GEF
Strengthening Coordination for Effective Environmental Management Master Plan on Water Resources Management Economic Valuation of Groundwater in Metro Manila Project
990,000
UNDP/GEF
Biodiversity Project Prevention and Management of Marine Pollution National Capacity Self-Assessment Environmental Management in Pulp and Paper Industry Network for Industrial Environment Management Preparation of the National Integrated Water Resources Management (IWRM) Plan Framework Reversing Environmental Degradation Trends Review of the Water Code of the Philippines for Possible Amendments National Biosafety Framework for the Philippines Integrated Water Resources Management Coastal Environmental Management Plan Population-Environment IEC Programme Coastal Resource Management Project Coastal Resource Management Support Coastal Resources and Fisheries Conservation FISH Legal Assistance to Coastal Based Natural Resources Management
350,000 8,000,000 200,000 in-kind 14,700
UNDP-GEF UNDP-GEF UNDP-GEF UNEP UNEP UNEP
335,630
UNEP/GEF UNEP/NAST/DOST
275,790
UNEP-GEF UNESCAP UN-ESCAP UNFPA USAID USAID USAID USAID USAID
UNDP-ENRCORE UNDP-ENRCORE
982,000 18,249,000 470,000 2,800,000 1,400,000 250,000
Resources, Environment and Economics Center for Studies, Inc. (REECS)
Page 66
Mapping of Conservation Demographics Natural Resource Management PBC PSA Commercial Biotechnology Application Water Revolving Fund Support Volunteers for Environmental Governance Healthy Families, Healthy Forests US-Asian Environmental Partnership (US-AEP) IEMP Local Development Assistance Program Livelihood Project for the On-Going Community Forestry Program Environmental and Natural Resources Accounting Project Environmental and Natural Resources Accounting Project Enhancement of Processing Water Permit Application, Billing and other Related Information System Water Resources Regional Council Strengthening of Water Sector Regulation
480,000 255,700,000 544,800 1,400,000 2,000,000 5,000,000 325,000 321,000 28,000 20,000,000 153,580 6,000
USAID USAID USAID USAID USAID USAID USAID USAID USAID USAID USAID USAID
815,000 1,611,000
USAID USAID USAID
Coastal Resources Fisheries Conservation (CRFC)
950,000 18,249,000
Coastal Resource Management Project (CRMP) Transforming the Marine Aquarium Trade (TMAT) Natural Resources Management Program Environmental and Natural Resources Accounting Project Environmental and Natural Resources Accounting Project TRP on the Conceptualization and Design of Selected IEC Materials for ISF/Production of Radio Drama in Support of ISF Program Feasibility Study on the Industrial Air Emission Source Project Sulu-Sulawesi Seascape
821,000 164,487,000 473,000 669,000 120,000
337,000 9,287,497
USAID USAID USAID USAID USAID USAID USAID-TRP USAID-TRP USAID-TRP
Improving Biodiversity Conservation in Protected Areas
1,500,000
USTDA Walton Family Foundation WB
Water Resources Dev. Project - Watershed Management Improvement Component Environment and Natural Resources Sectoral Adjustment Loan Program LAMP II LAMP Community-Based Resource Mgt. Project Governance & NRM Sector Study - TA Performance Improvement and Benchmarking of Small Towns Water Utilities Expansion of Benchmarking of Towns Water Utilities in the Philippines
8,400,000
WB
101,800,000
WB
41,252,400 10,587,800 1,000,000 50,000
WB WB WB WB WB
Resources, Environment and Economics Center for Studies, Inc. (REECS)
WB
Page 67
Registration and Regulation of Water Providers Strengthening the Environmental Performance Monitoring and Evaluation System Manila Third Sewerage Project (MTSP) Manila Third Sewerage Project (MTSP) - TA Environment and Natural Resources Management Project
250,000
WB WB – IBRD – IDF
5,000,000 350,000 57,000,000
WB/GEF WB/GEF WB/GEF
Integrated Protected Areas System for the Philippines
2,900,000
WB/OECF
Biodiversity Cons. Coastal & Marine Biodiversity Component
350,000 1,700,000
WB-GEF WB-GEF
NPS-ENRM
615,000
Manila Bay Monitoring Program Community-Based Resource Management Environmental and Natural Resources Sector Adjustment Asian Conservation Foundation conservation management conservation enforcement information, education, communication sustainable livelihood strategies institutional and financial stability biodiversity research and monitoring Conservation of Priority Protected Areas Environment Monitoring Pollution Reduction in the Large Marine Ecosystems Community Watershed Rehabilitation Environment and Watershed Management Marine Aquarium Market Transformation initiative Coastal and Marine Ecosystem Conservation
104,000 35,520,000 158,000,000 21,290,000 630,000 1,140,000 970,000 420,000 420,000 630,000 22,870,000 40,000 12,040,000 2,955,000 1,760,000 1,000,000 55,000,000
WB-GEF/PHRD GRANT WB-IBRD World Bank World Bank World Bank World Bank World Bank World Bank World Bank World Bank World Bank World Bank World Bank World Bank World Bank World Bank World Bank World Bank
41,250,000 4,400,000 84,000,000 32,000,000 10,500,000 57,300,000 4,600,000 107,000,000 408,000 158,596,000
World Bank World Bank World Bank World Bank World Bank World Bank World Bank World Bank World Bank World Bank World Bank World Bank World Bank
38,000,000
World Bank
Rural Infrastructure Community Funds for Agricultural Development Institutional Building and Capacity Development Coastal and Marine Biodiversity Conservation Environment and Natural Resources Management Policy, planning monitoring and evaluation Integrated ecosystem management Environmental Management and Enforcement Expenditure planning and management Operationalizing RD/NRM PMI System Participatory Irrigation Development PHRD-Capacity Building PHRD-Capacity Building in Social and Environmental Assessments PHRD-Strengthening Environmental Enforcement
Resources, Environment and Economics Center for Studies, Inc. (REECS)
Page 68
River Basin and Watershed Management Project Subic Bay Water TA for Improving Biodiversity Conservation Urban Water and Sanitation Urban Water and Sanitation Urban Water and Sanitation Urban Water and Sanitation Urban Water and Sanitation Urban Water and Sanitation Institutional Strengthening and Community Participation co-managed micro-watershed environmental interventions capacity-building of stakeholders at micro-watersheds project coordination support LAMP 2 Tubbataha Reefs National Marine Park and World Heritage Site 3 Debt for Nature Swap Program
25,300,000 37,000 259,000 502,000 48,356,000 30,000 3,500,000 19,840,000 1,670,000 12,200,000 1,650,000 4,000,000 2,600,000 84,460,000 453,340
World Bank World Bank World Bank World Bank World Bank World Bank World Bank World Bank World Bank World Bank World Bank World Bank World Bank World Bank, AusAID WWF
2,000,000
WWF
Indirect Mitigation Projects Project Description Philippine Green Buildings/Resorts Project Restructuring and Privatization Program RP-German Industrial Pollution Control Cebu Project USDOE PASA
Project Cost (USD)
4,500,000
Funding Source USAID USAID FRG/GTZ-BMZ
5,000,000
USAID
Resources, Environment and Economics Center for Studies, Inc. (REECS)
Page 69
APPENDIX 2: LIST OF PEOPLE INTERVIEWED NAME
POSITION
OFFICE
CONTACT DETAILS
Agoncillo, Oliver
Natural Resources Policy Advisor, Office of Energy and Environment Vice President, Project Development OIC Chief Economic Development Specialist Senior Program Officer, Poverty Reduction Section In-House Consultant
US Agency for International Development
552-9828
[email protected]
World Wide Fund For Nature Philippines National Economic Development Authority Japan International Cooperation Agency Japan International Cooperation Agency Conservation InternationalPhilippines European Commission
[email protected]
Baskinas, Luz Callanta, John Chan, Flerida Dacanay, Minerva Daclan, Marion Antonette Echanove, Juan Micko, Aurelia Planta, Roderick
Project Officer
Deputy Chief, Office of Energy and Environment Director IV
Santiago, Cristina
Climate Change Dept
Sorkin, Lauren Tungpalan, Rolando
Climate Change Coordination Unit Deputy DirectorGeneral
US Agency for International Development National Economic Development Authority Japan International Cooperation Agency Asian Development Bank National Economic Development Authority
DATE OF INTERVIEW 10/26/09
631-3707 loc. 701
[email protected] [email protected]
10/23/09
[email protected]
10/23/09
[email protected]
10/20/09
[email protected] u 552-9892
[email protected]
9/7/09
10/26/09
631-3707 loc. 700
[email protected] [email protected]
10/23/09
[email protected]
9/18/09
[email protected]
10/20/09
Resources, Environment and Economics Center for Studies, Inc. (REECS)
Page 70
APPENDIX 3: VALIDATION WORKSHOP Workshop Program
National Economic and Environmental Development Study (NEEDS) Consultation Workshop October 13, 2009 Torre Venezia Hotel No. 62 Scout Santiago St. Cor. Timog Avenue, Quezon City
Programme
Morning 8:30 – 9:00
Registration
9:00 – 9:10
Welcome Remarks
Manila Observatory
9:10 – 9:30
Messages
Usec. Mary Anne Sering (DENR) Mr. Yolando (UNFCCC)
9:30 – 9:45
Introduction of Participants
Lucille
Velasco
Ms. Rina Rosales (REECS)
Break 10:00 – 12:00
The NEEDS for Climate Change Project Introduction
Ms. Joyceline Goco (EMB)
Presentation of Results
Dr. Germelino (REECS)
Bautista
Lunch Break
Resources, Environment and Economics Center for Studies, Inc. (REECS)
Page 71
1:30 – 2:30
Situation Assessment of CCA and Mitigation Facilitator: REECS Capacity in the Philippines Small Group Discussion #1: CC SWOT Analysis and Formulation of Objectives Plenary Discussion: CC Issues and Needs
2:30 – 3:30
Development of Objectives and Strategy Facilitator: REECS Options Small Group Discussion #2: Identifying Strategic Actions
3:30 – 4:00
Prioritizing Objectives and Strategic Actions Multi-criteria analysis of Strategic Actions: Value-based and Technical Analysis of Alternatives
4:00- 4:30
Synthesis
CLOSING PROGRAM
Closing Remarks
DENR
Resources, Environment and Economics Center for Studies, Inc. (REECS)
Page 72
List of Participants NAME
POSITION
OFFICE
Abdulrahman, Thelma
Department of Interior and Local Government
Adelia, Mahallah Aljecera, Gina Amaro, Marcial Jr. Amon, Rog Aquino, Albert Baladad, Elvira
ICLEI-SEA National Economic Development Agency Department of Environment & Natural Resources CEC PCARRD-SERD Pambansang Koalisyon ng Kababaihan sa Kanayunan
Balibea, Luz Baluca, Hydie Bangsal, Estrellita Baron, Ares Basug, Elenida Bonga, Dan Briola, Jerbert Calanog, Lope Camba, Jo-Nex Cantos, Johnjoe Carpio, Noemi Cleofas, Bobby Daclan, Marion David, Glenda David, Laura Dimalanta, Carla Domingo, Ma. Ana Eser, Kay Estoesta, Nestor Ferolino, Ana Ferrancullo, Eric Flores, Jojie Gabito, Lorna Ibay, Gia Juanillo, Edna Jupe, Mila Magturo, Cecile Majid, Swi Manaro, M.
Officer in Charge
Director Cluster Head DMO
Chief
Asst. Director CDM Manager Engineer III Deputy Administrator Executive Assistant Senior EMS Professor Associate Professor Assistant Vice-President SD Project Officer Chief PDS Environmental Officer K-6 Stat IV Climate Change Attache CTO M-6 Senior Associate
Project Development Service - DA MWSS - CO Department of Budget and Management OUSC - DENR Environmental Management Bureau - DENR PEMSEA Freedom from Debt Coalition Ecosystems Research and Development Bureau - DENR PhilBio World Wide Fund for Nature Department of Agriculture Metropolitan Waterworks and Sewerage System Conservation International Department of Transportation and Communication UP-MSI UP-NIGS Development Bank of the Philippines Shell Department of Agriculture Land Bank of the Philippines Philippine Coconut Authority Land Bank of the Philippines Bureau of Agricultural Statistics - DA British Embassy PAGASA-DOST Seed Link Department of Health Philippine Coast Guard ASOE
Resources, Environment and Economics Center for Studies, Inc. (REECS)
Page 73
Meriel, Hailey Merilo, Gigi Natividad, Mayumi Olay, Emma Omega, Margot Pacpaco, Karen Panga, Dennis Reyes, Charmion Roque, Drexel Santos, N.C. Segayo, Maria Sering, Lucille Soriano, Isagani Subradil, Helen Tamang, Jesus Tanchuling, Milo Tesorero, Lucila Victorio, Vernice Villegas, Jason Yu, Khelvin
EDS II Senior EMS CFMS CDM Adept MPS III Investment Specialist Project TS
Under-Secretary President Consultant Director
Support Staff
NEDA-ROCS Environmental Management Bureau - DENR Forest Management bureau - DENR Project Manager PhilBio Environmental Education & Information Office -EMBDENR Board of Investments SNCPMI-EMB League of Municipalities of the Philippines National Water Resources Board Forest Management Bureau - DENR Department of Environment & Natural Resources Philippine Rural Reconstruction Movement Geosphere Tech. Inc. Department of Energy Freedom from Debt Coalition Land Bank of the Philippines Department of Environment & Natural Resources Department of Energy FDC/Climex
Resources, Environment and Economics Center for Studies, Inc. (REECS)
Page 74