Myrmics: A Scalable Runtime System for Global Address Spaces
Spyros Lyberis
Computer Architecture & VLSI Systems (CARV) Laboratory, Institute of Computer Science (ICS), Foundation of Research and Technology – Hellas (FORTH)
Technical Report FORTH-ICS/TR-436, August 2013
Work performed as a Ph.D Thesis at the Department of Computer Science, University of Crete, under the supervision of Dimitrios S. Nikolopoulos & Angelos Bilas, with the financial support of FORTH-ICS
Copyright © August 2013 by Spyros Lyberis All rights reserved
typeset in Liberation Serif with XƎLATEX ⋆ figures by xfig, gnuplot & Inkscape ⋆
edited with Vim
Myrmics: A Scalable Runtime System for Global Address Spaces Spyros Lyberis University of Crete, Department of Computer Science, 2013 Supervisors: Dimitrios S. Nikolopoulos and Angelos Bilas
The end of the processor performance race in the start of the current century signaled the beginning of the multicore era. To harness the benefits of multiple CPU cores for a single application, programmers must now use parallel programming models. Semiconductor trends hint that processors within the next decade will manage to integrate hundreds of cores on a single chip; the architecture will be heterogeneous, with few strong (and power-hungry) cores and many weak (and power-efficient) ones; caches will be less or not at all coherent. As the new manycore era approaches, finding a productive and efficient programming model able to scale on such architectures is a major challenge. Dependency-aware, task-based programming models have gained a significant following. The programmer provides a serial program, split into small functions (tasks) that run to completion, along with information about the data on which the tasks will operate. A runtime system analyzes the dependencies and schedules and executes the tasks in parallel. Despite their increasing popularity, these programming models are not ready to scale to emerging manycore architectures, as they primarily target today’s homogeneous, cachecoherent multicores. Their runtime implementations appear to be neither scalable, nor suitable for heterogeneous, less coherent architectures. Our thesis delves into the parallel programming challenges that lie ahead in the coming decade. We consider two major problems. First, how should a parallel runtime system be designed, in order to be able to scale well on a manycore processor ten years from now? And second, how can we implement and evaluate such runtime system designs, since such manycore processors are not currently available? Towards the first problem, we enhance an existing task-based model to support nested parallelism and pointer-based, irregular data structures. We then design and implement Myrmics, a runtime system that implements this programming model. Myrmics is specifically designed to run on future, heterogeneous, non-coherent processors and to scale well using novel, distributed algorithms and policies for hierarchical memory management, dependency analysis and task scheduling. Our experimental results reveal that Myrmics scales well compared to reference, hand-tuned MPI baselines, while automatic parallelization overheads remain modestly low (10–30%). We verify that many of our proposed algorithms and policies are promising. Towards the second problem, we create a heterogeneous 520-core FPGA prototype modeled faithfully after current predictions for manycore processors. We use it to evaluate the Myrmics runtime system. The FPGA prototype is based on Formic, a new printed circuit board that we design specifically for scalable systems. We estimate that our prototype runs code 50,000 faster than software simulators for similar core counts.
iii
Myrmics: Ένα Κλιμακώσιμο Σύστημα Χρόνου Εκτέλεσης για Ενοποιημένα Συστήματα Διευθύνσεων Σπύρος Λυμπέρης Πανεπιστήμιο Κρήτης, Τμήμα Επιστήμης Υπολογιστών, 2013 Επόπτες: Δημήτρης Σ. Νικολόπουλος και Άγγελος Μπίλας
Το τέλος του ανταγωνισμού ταχύτητας των επεξεργαστών στις αρχές του αιώνα σήμανε την έναρξη της εποχής των πολυπύρηνων επεξεργαστών. Για να επωφεληθεί μια εφαρμογή από τους πολλαπλούς πυρήνες, οι προγραμματιστές πρέπει πλέον να χρησιμοποιούν παράλληλα προγραμματιστικά μοντέλα. Οι τάσεις της βιομηχανίας ημιαγωγών δείχνουν ότι ένα ολοκληρωμένο κύκλωμα σε μια δεκαετία θα μπορεί να ενσωματώσει εκατοντάδες πυρήνες· η αρχιτεκτονική θα είναι ετερογενής, με λίγους δυνατούς (και ενεργοβόρους) και πολλούς αδύνατους (και καλής ενεργειακής απόδοσης) πυρήνες· οι κρυφές μνήμες θα είναι λιγότερο ή και καθόλου συνεπείς. Όσο πλησιάζει η νέα εποχή των υπερπολυπύρηνων επεξεργαστών, αποτελεί τεράστια πρόκληση να βρεθεί ένα παραγωγικό, αποδοτικό και κλιμακώσιμο σε τέτοιες αρχιτεκτονικές προγραμματιστικό μοντέλο. Τα μοντέλα διεργασιών με εξαρτήσεις έχουν σημαντική απήχηση. Ο προγραμματιστής παρέχει ένα σειριακό πρόγραμμα, αποτελούμενο από μικρές συναρτήσεις (διεργασίες) που τρέχουν μέχρι τέλους, μαζί με πληροφορία σχετικά με το ποιά δεδομένα αυτές χρησιμοποιούν. Ένα σύστημα χρόνου εκτέλεσης αναλύει τις εξαρτήσεις, δρομολογεί και εκτελεί τις διεργασίες παράλληλα. Παρά την αυξανόμενη δημοφιλία τους, τα μοντέλα αυτά δεν είναι κλιμακώσιμα στις επερχόμενες υπερπολυπύρηνες αρχιτεκτονικές, αφού απευθύνονται κυρίως σε σημερινούς ομογενείς επεξεργαστές με συνεκτικές κρυφές μνήμες. Οι υλοποιήσεις των συστημάτων χρόνου εκτέλεσης που τα συνοδεύουν φαίνονται να μην είναι ούτε κλιμακώσιμες, ούτε κατάλληλες για ετερογενείς και λιγότερο συνεκτικές αρχιτεκτονικές. Η εργασία μας εξερευνά τις προκλήσεις στον παράλληλο προγραμματισμό της επόμενης δεκαετίας. Ασχολούμαστε με δύο προβλήματα. Πρώτον, πώς πρέπει ένα σύστημα χρόνου εκτέλεσης να σχεδιαστεί, ώστε να κλιμακώνει σε υπερπολυπύρηνους επεξεργαστές που θα είναι διαθέσιμοι σε δέκα χρόνια; Και δεύτερον, πώς μπορούμε να υλοποιήσουμε και να αξιολογήσουμε τέτοια συστήματα, αφού σήμερα δε διαθέτουμε τέτοιους επεξεργαστές; Σχετικά με το πρώτο πρόβλημα, επαυξάνουμε ένα υπάρχον μοντέλο με εξαρτήσεις ώστε να υποστηρίζει εμφωλευμένο παραλληλισμό και ακανόνιστες δομές δεδομένων με δείκτες. Στη συνέχεια σχεδιάζουμε και υλοποιούμε το Myrmics, ένα σύστημα χρόνου εκτέλεσης που συνοδεύει το προγραμματιστικό αυτό μοντέλο. Το Myrmics είναι ειδικά σχεδιασμένο για μελλοντικούς, ετερογενείς, μη συνεκτικούς επεξεργαστές και κλιμακώνει χρησιμοποιώντας καινοτόμους, κατανεμημένους αλγόριθμους και πολιτικές για ιεραρχική διαχείρηση μνήμης, ανάλυση εξαρτήσεων και δρομολόγηση διεργασιών. Τα πειράματά μας αποκαλύπτουν ότι η κλιμακωσιμότητα του Myrmics είναι συγκριτικά καλή σε σχέση με βελτιστοποιημένους κώδικες αναφοράς σε MPI, ενώ οι επιβαρύνσεις της αυτόματης παραλληλοποίησης παραμένουν αρκετά χαμηλές (10–30%). Επιβεβαιώνουμε ότι πολλοί από τους αλγόριθμους και πολιτικές που προτείνουμε είναι ελπιδοφόροι. Σχετικά με το δεύτερο πρόβλημα, δημιουργούμε ένα ετερογενές πρωτότυπο σε FPGA με 520 πυρήνες, που μοντελοποιεί πιστά υπερπολυπύρηνους επεξεργαστές σύμφωνα με τις τρέχουσες προβλέψεις. Το χρησιμοποιούμε για να αξιολογήσουμε το Myrmics. Το πρωτότυπο βασίζεται στο Formic, ένα νέο τυπωμένο κύκλωμα που σχεδιάζουμε ειδικά για μεγάλες κατασκευές. Εκτιμούμε ότι το πρωτότυπό μας τρέχει κώδικα 50.000 φορές γρηγορότερα από προσομοιωτές σε λογισμικό για παρόμοιο αριθμό πυρήνων.
v
Acknowledgements This work was done at the Computer Architecture and VLSI Systems (CARV) laboratory of the Institute of Computer Science (ICS) of the Foundation for Research and Technology – Hellas (FORTH), and was financially supported by a FORTH-ICS scholarship, including funding by the European Union 7th Framework Programme [FP7/2007–2013], under the ENCORE (grant agreement no 248647) and TEXT (no 261580) projects. The Myrmics memory management subsystem was developed during an internship in the Center for Applied Scientific Computing (CASC) of the Lawrence Livermore National Laboratory (LLNL), and funded by the United States Department of Energy ExaCT (10-SI-014) project. I would like to thank Xilinx Inc., whose Xilinx University Program (XUP) donated 64 Spartan-6 FPGA devices to FORTH-ICS. Without this donation, the Formic cube would be much smaller than 4x4x4, and our results could never have reached the 512-core point. Next I would like to acknowledge all those who contributed to this work. George Kalokerinos wrote much of the Verilog RTL for the Formic, Versatile and XUP boards and courageously fought along with me the arduous hardware verification battle. Michael Ligerakis did the Formic board layout —tenderly hand-routed, all ten layers of it— and handled the back-office support for the board manufacturing. Polyvios Pratikakis provided the (vast) theoretical background for the programming model and the Myrmics runtime system, formally proved the model determinism and equivalence to serial execution, and was an endless reservoir of related work. Iakovos Mavroidis wrote the final code for the MPI library and helped porting many of the benchmarks for both MPI and Myrmics variants. Stamatis Kavvadias and Vassilis Papaefstathiou gave valuable advice on various network-on-chip aspects. Vassilis also provided Verilog RTL and support for the GTP links and the video input/output peripherals of the XUP board. He also discovered the correct way to de-skew the clocks of the SRAM memories on the first Formic board, a task arcane enough to merit an honorable mention in this dissertation. Dimitris Tsaliagkos wrote an early version of the MPI library and helped debug the FPGA design. Foivos Zakkak created the Myrmics code target for the SCOOP compiler. Giorgos Passas helped me to define the Formic switch architecture, with the legendary quote that will echo through the ages “if it fits, use a crossbar”. Stefanos Papadakis was always eager to take photographs and video of great artistic value, without which the papers and demos would look far less convincing. I could not have completed this work without the assistance, guidance and encouragement on all-matters-academic that I got from my advisors, mentors and colleagues. I want to thank Dimitrios Nikolopoulos, Manolis Katevenis, Dionisis Pnevmatikatos, Angelos Bilas, Polyvios Pratikakis, Vassilis Papaefstathiou, Vangelis Angelakis, Bronis de Supinski, Martin Schulz, Todd Gamblin and Stamatis Kavvadias for their advice. And also to congratulate them for their (mostly silent) endurance of my various personality, erm, traits. Last but not least, I would like to deeply thank my family for their continual faith and support for all these years, without which I would amount to nothing in life. And also my friends (in alphabetical order) Apostolis, Dimitris, Eleftheria, Elena, Emmanouella, Irini, Ksaderfos, Lena, Nikos, Valia, Vangelis and Vassilis —each one of you knows why.
vii
Αφιερωμένο στους αγαπημένους μου μητέρα και πατέρα, για όλες τις αγωνίες που έχουν περάσει
Dedicated to my loving mother and father, for all the worries they’ve been through
Contents Abstract . . . . . . Περίληψη . . . . . Acknowledgements Contents . . . . . . List of Figures . . . List of Tables . . .
. . . . . .
. . . . . .
. . . . . .
. . . . . .
. . . . . .
. . . . . .
. . . . . .
. . . . . .
. . . . . .
. . . . . .
. . . . . .
. . . . . .
. . . . . .
. . . . . .
. . . . . .
. . . . . .
. . . . . .
. . . . . .
. . . . . .
. . . . . .
. . . . . .
. . . . . .
. . . . . .
. . . . . .
. . . . . .
. . . . . .
. . . . . .
. . . . . .
. . . . . .
. . . . . .
. . . . . .
. . . . . .
. iii . v . vii . xi . xiii . xvii
1
Introduction 1.1 Background and State-of-the-Art . . . . . . . . . . . . . . . . . . . . . . . 1.2 This Thesis and its Contributions . . . . . . . . . . . . . . . . . . . . . . .
1 1 5
2
Background and State-of-the-Art 2.1 Parallel Programming Models . . . . . . . . . . . . . . . . . . . . . . . . 2.2 Hardware Platform . . . . . . . . . . . . . . . . . . . . . . . . . . . . . . 2.3 Runtime Systems . . . . . . . . . . . . . . . . . . . . . . . . . . . . . . .
7 7 11 13
3
Programming Model 3.1 Programming Model Enhancements . . . 3.2 Code Example . . . . . . . . . . . . . . . 3.3 Application Programming Interface (API) 3.4 Hierarchical Dependency Analysis . . . .
4
. . . .
. . . .
. . . .
. . . .
. . . .
. . . .
. . . .
. . . .
. . . .
. . . .
. . . .
. . . .
15 15 18 19 20
Hardware Platform 4.1 The Formic Prototyping Board . . . . . . . . . . . . . 4.2 The 512-core Hardware Architecture . . . . . . . . . . 4.2.1 MicroBlaze Slice . . . . . . . . . . . . . . . . 4.2.2 Network-on-chip . . . . . . . . . . . . . . . . 4.2.3 TLB/DRAM . . . . . . . . . . . . . . . . . . 4.2.4 GTP Serial Links . . . . . . . . . . . . . . . . 4.2.5 Memory Map . . . . . . . . . . . . . . . . . . 4.2.6 Maintaining Realistic Bandwidth Relationships 4.2.7 Implementation . . . . . . . . . . . . . . . . . 4.3 Extension to 520-core Heterogeneous Architecture . . 4.4 MPI library for the Hardware Prototype . . . . . . . . 4.5 Evaluation . . . . . . . . . . . . . . . . . . . . . . . . 4.5.1 Formic Board . . . . . . . . . . . . . . . . . . 4.5.2 Modeling and Hardware Primitives . . . . . . 4.5.3 Bare-metal Microbenchmarks . . . . . . . . . 4.5.4 MPI Library Primitives . . . . . . . . . . . . . 4.5.5 MPI-based Application Kernels . . . . . . . . 4.5.6 MPI-based NAS Parallel Benchmarks . . . . .
. . . . . . . . . . . . . . . . . .
. . . . . . . . . . . . . . . . . .
. . . . . . . . . . . . . . . . . .
. . . . . . . . . . . . . . . . . .
. . . . . . . . . . . . . . . . . .
. . . . . . . . . . . . . . . . . .
. . . . . . . . . . . . . . . . . .
. . . . . . . . . . . . . . . . . .
. . . . . . . . . . . . . . . . . .
. . . . . . . . . . . . . . . . . .
. . . . . . . . . . . . . . . . . .
27 27 29 31 32 34 36 37 37 41 41 45 46 46 47 49 50 51 54
xi
. . . .
. . . .
. . . .
. . . .
. . . .
. . . .
xii 5
Contents The Myrmics Runtime System 5.1 Design Choices . . . . . . . . . . . . . . . . . . . . . . . . 5.2 Low-level Layers . . . . . . . . . . . . . . . . . . . . . . . 5.3 Memory Management . . . . . . . . . . . . . . . . . . . . . 5.3.1 SLAB Allocator . . . . . . . . . . . . . . . . . . . 5.3.2 Local Memory Allocation . . . . . . . . . . . . . . 5.3.3 Distributed Allocation . . . . . . . . . . . . . . . . 5.4 Dependency Analysis . . . . . . . . . . . . . . . . . . . . . 5.5 Task Scheduling . . . . . . . . . . . . . . . . . . . . . . . . 5.6 Traces and Statistics . . . . . . . . . . . . . . . . . . . . . . 5.7 Filesystem . . . . . . . . . . . . . . . . . . . . . . . . . . . 5.8 Evaluation . . . . . . . . . . . . . . . . . . . . . . . . . . . 5.8.1 Memory Management Subsystem on an MPI Cluster 5.8.2 Myrmics Runtime System on the 520-core Prototype
. . . . . . . . . . . . .
55 55 56 57 57 59 61 63 67 68 69 77 77 82
6
Related Work 6.1 Programming Models and Runtime Systems . . . . . . . . . . . . . . . . . 6.2 Hardware Simulators and Prototyping Platforms . . . . . . . . . . . . . . .
93 93 96
7
Conclusions 7.1 Critical Assessment . 7.2 Further Work . . . . 7.3 Discussion . . . . . . 7.4 Concluding Remarks
Bibliography
. . . .
. . . .
. . . .
. . . .
. . . .
. . . .
. . . .
. . . .
. . . .
. . . .
. . . .
. . . .
. . . .
. . . .
. . . .
. . . .
. . . .
. . . .
. . . .
. . . .
. . . .
. . . . . . . . . . . . .
. . . .
. . . . . . . . . . . . .
. . . .
. . . . . . . . . . . . .
. . . .
. . . . . . . . . . . . .
. . . .
. . . . . . . . . . . . .
. . . .
. . . . . . . . . . . . .
. . . .
. . . . . . . . . . . . .
. . . .
99 . 99 . 102 . 104 . 106 107
List of Figures 1.1
1.2
2.1
2.2
2.3
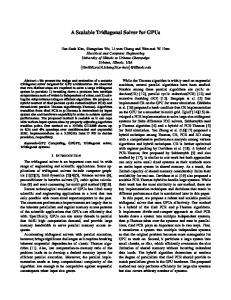
ITRS Roadmap (2012 Update [56]), showing the MPU/High-performance ASIC Half Pitch and Gate Length trends. It predicts that the industry will reach the 8 nm technology node by the year 2023. . . . . . . . . . . . . . . The Intel Runnemede manycore architecture [25] for the 2018–2020 era. The processor is hierarchical, heterogeneous, based on an also hierarchical interconnect and features a combination of non-coherent local caches and scratchpad memories. The CPU has a total of 512 “small” Execution Engine cores (XEs) optimized for energy-efficient data processing and 64 “big” Control Engine cores (CEs) suitable for general-purpose OS/runtime code. There are three levels of hierarchy: a Block consists of 1 CE and 8 XEs; a Unit consists of 8 Blocks; the processor consists of 8 Units. Each hierarchical level adds a new interconnect layer and new memory. . . . . . The PGAS languages memory model. Processor cores have access to “local” (private) and “global” (shared) memory. Most languages support two kinds of pointers. Local pointers are restricted to private, local memory. Global pointers carry metadata and may lead to communication for accessing the remote data. . . . . . . . . . . . . . . . . . . . . . . . . . . . . . . . . . . The ClusterSs [23, 101] programming model and infrastructure. The Mercurium compiler [10] translates a serial program, annotated with directives. The application binary is linked with the Nanos++ [11] runtime system, whose master and slaves images run on all processors and guide the parallelization and running of the application. . . . . . . . . . . . . . . . . . . Execution time of the gem5 simulator, where a number of cores independently compute the first 2048 Fibonacci numbers. The code utilizes private per-core arrays and does not use recursive function calls. Even for such a trivially small, bare-metal software kernel, simulation becomes impractical for very high core counts. . . . . . . . . . . . . . . . . . . . . . . . . . . . . . . . . .
. . . . . .
. . . . . .
. . . . . .
. . . . . .
. . . . . .
. . . . . .
. . . . . .
. . . . . .
. . . . . .
. . . . . .
. . . . . .
. . . . . .
3
8
10
12
3.1 3.2 3.3 3.4 3.4 3.4
Regions example . . . . . . . . . . . . . . . . Code example with task spawning . . . . . . . The programming model API . . . . . . . . . . Hierarchical dependency analysis, parts (a)–(h) Hierarchical dependency analysis, parts (i)–(p) Hierarchical dependency analysis, parts (q)–(x)
. . . . . .
17 18 19 21 22 23
4.1 4.2
The Formic prototyping board . . . . . . . . . . . . . . . . . . . . . . . . Single Formic FPGA top-level block diagram. Light parts represent blocks described in Verilog. Dark parts indicate usage of Xilinx IP blocks. . . . . .
28
xiii
. . . . . .
2
29
xiv
List of Figures 4.3 4.4
4.5 4.6 4.7 4.8 4.9
4.10
4.11
4.12
4.13 4.14
Internals of the MicroBlaze Slice (MBS) block. Light parts represent blocks described in Verilog. Dark parts indicate usage of Xilinx IP blocks. . . . . . Network packet format: (a) a write packet writes the payload contents to the destination address, (b) a read packet is sent to the destination address to request a read; the reply is sent to the source address. In both packet formats, if an acknowledgement address is specified, acknowledgement packet(s) will be sent there when the final write(s) happen. . . . . . . . . . . . . . . . . . Crossbar block diagram . . . . . . . . . . . . . . . . . . . . . . . . . . . . Crossbar interface block (XBI). In (a), we show the BRAM memory block partitioning among the 3 VCs. In (b), we show the XBI block diagram. . . . TLB block diagram . . . . . . . . . . . . . . . . . . . . . . . . . . . . . . Memory Map of the 512-core system . . . . . . . . . . . . . . . . . . . . . The Intel SCC [53] chip architecture. SCC is a 48-core research prototype, fabricated in 45 nm CMOS technology in 2010. It is homogeneous, noncoherent and organized as a 2D-mesh. . . . . . . . . . . . . . . . . . . . . The Formic Spartan-6 FPGA floorplan. We place the eight MBS blocks in two columns to the left and the right parts of the FPGA (mbs0–mbs7). The 22-port crossbar is in the middle (xbar). On top of it we place the TLB logic (tlb) and below it the board controller (brd) which also contains the smaller blocks and peripherals (UART, I2 C, Xilinx MDM debugger, boot logic, reset controller). The two thin slices on the left-hand side are the two SRAM controllers, placed close to the respective I/O pin banks. The thin slice on the upper right-hand side is the DRAM controller, placed near the Xilinx MCB controller hard macro. The logic for the eight GTP links is grouped into two physical blocks (gtp0 and gtp1) and placed near the related GTP hard macros. . . . . . . . . . . . . . . . . . . . . . . . . . . . . . . . . . . The 520-core heterogeneous prototype platform. 64 Formic boards are organized in a 4x4x4 Plexiglas cube (bottom right). Two quad-core ARM Versatile Express platforms (bottom shelf) and a Xilinx XUPV5 board (top shelf, right) are connected to the Formic cube. A PC power supply unit is augmented with digital and analog amperometers (bottom left) for power measurements. A microcontroller-based box (top shelf, left) controls power and I2 C busses to enable remote system power-up and reset. . . . . . . . . . . . Block diagrams for the ARM Versatile Express FPGA daughterboard: (a) shows the top-level FPGA design. Light parts represent blocks described in Verilog. Dark parts indicate usage of ARM or Xilinx IP blocks. The internal structure of each ARS block is shown in (b). . . . . . . . . . . . . . . . . . MPI implementation details . . . . . . . . . . . . . . . . . . . . . . . . . . Bare-metal microbenchmarks [(a)–(c)] and measurements of the MPI library primitives [(d)–(f)]. In (a), we measure the DMA throughput of a single core for the DRAM-to-DRAM (M→M), Cache-to-DRAM (C→M) and Cache-to-Cache (C→C) scenarios for various DMA sizes. In (b), 7 cores compete to perform 1-KB DMAs to an eighth core; the average latency is shown vs. the idle intervals among DMAs. In (c), the STREAM [80] benchmark measures the memory system throughput for a single core. In (d), we measure the latency of individual MPI library calls. Parenthesized numbers denote the number of participating ranks. In (e) and (f) we present the results of the Sandia MPI Benchmark (SMB) suite [35], which is explained further in the text. . . . . . . . . . . . . . . . . . . . . . . . . . . . . . . . . . . .
31
33 34 35 35 36
38
40
42
43 44
50
xv 4.15 Results of the MPI-based application kernels. In (a) through (e), the bars show the speedup of the kernel for a number of cores. The black lines show the ideal linear speedup. In (f), we present how much slower the MPI version of the Jacobi kernel is compared to a bare-metal implementation. In all figures, X axis measures the number of active MPI cores. . . . . . . . . . .
52
4.16 Results of the MPI-based NAS parallel benchmarks. The sets of bars show the benchmark speedup for a number of cores. Different bars in a set represent the dataset choice. The black lines show the ideal linear speedup. X axis measures the number of active MPI cores. . . . . . . . . . . . . . . .
53
5.1
The SLAB allocator internal organization . . . . . . . . . . . . . . . . . .
58
5.2
An example of a region tree. Dotted lines show how the region tree can be split among multiple schedulers. . . . . . . . . . . . . . . . . . . . . . . .
60
Organization of three scheduler levels, with a 4→1 scheduler-to-scheduler ratio. Assuming a 8→1 scheduler-to-worker ratio, each level 2 scheduler owns eight workers (not shown). . . . . . . . . . . . . . . . . . . . . . . .
61
Algorithm of the dependency analysis subsystem, which runs on the scheduler core responsible for a task, when the task is created. The algorithm begins with start_dep(), called with the argument list of the task. . . . .
64
5.3
5.4
5.5
Algorithm of the dependency analysis subsystem, which runs on the scheduler core responsible for a task, whenever a task finishes execution. The algorithm begins with stop_dep(), called with the argument list of the task. 65
5.6
Dependency analysis implementation details . . . . . . . . . . . . . . . . .
66
5.7
Scheduling example . . . . . . . . . . . . . . . . . . . . . . . . . . . . . .
67
5.8
A Paraver trace of the K-Means benchmark on 128 workers (top rows), 7 leaf schedulers and 1 top-level scheduler (bottom rows). . . . . . . . . . .
70
CompactFlash measurements . . . . . . . . . . . . . . . . . . . . . . . . .
71
5.10 Myrmics filesystem operations . . . . . . . . . . . . . . . . . . . . . . . .
74
5.11 Evaluation of the Myrmics memory allocator on a high-performance x86_64 cluster, using an MPI communication layer over an Infiniband network. . .
78
5.12 Parallelization of the Bower-Watson algorithm on four cores. Each core works on four sub-quadrants, which successive rotations to the right, down, left and up communicate among cores. . . . . . . . . . . . . . . . . . . . .
81
5.13 Myrmics intrinsic overhead measurements . . . . . . . . . . . . . . . . . .
83
5.14 Myrmics and MPI strong scaling results. The X axis measures the number of worker cores (Myrmics) or total cores (MPI). The Y axis measures speedup, normalized to single-worker performance (higher is better). Scheduler cores for Myrmics are as follows: 1 core for flat scheduling, or 1 top-level scheduler plus L leaf schedulers for hierarchical configurations, where L=2 for 32 workers, L=4 for 64 workers and L=7 for 128, 256 or 512 workers. . . . .
84
5.15 Myrmics and MPI weak scaling results. The X axis measures the number of worker cores (Myrmics) or total cores (MPI). The Y axis measures slowdown, normalized to single-worker performance (lower is better). Scheduler cores for Myrmics are as follows: 1 core for flat scheduling, or 1 top-level scheduler plus L leaf schedulers for hierarchical configurations, where L=2 for 32 workers, L=4 for 64 workers and L=7 for 128, 256 or 512 workers. .
85
5.9
xvi
List of Figures 5.16 Time breakdown [(a), (c), (e)] and traffic analysis [(b), (d), (f)]. In all figures, the X axis shows the number of worker cores and below the number of scheduler cores (in parentheses). For time breakdown measurements, the Y axis measures percentages, based on the total execution time. The left bar in a pair indicates where a worker core spent its time. The right bar indicates the same for a scheduler core. The bars are averaged per worker or scheduler core respectively. For traffic analysis measurements, the Y axis is logarithmic and measures core communication in bytes. The first bar in a triplet (read/medium) counts the worker message volume, the second bar (blue/dark) counts the worker DMA transfer volume and the third bar (green/light) counts the scheduler message volume. The bars are averaged per worker or scheduler core respectively. . . . . . . . . . . . . . . . . . . . . . . . . . . 5.17 Effect of load-balancing vs. locality scheduling criteria. The X axis shows how much we favor the locality scheduling score (left X values, p=100) to the load-balancing score (right X values, p=0). The Y axis shows how this choice impacts the application running time, the system-wide load balance and the total DMA traffic. Y values are normalized to the maximum for this experiment and measured in percentages. . . . . . . . . . . . . . . . . . . 5.18 Measurements for deeper hierarchies . . . . . . . . . . . . . . . . . . . . .
88
90 91
List of Tables 4.1 4.2 4.3 4.4
Hardware prototype clock frequencies, datapath width and peak throughput Comparing Formic to other hardware prototyping platforms . . . . . . . . . Latency of operations in CPU clock cycles . . . . . . . . . . . . . . . . . . Hardware area cost in Spartan-6 FPGA, as reported by the XST synthesis tool
5.1
Structure of the filesystem block types. Byte lengths for each field are in square brackets. Each block has a total of 4,096 bytes. The header, log sequential ID and CRC-64 fields are present in all block types. . . . . . . . . Myrmics filesystem complexity. In (a), we show the basic primitives complexity in terms of how many CompactFlash 4-KB blocks will be read and written. E is the number of direntries in a directory inode, I is the indirect nodes of a file, N is the amount of data blocks to be read/written from/to the file, D is the needed Delete blocks for the deleted file. In (b), we show the filesystem operations. The complexity of an operation is the sum of the respective block primitives. . . . . . . . . . . . . . . . . . . . . . . . . . .
5.2
xvii
39 47 48 48
72
77
Chapter 1
Introduction 1.1
Background and State-of-the-Art
For the first decades of the semiconductor industry, processor chips had a single CPU core. Processor architecture evolved gradually to include many features that extracted instructionlevel parallelism from serial programs. Both the micro-architectural feature addition and the CPU performance scaling were feasible due to the technology scaling: each new technology node offered more chip area and faster transistors for a reduced price. After the first years of the 21st century, diminished returns of clock rate scaling and power challenges put an end to the single-core performance race [65]. While technology nodes still scale by Moore’s law, the industry now exploits the exponential increase of transistors to integrate multiple CPU cores on a single processor, while the individual clock rates of each core remain constant at a few (2–4) GHz. To harness the increased aggregate performance of the multicore processors to run a single application faster, the programmer must use a parallel programming model so that parts of the application run on multiple CPU cores. Writing parallel applications efficiently is generally considered a very difficult problem [6]. The main challenges are that (i) the majority of software developers are experts on sequential programming, and many of them are not able to grasp the details of concurrent software and parallel hardware, (ii) compilers and operating system are large, unwieldy and resistant to change and thus slow to adopt efficient parallel concepts, and (iii) the multitude of new parallel programming languages makes it difficult to measure improvement, as researchers are often the ones deciding what they think would be better and then building it for others to try. To quote computing pioneer John Hennessy [51]:
“
When we start talking about parallelism and ease of use of truly parallel computers, we’re talking about a problem that’s as hard as any that computer science has faced. […] I would be panicked if I were in industry.
”
While the search for efficient and productive parallel programming models is ongoing, processors continue to integrate more and more CPU cores. Figure 1.1 shows the International Technology Roadmap for Semiconductors (ITRS) projections for processor technology generation trends [56]. The latest ITRS predictions reveal that the industry will reach the 11 nm technology node by the year 2020 and the 8 nm node by 2023. Esmaeilzadeh et al. [39] analyze and use the ITRS projections to predict, among others, the number of CPU cores in future generations. Based on their assumptions, in 11 nm technology we can expect 256 CPU cores on a single processor and in 8 nm 512 cores. They further argue [40] 1
2
Chapter 1. Introduction
Figure 1.1: ITRS Roadmap (2012 Update [56]), showing the MPU/High-performance ASIC Half Pitch and Gate Length trends. It predicts that the industry will reach the 8 nm technology node by the year 2023.
that major breakthroughs are needed to reach these core counts, to overcome both the architectural and software programming obstacles that will force most of the cores to be idle or underutilized:
“
A key question for the computing community is whether scaling multicores will provide the performance and value needed to scale down many more technology generations. Are we in a long-term “multicore era”, or will it instead be a “multicore decade” (2004–2014)? Will industry need to move in different, perhaps radical, directions to justify the cost of scaling?
”
Recent research from EPFL, Carnegie Mellon and ARM [72] calls for new processor designs to harness the performance density needed for datacenter-oriented applications. The authors argue to abandon general-purpose cores and large shared caches, as they become underutilized when running typical server workloads with vast data footprints. They propose to scale future processors by abandoning inter-processor connectivity among large chip areas altogether. Their design features a pod, which integrates a small number of in-order cores tightly with a small cache. As technology scales, more pods can fit on a chip. Pods do not share memory or any fast interconnect. Each pod can run a server in isolation and thus a single chip can scale arbitrarily to accommodate multiple pods and datacenter servers. Even more recently, Intel researchers proposed Runnemede [25], a processor architecture for 2018–2020 era technologies that tries to address scalability concerns by embracing tightly-coupled manycore designs, instead of segregating the chip area to many isolated parts. Runnemede is specifically built from the ground up for energy efficiency, which is one of the greatest challenges for scaling the hardware architecture. Figure 1.2 shows a block diagram. Runnemede is a hierarchical, heterogeneous system. A building block consists of a single fast core (Control Engine), which runs the operating system, and eight slow cores
1.1. Background and State-of-the-Art
3
(a) Runnemede chip architecture
(b) Micro-architecture of a single Block
Figure 1.2: The Intel Runnemede manycore architecture [25] for the 2018–2020 era. The processor is hierarchical, heterogeneous, based on an also hierarchical interconnect and features a combination of non-coherent local caches and scratchpad memories. The CPU has a total of 512 “small” Execution Engine cores (XEs) optimized for energy-efficient data processing and 64 “big” Control Engine cores (CEs) suitable for general-purpose OS/runtime code. There are three levels of hierarchy: a Block consists of 1 CE and 8 XEs; a Unit consists of 8 Blocks; the processor consists of 8 Units. Each hierarchical level adds a new interconnect layer and new memory.
4
Chapter 1. Introduction
(Execution Engines), which run the application. Multiple building blocks are connected by a hierarchical network-on-chip to form the processor. Runnemede proposes a combination of software-managed scratchpad memories and non-coherent caches to increase energy efficiency. Inspired by recent research, we make the following assumptions for the processor architecture for the next ten years: • Processors will continue to integrate more and more CPU cores. We expect that by the year 2023 the industry will offer manycore processors, featuring a few hundred CPU cores in a single chip. • Manycore processors will be more heterogeneous in nature. There will be fewer very strong (and power-hungry) cores on a chip, surrounded by more relatively weaker (and power-efficient) cores. • Manycore processors will be less cache-coherent than today. To increase energy efficiency, we expect that cache coherency will be either limited to smaller groups of CPU cores (coherency islands) or will be abandoned altogether. Chip-wide communication will be explicit and managed by software. Approaching the manycore era, the problem of finding an appropriate parallel programming model becomes more and more important. The de facto standard for cluster-based high-performance computing is the Message-Passing Interface (MPI) [96]. While MPI could be an ideal fit for partially coherent manycore architectures to write optimal, handtuned, high-performance applications, one needs to be a parallel programming expert to write and debug MPI programs. Instead, there have been many interesting programming model proposals over the last few years that focus on programmer productivity. These models enable a programmer with little or no background in parallel programming to write more-or-less serial code which is automatically parallelized by a compiler, a runtime library, or both. Examples include Cilk/Cilk++ [44], Intel Thread Building Blocks (TBB) [68] and OpenMP [86]. We are specifically interested in the task-based family of programming models, in which a serial program is split into tasks, which are relatively small function calls performing atomic chunks of work that run to completion. A runtime library schedules and executes the tasks in parallel, effectively constructing a parallel program from a serial description. Tasks are usually annotated using compiler pragmas and the resulting parallel program is a faithful extension of the sequential one. Without further assistance from the programmer, the runtime system considers all spawned tasks to be eligible for execution. The OpenMP support for tasks [8] falls into this category. A growing number of researchers advocates that if the programmer also provides information about the data on which the task will operate, the runtime can make much more informed decisions. Recent examples on such programming models include Legion [13], Dynamic Out-of-Order Java [38], OmpSs [37] and Data-Driven Tasks [100]. In the aforementioned Intel Runnemede architecture, the authors co-design the processor hardware with runtime system software, in order to study the scalability issues from both perspectives. For the software, the authors propose such a task-based programming model, for four reasons: (i) it facilitates exploitation of all parallelism per application phase, instead of encouraging a static division of an application into threads, (ii) only the producer and the consumer(s) of a data item need to synchronize, potentially reducing synchronization costs, (iii) the non-blocking “complete or fail” nature of tasks avoids much of the context-switching overhead of traditional operating systems and (iv) it makes it easy to identify a computation’s inputs and outputs, and thus to schedule code close to its data, to marshal input data at the core that will perform a computation, and to
1.2. This Thesis and its Contributions
5
distribute results from producers to consumers —this also supports the hardware decision for software-managed scratchpads and caches. Despite the increasing popularity of dependency-aware, task-based programming models, there is much room for improvement when one considers their scalability on emerging manycore processors. A first major weakness of existing programming models is that their evaluation is either done on existing processors, which are limited to a few tens of CPU cores at best, or to machine clusters where the network latencies dominate. Thus, we argue that it remains largely unexplored how the existing programming models (and specifically the implementation of their runtime systems) will behave on processors with hundreds of tightly-coupled cores. Second, there is limited support for irregular, pointer-based data structures, such as trees and graphs, which are necessary for multiple application domains. In most models the programmer cannot express a task that operates on parts of these structures. Third, existing models do not project well to future architectures. The increased processor heterogeneity and decreased cache coherence should be taken into account in the design of a programming model and its runtime system.
1.2
This Thesis and its Contributions
This thesis delves into the parallel programming challenges that lie ahead in the coming decade. We focus on the runtime system implementations for dependency-aware, taskbased, parallel programming models. Specifically, we consider the following problems: A. How should a parallel runtime system be designed, in order to be able to scale well on a manycore processor ten years from now? B. How can we implement and evaluate such runtime system designs, since such manycore processors are not currently available? To explore problem A, we assume a parallel, task-based, programming model similar to the OmpSs [37] family and we propose enhancements to support nested parallelism and pointer-based, irregular data structures. We then design and implement Myrmics1 , a runtime system that implements this programming model. Myrmics is specifically designed to run on future, heterogeneous, non-coherent processors and to scale well using novel, scalable, distributed algorithms and policies. Specifically, our thesis2 makes the following contributions towards problem A: A1. To support nested parallelism and pointer-based data structures efficiently, we extend serial memory regions for usage in parallel programming models. A2. We introduce hierarchical memory management, dependency analysis and scheduling algorithms for task-based models implemented on non cache-coherent, manycore architectures. We show experimentally that this enables scaling to hundreds of cores and alleviates bottlenecks that are present in existing runtime systems. A3. We design Myrmics, a scalable task runtime system that uses these algorithms. Myrmics uses CPUs with different capabilities to run runtime and application code. Our system addresses the challenges that a runtime will face on future processors, according to current design trends. 1
From the greek word “μύρμηξ”, which means “ant” in the katharevousa language form. Polyvios Pratikakis formally proved the programming model determinism and its equivalence to serial execution. Iakovos Mavroidis wrote the code for the MPI library and helped porting many of the MPI and Myrmics benchmarks. Foivos Zakkak created the Myrmics code target for the SCOOP compiler. 2
6
Chapter 1. Introduction
A4. We evaluate how Myrmics scales up to 512 worker cores, using several benchmarks, kernels and applications. We analyze the trade-offs and overheads and we compare the results with reference MPI baselines on the same platform. We solve problem B by creating a custom FPGA prototype of a manycore processor. We specify, design, verify and evaluate the FPGA prototype by itself. We then use it as a faithful model of a future hardware manycore single-chip processor to run, to debug and to evaluate the Myrmics runtime system. Our thesis3 makes the following contributions towards problem B: B1. We design Formic, a novel FPGA board specifically targeted to be a building block for multi-board prototyping large, scalable systems. B2. We develop a non-coherent, scalable, Xilinx MicroBlaze-based hardware architecture. We use it to create a 512-core homogeneous system using 64 Formic boards. We then extend the architecture to include eight ARM Cortex-A9 cores, thus creating a 520-core heterogeneous prototype that emulates a single-chip manycore processor. B3. We design a software MPI library for the hardware architecture. We use it to evaluate the hardware prototype using several benchmarks. We also use the MPI library as the reference programming model to characterize Myrmics performance. Parts of our work on problem A have been published in 2011 [94] and 2012 [75]; we have submitted a third article to the ACM Transactions on Architecture and Code Optimization journal (under first revision). The Myrmics runtime system has been open-sourced and is available in a dedicated website [43]. Parts of our work on problem B have been published in 2012 [74]; we have submitted a second article to the Elsevier Journal of Systems Architecture (first revision under review). We have also written an extensive technical report [73]. The Formic board schematics and the 512-core architecture have been open-sourced and are available in a dedicated website [42]. The rest of the dissertation is organized as follows. Chapter 2 presents the state of the art for parallel programming models, hardware prototyping platforms and runtime systems. Chapter 3 presents our enhancements for the OmpSs family of programming models. Chapter 4 describes our work to design, to implement and to evaluate the 520-core FPGA prototype. Chapter 5 introduces the Myrmics runtime system, presents its key algorithms and describes our implementation and evaluation on the FPGA prototype. Chapter 6 summarizes the existing literature for research in programming models, hardware prototyping platforms and runtime systems areas. Finally, chapter 7 discusses the strengths and weaknesses of our approach, presents ideas regarding future work and concludes our thesis.
3
George Kalokerinos made a major contribution to the development and verification of the hardware architecture. Vassilis Papaefstathiou and Dimitris Tsaliagkos helped with the verification of the finished hardware prototype. Michael Ligerakis performed the Formic board layout and handled the back-office support for its manufacturing. Vassilis Papaefstathiou, Stamatis Kavvadias and Giorgos Passas gave valuable advice on the definition of the architecture.
Chapter 2
Background and State-of-the-Art In this chapter we present the state of the art in the three fields that are directly related to our research, and discuss our motivation for the work done in this thesis. In section 2.1 we overview the existing parallel programming models, in section 2.2 the hardware prototyping platforms, and in section 2.3 the current runtime systems of the parallel programming models.
2.1
Parallel Programming Models
Message Passing Interface (MPI) MPI [96] is a protocol for parallel communication and synchronization among processors with distributed memory resources. Its first version was developed in 1992, after a working group decided upon a preliminary standard the year before. The MPI standard defines the syntax and semantics of library routines for portable applications in Fortran and C. Most MPI programs follow the Single Program/Multiple Data (SPMD) paradigm, in which the same program is executed in parallel by all participant processor cores. Programmers using MPI are required to argue explicitly about the points where communication and synchronization occur in the program. Each processor core has an assigned unique identifier (rank). In the simplest form, two cores communicate by specifying an application buffer to be sent or received and the rank of the peer core for the communication operation. The MPI implementation resolves all lower-level details, such as waiting for the other peer to reach the correct point in the program time, programming the communication hardware to perform the actual data transfer, waiting for the data to arrive, and resuming the program flow after the receive buffer is ready to be used (at the receiver side) or the send buffer can be reused (at the sender side). There are many MPI implementations, such as the open-source MPICH [83] and OpenMPI [87]. Many of them use hardware assistance or full offloading of some parts on network cards that natively support MPI, either using hardware accelerators (such as MPI queue processing) or through dedicated processors that implement the MPI software stack on the card. MPI is considered the de facto choice for distributed-memory communication and is widely used in high-performance clusters [77], including all top supercomputers. Its primary advantage is the explicit nature of the communication, which offers the programmer the ability to fine-tune applications so that communication is optimally overlapped with computation and the communication overhead is minimized. Other advantages include software portability, mapping and adapting the communicating peers so that the software-perceived communication coincides with the actual, underlying network topologies, as well as the optimal usage of memory resources. 7
8
Chapter 2. Background and State-of-the-Art
Figure 2.1: The PGAS languages memory model. Processor cores have access to “local” (private) and “global” (shared) memory. Most languages support two kinds of pointers. Local pointers are restricted to private, local memory. Global pointers carry metadata and may lead to communication for accessing the remote data.
However, despite its strong points, MPI remains the equivalent of “assembly” for parallel programming. The programmer must explicitly cover any aspect of communication in the application, which is hard for non-experts: debugging a parallel MPI application is notoriously difficult. Also, MPI programs that use dynamically allocated data structures, such as trees, must manually marshal and unmarshal them for communication. The programmer must allocate adequate space before a transfer takes place and must rewrite any pointers after the transfer. Essentially, programmers need to implement small parts of runtime libraries of Partitioned Global Address Space (PGAS) or task-based programming models (which we overview below) to handle these cases. Because of the low programmer productivity and the difficulties faced by beginner- and intermediate-level programmers, in application fields other than high-performance computing, MPI is not a very popular choice. Other, more intuitive, but less potent and less performing languages and programming models are often considered as viable candidates. Partitioned Global Address Space (PGAS) Languages One such family of viable candidates are the PGAS languages. Non-expert programmers who are somehow familiar with parallel programming feel comfortable with the hardware paradigm of shared-memory cache-coherent machines. This paradigm provides a shared address space where every core can access any other core’s data. This abstraction is intuitive enough to introduce parallel programming concepts in a natural way —although it is far from easy to write programs that are completely race-free and safe. However, machines with distributed memory hierarchies do not offer a common address space. The PGAS family of languages is a step towards this direction. They provide programmers with the familiar illusion of a shared address space, which is implemented by the language compiler and/or a runtime library. The programmer writes parallel code (in the SPMD paradigm, as in the MPI case) and augments it with language keywords or compiler pragmas that characterize data variables as “private” or “shared” (figure 2.1). Communication is automatically induced by the compiler and/or the runtime system when cores access non-local data. A prominent example of a PGAS language is Unified Parallel C (UPC) [107], which extends C by providing two kinds of pointers: private pointers, which must point to objects local to a thread, and shared pointers, which point to objects that all threads can access but may have affinity to specific cores. The Berkeley UPC compiler [55], which is a reference implementation, translates UPC source code to plain C code with hooks to the UPC runtime system that manages the shared memory aspects. Other well-known PGAS languages are X10 [30, 50], which defines lightweight tasks (activities) that run on specific address spaces (places), Co-Array Fortran [84], which extends Fortran 95 to include remote objects acces-
2.1. Parallel Programming Models
9
sible through communication, Titanium [52], which extends Java to support local and global references and Chapel [27], which is a language written from scratch that aims to increase high-end user productivity by supporting multiple levels of abstractions. PGAS languages increase programmer productivity by addressing the MPI drawback of being hard for non-expert programmers. However, they do so by introducing several other drawbacks. First, the compiler and runtime system introduce overheads for every communication. More communication than absolutely necessary may be done, either by transferring shared data back-and-forth, or through piggy-backing them with runtime metadata. In the case of runtime libraries, some or all processor cores will be kept busy with executing code related to metadata transfers, object location discovery protocols, etc. The parallel speedups achieved by MPI are generally infeasible with PGAS languages for distributed-memory machines. To schedule and to manage parallel tasks, existing PGAS languages tend to require strict control of the task footprint in memory. To meet this requirement, they restrict the use of dynamic memory in the program by making all dynamic allocation local to a task [41], or by statically limiting the available dynamic memory1 . Also, expert programmers may find that fine-tuning parallel applications, e.g. to overlap communication with computation optimally, is more difficult with “clever” runtimes that schedule and distribute resources heuristically, when compared to “dummy” MPI implementations that perform the exact amount of work that the programmer encodes. Other drawbacks of the PGAS languages are that they require rewriting applications using the new languages and they do not support irregular forms of parallelism (such as arbitrary array sub-indexing) or asynchronous task-based parallelism. Despite these drawbacks, the performance-productivity trade-off of PGAS languages makes them attractive and they have gained a significant following over the last years. Task-based Programming Models Task-based programming models belong to a different family of competitors to the MPI model. These models allow the programmer to express parallelism in a very intuitive way. The programmer writes serial code, which begins running on a single CPU. The program is split into tasks, which are relatively small function calls performing atomic chunks of work that run to completion. A runtime library schedules and dispatches the tasks to run on other CPUs in parallel, effectively constructing a parallel program from a serial description. Tasks are either annotated using compiler pragmas, or built into the language, and the resulting parallel program is a faithful extension of the sequential one. Historically, task-based programming models evolved to replace programming cache-coherent, shared memory architectures with threads and locks. Although the threading model initially “felt easy” to programmers, it required reasoning about implicit communication and interactions through shared memory. This complex, tedious and error-prone process made non-trivial threaded programs hard to test, to debug and to maintain. Writing good-quality, race-free, well performing and scalable multithreaded code is considered to be very challenging [69]. Commercial and academic task-based model programming models increase programmer productivity by abstracting away the difficult parts of parallelization and communication. Notable examples include Intel TBB [68], OpenMP [8], and Cilk/Cilk++ [19, 44]. As successors to the original multithreaded applications, the initial task-based models target cache-coherent shared memory architectures. More recent generations of task-based programming models also target heterogeneous computing systems, based on general-purpose GPUs or other hardware accelerators. To 1 The Berkeley UPC 2.14.0 that we used in the evaluation imposes a static limit of 64 MB per thread for dynamically allocated memory.
10
Chapter 2. Background and State-of-the-Art
Figure 2.2: The ClusterSs [23, 101] programming model and infrastructure. The Mercurium compiler [10] translates a serial program, annotated with directives. The application binary is linked with the Nanos++ [11] runtime system, whose master and slaves images run on all processors and guide the parallelization and running of the application.
know which data must be transferred between the GPU and the host processor(s), the programmer provides information about the data on which the task will operate. In addition to moving the correct data back and forth, runtime systems of such programming models can make much more informed decisions for program correctness and determinism. Specifically, in dependency-aware programming models, spawned tasks are not automatically eligible for execution. A task is ready to be executed only when its data arguments are finished being written by any previous tasks. Recent examples on such programming models include OmpSs [37], Legion [13], and Dynamic Out-of-Order Java [38] (which also relies on compiler static analysis). In the literature, there are multiple variations on how to express task dependencies. One such way is to use futures, which declare that a new task must wait for certain variables (Data-Driven Tasks [100] and X10) or other tasks (Habanero-Java [26]). OpenStream [93] defines streams, which are language constructs that define how tasks communicate by producing and consuming data. No matter what the variation, advantages of the dependency-aware tasking models include increased productivity, flexible exploitation of parallelism depending on the application phase, and also an opportunity for runtime systems to increase data locality, by scheduling computation (i.e., consumer task(s)) close to the data (i.e., the location of the previous producer task(s)). We select a class of such dependency-aware, task-based parallel programming models as the basis for our work: the ones developed by the Barcelona Supercomputing Center (BSC). BSC has introduced a whole lineage of dependency-aware programming models that support OpenMP-like tasks for a number of architectures. StarSs runs on cache-coherent, shared-memory processors [91], CellSs on the IBM Cell Processor [15], ClusterSs on clusters of multiprocessors [23, 101], StarPU on heterogeneous systems with accelerators and Cell processors [7], and OmpSs on heterogeneous CPUs/GPUs systems [37]. All these programming models are supported by the Mercurium compiler and the Nanos/Nanos++ runtime systems [10, 11]. Figure 2.2 shows a block diagram of ClusterSs. We set the following targets for our programming model: Scalability: The programming model must be able to express task parallelism in a way that enables scaling to hundreds of cores.
2.2. Hardware Platform
11
Heterogeneity: As we expect that emerging manycore processors will be heterogeneous, the programming model must assume that the runtime system will run only on the few, stronger cores of the processor. Non-coherency: As we expect that emerging manycore processors will be less coherent (or totally non-coherent), the programming model must assume explicit data transfers and related optimizations. Pointer-based data structures: To support applications in diverse fields other than highperformance computing, the programming model must be able to express task dependencies on dynamically-allocated, pointer-based data structures, such as trees and graphs. To achieve our Scalability target, we extend the base programming model to use nested and recursive tasks, which enable multiple tasks to spawn other tasks in parallel. To facilitate simpler, but more scalable, dependency analysis algorithms, we restrict some of the OmpSs models expressiveness by disallowing tasks to be dependent on parts of objects, such as array sub-indices. To work towards the Heterogeneity and Non-coherency targets, we specify that tasks can be dependent only on heap-allocated objects; we further define that heap memory allocation calls are points of synchronization between the application code and the runtime system. This choice on the one hand incurs communication cost, but on the other hand allows the runtime system to be present only on a few cores that share the full knowledge of all application data locations. To support pointer-based data structures we extend the use of serial regions, an efficient way to express arbitrary collection of heap objects. We define how regions can be used in a parallel programming model, and how tasks can use region arguments to support bulk dependency analysis and data transfer of parts of pointer-based data structures, as well as to hierarchically decompose an application. Our enhanced programming model is presented in more detail in chapter 3.
2.2
Hardware Platform
Hardware and parallel software research on multicore systems is challenging, especially at a time when technology scaling approaches the manycore era. There are two schools of thought on multicore systems modeling: simulating them in software vs. prototyping them in hardware using FPGAs. Modeling complex systems in software simulators like Simics [76] and GEMS [78] is a very popular approach. One can easily tune architectural parameters and swiftly explore systems with different characteristics. A weak point of software simulation is that the more cores one simulates, the slower it gets. To quantify this assertion, we perform the following experiment: we simulate a number of cores running a very small piece of bare-metal software, where each core independently computes the first 2048 Fibonacci numbers. We model a cycle-accurate full system using the recent and efficient gem5 simulator [18] on an Intel Core 2 Quad clocked at 2.4 GHz with 4 GB RAM. Figure 2.3 shows that the simulation time of the 512-core system is 2 hours. Our setup seems capable of simulating an aggregate of roughly 100,000 CPU clock cycles per second, which translates to approximately 200 clock cycles per second per core. For 512 cores it is too slow to run realistically-sized parallel software. The poor scaling of software simulation cannot be easily mitigated by multithreading the simulator, which approaches in the literature attempt [82, 95] by sacrificing simulation accuracy or abstracting the simulation into higher levels than clock-cycle accuracy. Another limitation of relying on simulators to evaluate the performance of hard-
Chapter 2. Background and State-of-the-Art
Simulation time (hours)
12 2 1.5 1 0.5 0 1
2
4 8 16 32 64 128 256 512 Number of simulated cores
Figure 2.3: Execution time of the gem5 simulator, where a number of cores independently compute the first 2048 Fibonacci numbers. The code utilizes private per-core arrays and does not use recursive function calls. Even for such a trivially small, bare-metal software kernel, simulation becomes impractical for very high core counts.
ware architectural changes is that it can often lead to dubious results [48], because the user may rely on unrealistic choices of architectural parameters. Following the hardware prototyping approach, building manycore systems using FPGAs is a considerably harder and slower path than software simulation. However, running programs on the final system is very fast. An added benefit is that the modeling process itself provides more insight into the impact of architectural changes and helps to avoid pitfalls of unrealistic software simulation parameters. In between the software simulation and hardware prototyping approaches, there is much work in the literature that attempts to bridge the gap through various hybrid approaches. Tan et al. [99] have published a categorization of such systems. We choose to avoid using software simulation, which would both limit the program sizes that we can run for runtime systems evaluation and obscure important hardware details for the hardware architecture. Instead, we decide to build a manycore hardware prototype, that both runs complex software efficiently and offers deeper insight on various hardware primitives. We consider the increased effort that we spend in developing manycore hardware prototypes is well offset by the added level of detail and reduced program runtime that it offers in return. We set the following targets for our hardware prototype: CPU core: The CPU must be strong and mature enough to support complex software. It must provide floating point operations to run computational benchmarks. Cache hierarchy: At least two levels of cache must be present, so that interesting cache traffic scenarios appear. The caches should be adequately sized and have enough associativity. Scalability: We want the system to scale to at least to a few hundred cores. Connectivity: Emerging manycore chips experiment with various network topologies, like 2D-meshes and hypercubes. Our system should allow similar experiments. Cost: The system components must be reasonably priced so that the scalability target is respected. Prominent examples in the literature of academic and commercial FPGA prototyping boards include the Berkeley Emulation Engine research boards, BEE2 [29], BEE3 [34] and BEE4 [14], as well as the Xilinx XUPV5 board [117]. To build a system of hundreds of
2.3. Runtime Systems
13
cores, one must use multiple boards and interconnect them in a network. We find that the existing FPGA boards are limited in at least one of the three following aspects: 1. They do not feature enough SRAM memory, which is needed to model adequatelysized caches faithfully: this violates our Cache hierarchy constraint. 2. They do not have enough off-board links to interconnect them in interesting network topologies: this violates our Scalability and Connectivity constraints. 3. They are expensive to buy in large quantities: this violates our Cost constraint. For these reasons, we do not use any of the existing academic or commercial prototyping boards. Instead, we design Formic, a custom FPGA prototyping board with multiple SRAM memories to model caches and multiple off-board links to interconnect many boards for large systems. We take care to keep the board cost low, so we can afford to manufacture and to assemble many of them to build our heterogeneous hardware prototype. To avoid the power, area and design complexity overheads of cache coherency and the limited scalability of shared-memory programming models, many researchers advocate abandoning cache coherency altogether in favor of architectures that rely on distributed memory and explicit communication [25, 53, 61, 72]. We share these concerns and choose to implement a non-coherent hardware architecture, which works towards our Scalability target. We use multiple Formic boards to create a hardware prototype that uses 512 Xilinx MicroBlaze [116] cores. We connect our prototype to two ARM Versatile Express platforms [5], each one equipped with a four-core ARM Cortex-A9 processor and an FPGA daughterboard, and we create a 520-core heterogeneous hardware platform. Our hardware architecture faithfully models a single-chip processor, as we take care to clock each part appropriately to model bandwidths and latencies as if all 520 cores were within a single chip. The design of the Formic board, the 520-core prototype and its implementation and evaluation are discussed in detail in chapter 4.
2.3
Runtime Systems
Each of the parallel programming models discussed in section 2.1 is supported by a runtime system2 . The runtime system is developed by system experts. It runs at the same time with the user application code and provides the functionality of the respective programming model. Runtime system code runs whenever the user application calls one of the functions defined in the application programming interface (API) of the programming model. Other parts of the runtime system may run in the background (e.g., garbage collection code) or they may be called implicitly when the application code uses specific language constructs (e.g., the X10 async statement) —in such cases the compiler places the related API calls in the application code when it encounters the language constructs. Assuming that a given programming model allows the programmer to express an application with enough parallelism to scale, the implementation of its runtime system determines if the application will scale or not. Among the well-known, scalable runtime systems are MPICH [83] and OpenMPI [87] for the MPI programming model. Among many other optimizations, they implement the collective communication MPI calls using scalable, hierarchical algorithms, tailored to the underlying node topology and exploiting any available hardware primitives. We can consider the MPI libraries as a reference point for scalability, 2
In the literature, some authors prefer the term term runtime library, or even simply library.
14
Chapter 2. Background and State-of-the-Art
because MPI is used for production purposes in supercomputers with hundreds of thousands of nodes. The newer task-based programming models target mainly cache-coherent, shared-memory workstations with few tens of CPU cores, or CPU/GPU combinations. In the related literature, authors rarely discuss implementation details of their runtime systems. To the best of our knowledge, existing runtime systems of task-based programming models exhibit at least some of the following weaknesses: 1. They assume that a single master task can spawn tasks, or that a single CPU node must handle all task generation (e.g., in ClusterSs [23] (figure 2.2) one CPU becomes the master node and all others are slaves). After a certain core count, the single master task and/or CPU node becomes a bottleneck. 2. They feature parallel scheduling and dependency analysis, but as they mostly target cache-coherent, shared-memory architectures, they implement algorithms that scale poorly (e.g., using centralized data structures and locking). 3. They evaluate their work running on systems with few tens of CPU cores (usually up to 32 or 64). 4. They do not project well to emerging heterogeneous architectures, in which it would be more advantageous if runtime code ran only on the few, strong cores and application code only on the many, weaker ones. We argue that it remains largely unexplored how these existing systems will behave on single-chip, manycore, heterogeneous, partly or fully non-coherent processors. In emerging manycores, the latencies and CPU configurations will be vastly different than both today’s cache-coherent, shared-memory multicores and supercomputer clusters. Apart from the changes that we propose to enhance the scalability of the programming model, we specifically design the Myrmics runtime system with a primary target to scale well on emerging manycore processors. We avoid the problems of the existing runtime systems and implement scalable, hierarchical memory management, task dependency analysis and scheduling algorithms. We employ scalable, software-based coherency protocols with explicit data transfers, to maintain a global address space (much like the one in PGAS languages) although the underlying architecture is non-coherent. We implement and evaluate Myrmics on the 520-core FPGA prototype directly (a bare-metal software design), as it helps us disregard any operating system interference and focus on optimizing the runtime system. To do that, we also develop low-level layers for the FPGA prototype and its peripherals, as well as a limited-functionality, but resilient, CompactFlash filesystem for data storage. We discuss in more detail the design, implementation and evaluation of the Myrmics runtime system in chapter 5.
Chapter 3
Programming Model In this chapter we explain the parallel programming model we use for the Myrmics runtime system. Section 3.1 presents the enhancements that we propose over existing dependencyaware, task-based, parallel programming models. Section 3.2 shows an application code example to illustrate the concepts that we use. Section 3.3 presents the Application Programming Interface (API) for our enhanced programming model. Finally, in section 3.4 we discuss how our model enables the hierarchical dependency analysis, and we illustrate it with a detailed example. Parts of the work presented in this chapter have been published in 2011 [94].
3.1
Programming Model Enhancements
As discussed in section 2.1, we select the Barcelona Supercomputing Center (BSC) family of dependency-aware, task-based programming models [7, 15, 23, 91, 101] as the basis for our work, of which the latest and more general in scope is OmpSs [37]. We propose several enhancements in order to make the programming model that we use for Myrmics more scalable, more suitable for heterogeneous, non-coherent architectures and to support pointer-based data structures. Object Granularity The authors of StarSs in a different paper [92] present some interesting implementation side-effects of their programming model. The BSC models, in general, allow tasks to be dependent on parts of array structures (e.g., a single array element, or one dimension of a multi-dimensional array). A task can also be dependent on strided arguments, by specifying a starting element and stride lengths1 . The authors mention that their approach is more restrictive than previous work, but more efficient for dependency analysis. They introduce a compact form for task dependencies using a low-level representation of address bits with three values (0, 1 and “X”). They build a tree of all task dependencies, including all last producers (writers) for finished tasks. For every new task dependency, the tree must be traversed, following all branches that may lead to potential overlaps. We argue that although their approach is more efficient than previous work, it is still a limiting factor for scalability. By enabling unrestricted sub-indexing, each new task dependency must be checked for potential overlap with a great number of previous dependencies. For hundreds of cores, with appropriately big datasets of thousands of in-flight tasks, this tree will become a bottleneck. 1 Note that the authors use the term “region” as a set of elements for an array [92]. Our usage of the term “region” is different, as we mean generic collections of heap objects, which may or may not include arrays.
15
16
Chapter 3. Programming Model
A distributed implementation would perform better, but still any new task must traverse an arbitrary path of the tree and thus the creation and destruction of tasks become global problems that cannot be handled locally by a part of the CPU cores. A different approach to this problem is to split the addressable memory into a number of blocks [106]. Overlapping dependencies are handled by identifying which blocks are touched by a strided argument. We argue that this method may scale better, but faces a different problem. Performance may suffer for well-behaved applications that use large arrays or objects, as they are split into many smaller blocks. If the block size is increased to handle this case, then performance may suffer because too many overlaps are falsely detected by the runtime. We propose to forbid strided accesses in the programming model. Our model allows task dependencies only on whole objects (as well as regions, which we will explain below). Although this choice limits the programming model expressiveness, it allows for a much more efficient runtime system implementation. Every new task dependency can now be checked for overlap in O(1) time, as it only requires a search in a hash table (using the pointer value as the key) to locate its dependency queue and check there if the object is used by any other task. For distributed implementations, the address space can be segmented across multiple CPU cores, and thus the overlap check can also be done in O(1) time, adding one step to delegate the check to the correct CPU core. Restrictions to programming model expressiveness are common, and a number of other researchers are in favor of them to solve various programming or hardware implementation issues [20, 32]. We impose a second restriction: we allow tasks to be dependent only on objects allocated in the heap. Our reasoning is that this choice allows for a clear interface between the application and the runtime system. The runtime system intercepts heap allocation and free calls and tracks each live object, any of which may become a dependency for future tasks. The user may use any stack object locally in a task, but must expose any object used for task dependencies to the runtime system, by explicitly allocating it in the heap. This requirement helps our programming model to be more suitable for heterogeneous and non-coherent architectures, where the runtime system runs on different CPU cores than (and does not have access to the local memory of) the ones running the application tasks. In such architectures, pointers to stack objects are meaningless, as they refer to private core memory. Regions To support pointer-based data structures and to facilitate hierarchical dependency analysis, we borrow a well-known and well-studied construct in memory management literature: region-based memory management [104]. A region is a user-defined collection of heapallocated objects. The user may allocate, free and reallocate objects within a region. Moreover, the user can create and destroy sub-regions that belong to existing regions. We show an example in figure 3.1. In the left-hand part of the figure, an application code uses an enhanced heap allocation function (alloc). Its first argument is the customary allocation size. Its second argument is a region ID (rid_t) that specifies in which region the object should be allocated. A NULL (or root) region exists by default with region ID equal to 0. We define a region allocation function (ralloc) that creates a new region from an existing region parent. In the right-hand part of the figure, we show a possible internal construct of a runtime system that implements a programming model with regions, the region tree. A region tree is a hierarchical representation of the parent-child relationships among regions and objects. We use regions to express dynamic data structures more intuitively and efficiently. By allocating some data structure members in a region, the programmer can express accessing or
3.1. Programming Model Enhancements 1 2 3 4 5 6 7 8 9 10 11 12 13 14 15
17
// NULL region children int *t = alloc(32 * sizeof(int), 0); rid_t A = ralloc(0); rid_t B = ralloc(0); // A's children rid_t C = ralloc(A); rid_t D = ralloc(A); long *a = alloc(100 * sizeof(long), A); // Leaf objects node *c1 = alloc(sizeof(node), node *c2 = alloc(sizeof(node), node *d1 = alloc(sizeof(node), node *d2 = alloc(sizeof(node), (a) Sample allocation code
"NULL" or "root" region
object t
B
region C
C); C); D); D);
A
c1
a
c2
D
d1
d2
(b) The respective region tree
Figure 3.1: Regions example
transferring the whole structure simply by referring to the region ID. This capability enables reduced communication overhead for transferring complex, irregular, pointer-based data structures, which can be tightly packed by an underlying region-based memory allocator. Our enhanced programming model defines that when a task specifies a region dependency, it is allowed to access (i) objects belonging to the region and (ii) recursively any objects belonging to any children sub-regions. This capability further enables an application to hierarchically decompose its data structures. For example, a whole irregular structure could belong to a single region; a coarse-grained master task can be spawned to begin processing the whole data structure. Smaller parts of the data structure could belong to children regions; the master task could then spawn finer-grained children tasks to process these parts. In the literature, regions have been found to be very intuitive. They have been used to increase locality and to accelerate bulk allocation and deallocation. Successful coherent implementations of regions include stand-alone libraries and built-in programming language support. Regions preserve the shared-memory abstraction while providing a mechanism to describe the desired structure of memory and control the locality and placement of memory objects. Gay and Aiken [46] have measured up to 58% faster execution times on memoryintensive benchmarks that use region-based memory management versus a conventional garbage collector. In-place Spawn Pragmas The OmpSs family annotates tasks with compiler pragmas to define their memory footprint, i.e., which task arguments are to be read and which to be written. In OmpSs, this compiler pragma is put above the function declaration of the task. Whenever the function is called, the programming model specifies that a task may be spawned by the runtime system. The latter is free to choose not to spawn the task, but to execute it by the same core that runs the current task as a simple function call. We slightly change this behavior. In our programming mode, we place the compiler pragmas at the function calls instead of the function declarations. This change enables the user to choose whether a function call must run locally or be spawned as a new task. Moreover, it allows for user and compiler optimizations with “safe” and “no transfer” flags (which we define in section 3.3) that may be differentiated, depending on the place that the task spawn happens.
18 1 2 3 4 5 6 7 8 9 10 11 12 13 14 15 16 17 18 19
Chapter 3. Programming Model
typedef struct { int key; void *data; rid_t lreg, rreg; struct TreeNode *left, *right; } TreeNode; main() { rid_t top; // Whole tree TreeNode *root; // Tree root // (allocation here) ... #pragma myrmics region inout(top) process(root); #pragma myrmics region in(top) print(root); }
20 21 22 23 24 25 26 27 28 29 30 31 32 33 34 35 36 37 38
void process(TreeNode *n) { if(!n) { return; } if(n->left) { #pragma myrmics region inout(n->lreg) process(n->left); } if(n->right) { #pragma myrmics region inout(n->rreg) process(n->right); } } void print(TreeNode *root) { print(root->left); print_result(root); print(root->right); }
Figure 3.2: Code example with task spawning
Task Nesting To the best of our knowledge, earlier versions of the OmpSs family (StarSs, StarPU) do not support task nesting, but newer versions (ClusterSs, OmpSs) seem to do so. Independently to the newer OmpSs versions, we proposed a fully-nested, task-based programming model in 2011 [94], where an application task can (i) spawn other tasks, and also (ii) respawn itself recursively. The second feature is less important, but we consider that the first one is crucial to make the programming model scalable. When an application runs on hundreds of cores or more, thousands of tasks will be spawned. No matter how light a runtime system is, any single point of spawning will become a bottleneck. The programming model must allow tasks to spawn other tasks, so that multiple CPUs can be involved in the mass generation of total tasks. Our enhanced programming model allows for this behavior.
3.2 Code Example Figure 3.2 shows an example of an application written in our enhanced programming model that hierarchically processes a binary tree. We use compiler pragmas compatible with the Myrmics runtime system, which will be presented in detail in chapter 5. We use a sourceto-source compiler [118] to translate the pragma-annotated C code to plain C code with calls to the Myrmics runtime system interface. We present this interface in the next section (figure 3.3). In an initialization phase (not shown in figure 3.2, but similar to the one in figure 3.1), the user creates one allocation region for the whole tree (top, line 9) and allocates a tree, so that for each TreeNode *n in a region, its left subtree *left (right subtree *right) is allocated in a subregion n->lreg (n->rreg). The root tree node is allocated in the top region. Lines 14–15 spawn one task to process the tree, which spawns two tasks to process the left and right subtrees recursively (lines 25–30). The inout clause in the pragma specifies that the spawned task has both read and write access to the top region. Lines 16–17 spawn a single print task to print all results. The task is dependent on reading the whole tree, stored in region top. The runtime system will therefore schedule print only when the process task and its children tasks have finished modifying the child regions of top. When print
3.3. Application Programming Interface (API) // Region allocation rid_t sys_ralloc(rid_t parent, int lvl); void sys_rfree(rid_t r); // Object allocation void *sys_alloc(size_t s, rid_t r); void sys_free(void *ptr); void sys_realloc(void *old_ptr, size_t size, rid_t new_r); void sys_balloc(size_t s, rid_t r, int num, void **array);
// Task #define #define #define #define #define
19 management TYPE_IN_ARG TYPE_OUT_ARG TYPE_NOTRANSFER_ARG TYPE_SAFE_ARG TYPE_REGION_ARG
(1 (1 (1 (1 (1
parent_counter; arg->parent->parent_counter = 0;
33 34 35 36
dep_next(arg->parent); } else { send message to parent scheduler to do the above; }
37 38 39 40 41 42
65
} Figure 5.5: Algorithm of the dependency analysis subsystem, which runs on the scheduler core responsible for a task, whenever a task finishes execution. The algorithm begins with stop_dep(), called with the argument list of the task.
66
Chapter 5. The Myrmics Runtime System parent()
A B
C
D Ln scheduler
E
child()
F
1
G
Ln−1 schedulers
2
(a) Dependency queues and region traversal path
t1() p:1
C
E
A
main() c:1
A
main() c:2
A
main() c:2
B
p:1 c:1
B
p:2 c:2
B
p:2 c:1
D
t1() p:1 c:1
C
t3() p:1
E
D
x t2() p:1 p:1 c:1
C
t3() p:1
E
D
x
(b) Parent/children dependency counters
Figure 5.6: Dependency analysis implementation details
Section 3.4 introduced the concept of a counter to track if a region has any children regions or objects with any tasks in their queues. In Myrmics we keep several software counters per region, whose usage becomes more complicated to cover several implementation details. Whenever an argument traversal as the one we described passes through a region, we increment a counter in the region to indicate that one of its children has a pending task. Figure 5.6b shows an example. At the left-hand part, main() (which owns region A) spawns t1() to work on region C. Counter “c” (for “child”) is incremented in regions A and B to note there is one child enqueued for a part of these regions. At the middle part of the figure, this traversal happens again when main() spawns t2() to work on region D, and t1() spawns t3() to work on region E. Now the child counter in region B has two children pending. When a task finishes, the next task waiting in the dependency queue of each task argument is marked as ready. If the queue is empty, no more tasks are waiting for this argument and the parent region is notified that one of its children has finished. The parent region decrements its child counter. When the counter reaches 0, its children have finished and the next task waiting for the whole region can now proceed. In the right-hand part of figure 5.6b, t1() and t2() both finish and their queues are empty. Region C child counter is non-zero, as it has one more child operating on a part of it (t3() on region E), so nothing happens. The region D child counter is zero, and so parent region B is notified and decrements its child counter, which is now 1. Nothing more happens as B still waits for one more child (region C, which is at this time delegated to t3() on region E). Myrmics uses separate child counters to indicate read/write or read-only dependencies, so we can optimize for multiple tasks to have access to read-only arguments. As figure 5.6a shows, the region tree path between a parent and a child task may be split between two (or even more) levels of schedulers. In such a case, for task spawns or task completions, we exchange a message between the boundary schedulers with enough information to continue the operation as needed. Task spawning is the most expensive operation, as it requires multiple traversals, because the parent task can spawn a child that is arbitrarily deep in the region hierarchy. In the example, parent() owns region A and spawns child() to operate on object 1. Section 5.3.3 explained how Myrmics schedulers keep sufficient information to locate object 1 in O(1) time, if it is in the same scheduler as parent(), or to indicate which scheduler must be contacted next to go towards the object. However, there is no information about which exact regions lie in the path from A→1, i.e., B and F in this case6 . To discover the path, we locate the target (possibly by messaging the scheduler where it resides) and follow parent pointers until we encounter the parent task, keeping track of the intermediate regions through which we pass. We then begin the downwards traversal, as 6 We specifically choose not to keep such information. which would lead to a non-scalable setup. Each time a new region or object was created, we would have to update all regions up to the root of the region tree to include the path towards the task.
5.5. Task Scheduling
t1() t2() t3() t4() S0
t1(), t3()
S2
t9()
A
2 t2()
t5() t6() t7() t8()
B
C
1 t1() w0
t9()
67
3 t3()
4 t4()
5 t5()
6 t6()
w1 t2(), t4()
S1
D
S0 1
t5(), t7()
(a) All workers working on objects
w3 t6(), t8()
w0
S2
t9()
A
B
C
7 8 t7() t8() w2
t9()
2,4
2
w1
t9()
S1
D
3
4
5
5,7 6,8
6
7
w2
8
w3
(b) Worker 0 doing a reduction
Figure 5.7: Scheduling example
described previously, which may involve additional messaging. Throughout the dependency analysis, each Myrmics scheduler minimizes the number of messages among schedulers by considering all task arguments simultaneously: schedulers group necessary communication and pack information for multiple task arguments into as few messages as possible. We further analyze these message exchanges between boundary schedulers to avoid race conditions. Specifically, a hazard exists when a child boundary region finishes its last task and sends an upward message to notify its parent region that it is finished, while at the same time a new task passes through the boundary parent region and sends a message to the child to enqueue it there. We avoid this race by employing “parent” counters in every region that track how many enqueue requests have been received from its parent. When the dependency queue becomes empty, the child scheduler includes the number of completed enqueues from this counter to the message towards its parent scheduler. The parent compares this number to its child counter and disregards the request to proceed to the next task if the numbers do not match. Figure 5.6b shows these counters as “p” (for “parent”). As t2() completes (right-hand part of the figure), the parent counter in region D has the value 1. Thus, 1 is decremented from region B child counter.
5.5
Task Scheduling
Each task in Myrmics is assigned to one of the schedulers, which is responsible to monitor it until it completes. When a parent task spawns a new child, the responsible scheduler of the parent task handles the spawn request. The scheduler inspects the arguments that the new task requires and has two options: either to create the new task locally, or to delegate it to one of its child schedulers, if it has any. We decide to delegate a new task to a child scheduler only when all task arguments are handled by this single child scheduler or its children. To illustrate this concept, figure 5.7a shows both a region tree and how we split it among three schedulers. Task t1() operates only on object 1. Let us assume that the scheduler responsible for t1()’s parent task (not shown in the figure) is S2. Upon the creation of t1(), S2 observes that its arguments (object 1) are assigned to S0. Thus, the creation of t1() is delegated to S0. Using this memory-centric criterion to balance the task scheduling load among schedulers is consistent with our key design choices, as explained in section 5.1. After a task is created, the dependency analysis subsystem takes over to guarantee that all task objects and/or regions are safe to be used according to requested read/write privileges. When the task is dependency-free, it becomes ready to be scheduled for execution. To make an informed decision, the scheduler responsible for the task initiates a packing operation for
68
Chapter 5. The Myrmics Runtime System
all task arguments (section 5.3.2). Packing creates an optimized, coalesced list of address ranges and sizes of all the regions/objects, grouped by the last producer of each such range. The last producer of data in Myrmics is defined as the last worker core that had write access to it. Packing is a process carried out by the memory subsystem, which may be hierarchical and require communication among other schedulers lower in the hierarchy. In figure 5.7a, packing region A is required to schedule t9() when it becomes dependency-free. S2 will exchange messages with S0 and S1 to pack regions C and D respectively. When packing of all task arguments is complete, the scheduling begins. The total sizes of task data arguments per last producer are used as weights to create a locality score, L: scheduling the new task to a core that has produced a large part of the data it needs, yields a higher locality score. We also compile a load-balancing score, B, based on periodic load report messages that flow upstream in the core hierarchy. Both L and B are normalized between 0 and 1024. We combine them to create a total score, T = pL + (100 − p)B, where p is a policy bias percentage that we can use to favor one of the two scores over the other. We evaluate the policy bias effect in section 5.8.2. The scheduling decision may again be hierarchical in nature. If the scheduler has child schedulers, its decision refers to scheduling the task to the part of the core hierarchy managed by one of its scheduling children. The process repeats until a leaf scheduler decides which of its workers will run the task. The scheduler responsible for the task dispatches it for execution towards the chosen worker core. At the same time, if any of the task arguments were requested for write access, it informs the memory subsystem that from now on the last producer is the chosen worker. Worker cores run a very small portion of the Myrmics runtime system. They await messages from their parent schedulers, which dispatch tasks to them to be executed. Workers implement ready-task queues to keep these task descriptors. Some task arguments may be local to the worker core —if it was the last producer for them— and others may be remote. The worker orders a group of DMA transfers for all remaining remote arguments to be fetched from their last producers. The first task in the ready-task queue is allowed to begin execution when the DMA group has successfully completed. Figure 5.7 shows an example. In the left sub-figure, eight tasks t1()–t8() operate on eight different objects. Each worker w0–w3 has two tasks in its ready queue. In the right sub-figure, after all eight tasks have finished, task t9() (which will perform a reduction on the whole region A) is now dependency-free and scheduled to run on worker w0. To do so, w0 performs DMA transfers for objects 2, 4, 5, 6, 7, 8 from their last producers. Whenever two or more task descriptors exist in the queue, the worker optimizes the DMA transfers by ordering the DMA group for the second task to the NoC layer before it starts executing the first task. This technique allows for efficient double-buffering, as communication for the next task is hidden by the hardware during computation of the current task. Workers do not interrupt running tasks. If a task calls the runtime for any reason (e.g., to spawn a new task or to perform a memory operation), the NoC layer checks for new messages and progress of outstanding DMA transfers.
5.6 Traces and Statistics We use the Paraver tool [12] to visualize traces of application runs. Myrmics implements a mechanism to keep a limited number of per-core traces. Interesting points in scheduler and worker cores are kept in predefined software buffers along with a timestamp, such as different message type reception by schedulers, replies to these events and worker loop states. When the application finishes, Myrmics compensates for any hardware clock drifts across all involved CPUs and converts all timestamps to a common timeframe. All cores in turn dump their encoded event buffers over the hardware prototype serial port. The remote man-
5.7. Filesystem
69
agement environment of the prototype uploads it to the host machine, where a script converts it to appropriate Paraver format. This visualization process proved helpful to optimize both the runtime system code, as well as to ensure the efficiency of the application benchmarks that we present in the next section. Figure 5.8 shows a typical Paraver screenshot from a Myrmics benchmark running on 128 worker and 8 scheduler cores. Each row plots the behavior of a core in time, where gray (dark) denotes idle behavior and other colors (light) denote activity. The first 128 rows show the workers, the next 7 the level-1 schedulers and the last row the top-level scheduler. In the start of time, only worker 0 (top row) is active as it initializes data structures and starts spawning tasks. The shown benchmark has a fork-join structure, where in the start of each loop repetition multiple tasks are spawned and in the end of each loop repetition their results are reduced. The figure shows 8 loop repetitions, seen as vertical “gaps” of idle time where only a few workers and all the schedulers are busy handling the forks and joins. Myrmics also gathers various statistics throughout application execution, to help quantify how scheduler and worker cores spend their time. For worker cores, we count how much time they are in the idle state (no task available to run), in the working state (executing a task) or in the waiting state (a task calls the runtime and waits for a response). We also count how many tasks are executed by the worker core, how many messages it has exchanged with its parent scheduler, how many DMA transfers it has made and what is the total size of these transfers. For scheduler cores, we count how much time they remain in the idle state (waiting for any message to arrive), in memory-related states (working to respond to memory allocation, freeing or packing requests), or in processing-related states (working to respond to dependency-analysis and task scheduling requests). We also track the number of tasks for which the scheduler core is responsible and how many messages it exchanges with other schedulers or workers. These statistics are reported when the application finishes.
5.7
Filesystem
Before we design the Myrmics filesystem, we implement the CompactFlash device driver and perform some initial speed tests, which affect our choices for the filesystem. The implemented driver has the capabilities to reset the CompactFlash controller, to query it about the currently inserted card, to read and to write individual sectors using LBA addresses and also to read and to write bursts of any amount of sectors with a single ATA command7 . Measurements of the different burst sizes for ATA write commands are shown in figure 5.9a. We write quantities from 1 up to 256 sectors (shown in the X axis) using different burst sizes in the device driver (each line represents a different burst size choice; e.g., “bs=4” means four 512-byte sectors per burst). The test uses scattered sectors, to exclude any hardware controller optimization. Larger burst sizes are faster, because the data words that are given to the Flash controller are fewer for the same transfer size. We chose a 4-KB block size. This choice is reasonable for a typical filesystem, reduces the number of indirect blocks and also helps to alleviate some overhead, as the purple (empty square) line (bs=8) indicates in figure 5.9a. Figure 5.9b shows measurements of the implemented 4-KB block reads and writes, which also include our implemented CRC-64 checksumming overhead that we discuss below. The read performance is linear: each block is read in 1.68 msec. Writes introduce some variability. We use combined erase-writes, where the block is first erased and then written with its new value. This test uses linearly increasing block numbers, so we can guess from the write speed that probably the underlying erase block size could be 32 blocks (128 KB) —small “step7
The ARM Versatile Express motherboard peripheral does not support DMAs for the CompactFlash.
70
Chapter 5. The Myrmics Runtime System
Figure 5.8: A Paraver trace of the K-Means benchmark on 128 workers (top rows), 7 leaf schedulers and 1 top-level scheduler (bottom rows).
5.7. Filesystem 16384
160
bs=1 bs=2 bs=4 bs=8 bs=16 bs=32
1024 256 64
120
16
100 80 60 40
4 1
Read time Write time
140 Time (msec)
4096 Time (msec)
71
20 1
2
4 8 16 32 64 Number of sectors written
(a) Variable length block speeds
128
256
0
0
5
10 15 Number of blocks
20
25
(b) 4-KB block speed
Figure 5.9: CompactFlash measurements
like” patterns can be discerned every 32 blocks. We deduce that the controller caches up to 128 KB while erasing the block and then fills it up from the cache: the jump from 32 to 33 and around 64 indicates this behavior, which is strengthened by the fact that 128 Kbytes is a common size for Flash erase blocks. Each 4-KB block includes an 8-byte CRC-64 checksum, which is based on the ECMA182 standard polynomial [112]. We use a look-up table of 256 entries, which speeds up the algorithm considerably: each data byte is XORed once with the looked up entry and the CRC is shifted to the left. The CRC-64 is computed every time a block is written to the Flash and appended to the last 8 bytes of it. Whenever a block is read from the Flash, the CRC-64 is computed on the first 4092 bytes of the block and then compared to the last 8 bytes written in it: if the comparison fails, a CRC error is returned. Table 5.1 shows the structure of the six block types used in the Myrmics filesystem. The first three (Inode, Indirect and Data) comprise most of the filesystem and store all the data and metadata. The fourth type (the Delete block) is used to reclaim space and the last two types (Checkpoint and CheckpointBitmap) are used for checkpointing. We discuss the block types in more detail in the next paragraphs. Log and Checkpoints The Myrmics filesystem is log-structured: its data and metadata are stored in a cyclical log, excluding the two special Checkpoint blocks that are located in the first and the last block of the device. Figure 5.10a shows the concept of the cyclical log. The log head is the first candidate block to be written after a successful Checkpoint operation. Blocks are written in succession in increasing block numbers. The filesystem uses a threaded log structure; new blocks are written only in free positions. When old, used blocks are encountered, the log does not move them. It instead finds the first free block after all used ones and uses it. The current candidate block to be written after all log entries is called the log tail. Each block carries its header and log_seq_id fields. We use the header to differentiate the block types as well as to carry two transaction flags, one for transaction start and one for transaction end. Whenever blocks are written to the log, an always incrementing by 1 log_seq_id is written to them. Each basic filesystem operation is enclosed in a transaction group. The log replay uses both the log_seq_id and the transaction flags to work correctly. The replay considers as valid only the blocks that have their log_seq_id field equal to the current in-memory log_seq_id+1. Moreover, blocks are only considered in transaction groups; if any block fails between a transaction start and a transaction end header, the whole transaction is discarded and the log replay terminates. To know whether a block is free or used, the filesystem maintains a free blocks bitmap
Chapter 5. The Myrmics Runtime System 72
Indirect header [4] log_seq_id [4]
data blocks [4,076]
Data header [4] log_seq_id [4]
free blocks [4,076] (1,358 pointers)
Delete header [4] log_seq_id [4]
data blocks [4,068] (1,356 pointers)
Checkpoint header [4] log_seq_id [4] log_head [4]
next [4] CRC-64 [8]
bitmap [4,076] (32,608 bits)
CheckpointBitmap header [4] log_seq_id [4]
Inode header [4] log_seq_id [4] inode_num [4] timestamps [12] size [4] attributes [12] data blocks [4,072] (1,357 pointers)
inode_map [4] free_bitmap [4] CRC-64 [8]
data blocks [4,036] (1,345 pointers)
free_inode [4] CRC-64 [8]
indirect [4] free_block [4] CRC-64 [8]
free_block [4] CRC-64 [8]
indirect [4] free_block_0 [4] free_block_1 [4] CRC-64 [8]
Table 5.1: Structure of the filesystem block types. Byte lengths for each field are in square brackets. Each block has a total of 4,096 bytes. The header, log sequential ID and CRC-64 fields are present in all block types.
5.7. Filesystem
73
in memory, using one bit per every device 4-KB block. A second in-memory structure is the inode map, which maps every filesystem inode to a device block number. These two structures are transferred periodically to the log during the checkpointing process. Checkpointing is shown in figure 5.10b. Two Checkpoint blocks exist in the first and last device blocks. When a new checkpointing process begins, one of them is alternatively used. During filesystem mount, their log_seq_id entries are used to discover which one of them is the newest. The Checkpoint block itself contains a pointer to the log head after the checkpoint and a pointer to the start of the free bitmap list. The first 1,356 entries of the inode map are contained in the Checkpoint block itself, whereas the rest of them are stored using Indirect blocks. Each Indirect block holds 1,357 more inode map entries and contains a pointer to the next Indirect block (the indirect field in the table). The inode map entries are laid out in order. For the current maximum of 10,000 inodes in the filesystem, 7 Indirect blocks are used to store the whole inode map. The CheckpointBitmap blocks that are used for the free bitmap list can hold up to 4,076 bytes, which translates to 32,608 bits for an equal amount of blocks. As with the Indirect blocks, a CheckpointBitmap block contains a next entry that points to the next CheckpointBitmap block. For a 2 GB CompactFlash card, which has 512,316 blocks, we need 16 CheckpointBitmap blocks to store the whole free list. As with the inode map, the free bitmap is also laid out in order. The inode map and the free blocks bitmap are kept in memory in a ready-to-dump “live” block format. During checkpointing, the inode map indirect blocks are appended to the log, last to first, and each Indirect updates its indirect field to point to the previously written block. The same process is performed for the free blocks bitmap. The Checkpoint block itself is written last and contains the pointers to the first inode map Indirect block and the first CheckpointBitmap block, along with the current Root Inode of the filesystem (which is simply the inode for the “/” directory) and the current log tail, written as the checkpoint log head. If anything fails during the checkpointing process, including failure of the Checkpoint block writing itself, the mount process will deduce that this checkpointing did not complete; the other Checkpoint block will have a valid CRC-64 and it will be used instead. The log replay process is covered later in more detail. We only note here that the log is replayed only on the free blocks as they are viewed by the latest checkpoint, i.e. its free bitmap. When anything is appended to the log, a valid free block from the in-memory free bitmap is used. When the log is replayed, the same valid free block from the checkpoint free bitmap will be found. The only complication is that if we allow blocks to be freed just ahead of the log write direction and we use them immediately, the in-checkpoint free bitmap will not guide us to use the correct block and the replay process may be erroneous. To avoid this problem, we keep two views of the free bitmap in memory: the real version and the conservative version. When a block is marked as “free”, we only update the real version. When a block is marked as “used”, we update both versions. When we search for the next free block to write to the log, we use the conservative version, which happens to be consistent with the latest checkpoint’s view of which are the free blocks in the filesystem. When we take a next checkpoint, we synchronize the in-memory structures (the real view is copied onto the conservative view) and we dump the real view on the disk. Files and directories The Myrmics filesystem follows the UNIX tradition of inodes. As seen in table 5.1, all metadata for files and directories are held in Inode blocks. An Inode block contains a unique, reusable inode number for the file or directory —as previously stated, this inode number is also reversely mapped to the block number of the inode through the inode map structure.
74
Chapter 5. The Myrmics Runtime System Log write direction
Log head
old block Log tail free block
Checkpoint Inode map indirects
(a) Log structure
Old parent New file inode direntry
Parent direntry
Parent inode
Checkpoint free blocks bitmap
Root inode
(b) Checkpointing
Old parent inode
Old last Modified New New Modif. Old Modified Old ind. ind. inode last data data ind. data inode block block block
(c) Creation of a zero-length file
(d) Append to file
Old Deleted Deleted Delete Modified Modified Old file block direntries inode direntries inode data blocks inode
(e) Delete entity
Figure 5.10: Myrmics filesystem operations
The timestamps carry the creation time, accessed time and modification time. The size field contains the file size in bytes, in the case of file inodes, or the directory entries, in the case of directory inodes. The attributes fields contain the user ID, group ID and read-write-execute POSIX-like flags. The data_blocks fields contain up to 1,345 three-byte pointers to data blocks. In the case of files, these are Data blocks that contain the actual file data. In the case of directories, these are Data blocks that contain directory entries (dirents), which map a 64-B name to an inode number. Finally, Inode blocks have an indirect field, which is used only for files. It can link to an Indirect block, which stores 1,357 more pointers to Data blocks. Since every Data block holds up to 4,076 bytes of data, a file of up to 5.23 MB can be stored on disk using only its Inode block; bigger files need to use Indirect blocks, each Indirect covering for 5.27 additional MB. Figure 5.10c shows how a new zero-length file is appended to the log. First, the new file gets a new inode number from the in-memory inode map and a new file inode is written to the log. The new file name and its inode number is added to its parent directory direntry block, which is a regular Data block. Then, the parent directory inode itself is updated, because the pointer to its modified direntry block is updated —and we also need to update its size and attributes. Thus, three new blocks were added to the log for this operation. Two of them (the parent direntry data block and the parent inode) already existed and were modified. The new block numbers are considered “used” in the free blocks bitmap and the old block numbers are considered “free” (in the real view). In order for this information also to be accessible during log replay, most of the block structures shown in table 5.1 also contain free_block fields, which do exactly that. An Inode can free up to two blocks, an Indirect block or a Data block can free up to one block. In the example of figure 5.10c, the modified parent direntry data block specifies the old block that it replaces in its free_block field and the modified parent inode specifies its own old inode there; these are shown as red (dimmed) arrows in the figure. The three new blocks are also part of a single transaction: the first block (the new file inode) specifies a transaction start flag in its header and the last
5.7. Filesystem
75
block (the modified parent inode) a transaction end flag. The log replay treats these blocks as atomic; if any of them was not successfully written in the log, none of them affect the filesystem state and it’s like the new file was never created and its parent directory remains untouched. Figure 5.10d shows a more complicated example. It refers to the case of appending data to a file that is already using a single indirect block. This example represents the worstcase append scenario, in which part of the new data fills the rest of the partially filled last data block, a new data block is allocated for the rest of the new data and this new data block cannot fit in the existing indirect block because it is full; a new indirect block must be allocated. First, the partially filled old last data block is filled with the first part of the new data; its free_block pointer is used to free the old last data block. Then, the second part of the new data is written in a new data block. A new indirect block is allocated that points to the new last data block. The modified indirect block is written to point to the previous data block and also to the new indirect node; its free_block pointer frees the previous indirect node. Finally, the modified file inode (containing the new file size and attributes) is written, pointing to the modified indirect block and freeing the old file inode block. The transaction flags in this case include the new four blocks, grouping together the file data and metadata modification. Creation of new directories is similar to new files: a new directory inode is created (with no data blocks for its direntries, meaning it is empty) and its parent directory is updated to hold the new entry name and inode number. File and directory deletions are a bit trickier. First, the actual data blocks and file inode (in the case of files) are deleted. In the case of directories, we support only deletion of empty directories, so only the directory inode must be deleted. Second, the parent directory entry is removed. This removal is handled by replacing the deleted direntry with the last direntry of the directory. If we are deleting the last (or only) direntry, no replacement is done. The problem in these cases is that the remaining modified blocks do not have enough free_block fields to hold the —possibly big— number of deleted blocks. Also, there is no way to indicate that an inode number is now free. To this purpose, the Delete block was introduced. It contains 1,358 block numbers to be deleted, along with a single inode number to be deleted. One or more such blocks are used when a file or directory deletion is performed, depending on how many blocks must be freed. Figure 5.10e shows an example of a small file deletion, where only two data blocks were used by the file. First, a Delete block is appended to the log, containing pointers to all file data blocks and its inode. If the file had indirect nodes, these would be also linked to one of the multiple Delete blocks. Then, the parent directory is modified to delete the file entry, replacing it with the last entry in the directory. Here we show the worst case, where these two are in different direntry data blocks. Both are modified, freeing their old data blocks at the same time. Finally, the modified inode is written, pointing to the two modified direntry data blocks and having its size decremented by one. Note that inodes can free up to two blocks: in the case that we were deleting the last entry of a directory and this was causing the modified direntry data block to be deleted, the second free block would be used to indicate this case. The Delete blocks themselves do not consume space on the filesystem. When they are written, they are immediately freed in the conservative view of the free blocks bitmap. This ensures that if the filesystem is not cleanly unmounted the Delete blocks will be encountered by the log replay, but also makes sure that whenever the next checkpointing happens they are immediately considered free —which is legal, since a successful Checkpoint makes them obsolete; the information about the free blocks is now safe in its CheckpointBitmap blocks.
76
Chapter 5. The Myrmics Runtime System
Log replay When the filesystem is mounted, both the first and last device blocks are read. A valid Checkpoint may be found in both of them (normal scenario), or in one of them, if the system crashed during a Checkpoint block write. In the general case, both of them are read and the one with the newest log_seq_id is considered. Wrap-around issues of the log_seq_id are handled by splitting the 32-bit space of log_seq_id entries in four quadrants and considering that the newest checkpoint is the one that is in the next quadrant of the other.8 The winner checkpoint’s inode map indirect blocks and free bitmap blocks are read. They are both used to construct an in-memory view of the filesystem exactly when the checkpoint was taken. The inode map has block pointers to the correct version of blocks at that time and the free bitmap specifies which blocks were free at this point. The log tail is set to be the checkpoint log head, which specifies the position of the first candidate free block. The system log_seq_id is set to the Checkpoint block log_seq_id+1. Having restored the checkpoint state, we then check if the filesystem state is clean, i.e., if the first free block of the system does not contain a valid log entry. A valid log entry is defined as a correctly written block (its CRC-64 is intact) that bears a log_seq_id equal to the system log_seq_id with a transaction start flag set. If no such block is found, it means that the filesystem is clean. Otherwise, we begin the transaction replaying loop. For each transaction, we read blocks from the transaction start flag until we encounter a transaction end flag. All blocks should be intact and have a proper log_seq_id. While we are reading them, no filesystem state change is done; we only remember all relevant information from the blocks. The first piece of information gathered from all transaction blocks is their block number. These blocks should be marked as “used”. Delete blocks are also remembered to be set “free” after they are marked as used, so they can be free in the real view but not the conservative view. The second piece of information gathered is all fields that free blocks. These are also to be set free. The final piece of information is new (or modified) inodes. We keep both the block number and the inode number, so that the inode map can be updated accordingly. This update includes deleted inode numbers. As soon as we reach the transaction end flag without encountering any errors, we apply all filesystem changes that we recorded and move on to the next transaction. Also, the system log tail and log_seq_id are advanced to the new position. Any failure during the information gathering causes us to abandon the whole transaction and to end the log replaying.
Complexity Table 5.2a shows the analytical estimation of the read and write cost in blocks for each one of the primitive operations we discussed for the Myrmics filesystem. The variance in numbers represent worst-to-best case scenarios, depending on the fullness of data structures and/or usage of Indirect blocks. Table 5.2b shows how these primitives are combined to provide the Myrmics filesystem functionality. The sum of the respective primitive cost represent the final cost for each filesystem operation. To be pedantic, this enforces a checkpointing process at least whenever 230 blocks are written. We also have the requirement that the log itself cannot wrap around before a checkpoint, because we will run out of conservative space. We limit the maximum filesystem size to 64 GB, so this is guaranteed by the 224 blocks constraint. 8
5.8. Evaluation
Primitive create inode delete inode find last direntry find named direntry add direntry delete direntry file seek file read file append
77 Read blocks 0 1+I 1 …2 1 …E 0 0 2 …I+2 N +I 0
Write blocks 1 D 0 0 2 1 …3 0 0 N +I +1
Filesystem operation create entity
delete entity
file read file append search directory
(a) Block layout primitives cost
Primitives used find last direntry create inode add direntry find named direntry find last direntry delete inode delete direntry file seek file read file seek file append find named direntry
(b) Filesystem operation cost
Table 5.2: Myrmics filesystem complexity. In (a), we show the basic primitives complexity in terms of how many CompactFlash 4-KB blocks will be read and written. E is the number of direntries in a directory inode, I is the indirect nodes of a file, N is the amount of data blocks to be read/written from/to the file, D is the needed Delete blocks for the deleted file. In (b), we show the filesystem operations. The complexity of an operation is the sum of the respective block primitives.
5.8 5.8.1
Evaluation Memory Management Subsystem on an MPI Cluster
The Myrmics memory allocator was developed earlier than the rest of the system, during an internship in Lawrence Livermore National Laboratory (LLNL), at which time the FPGA prototype was still under construction. To speed up the overall development of Myrmics, we decided to debug and to verify the memory allocator by itself, using the cluster supercomputer facilities available in LLNL. This section describes the evaluation of the stand-alone Myrmics memory management system. We create a temporary architecture-specific layer wrapper using processes running on MPI clusters over a Linux operating system. We devote one MPI process for each worker and each scheduler core. MPI processes request all memory in advance from the Linux kernel, through large mmap() calls. This memory is subsequently managed by the memory allocator by intercepting all glibc allocation calls. We use a single runtime kernel slab pool for both the allocator and for the MPI library. The runtime kernel slab pool is private per processor, but we do not otherwise separate address spaces or vary privilege levels. For the stand-alone memory allocator evaluation, we only use the object and region allocation/freeing calls from the Myrmics API of figure 3.3 (page 19). As the stand-alone allocator has no task support, we temporarily extend the API with three more calls. The sys_send() and sys_recv() calls take a target MPI rank and a variable number of region IDs or object pointers as arguments. Internally, we translate these arguments to lists of addresses and sizes (by packing regions and querying pointers) and then wrap around the respective MPI_Send() and MPI_Recv() calls. Also, a sys_barrier() call performs an MPI barrier among all worker cores. Applications written in this temporary programming model are essentially MPI programs (communication is explicitly defined by the application), but enjoy the benefits of a global address space with region support. We develop a number of microbenchmarks as well as two larger, application-quality benchmarks. We use a number of small test programs to test the allocator and to verify its correctness. Apart from these, we also present the results on four benchmarks: (i) a non-
Chapter 5. The Myrmics Runtime System
40 30 20 10 0
Time
160
40
140
35
Full slabs Partial slabs 120 Application size
Number of slabs and ranges
50 Application size (KB)
200 Full slabs 180 Partial slabs 160 Application size 140 120 100 80 60 40 20 0
Number of slabs and ranges
Application size (KB)
78
30
100
25
80
20
60
15
40
10
20
5
0
0
Time
2250 2000 1750 1500 1250 1000 750 500 250 0
Time
Execution time (seconds)
9 Full slabs 8 Partial slabs 7 Application size 6 5 4 3 2 1 0
Number of slabs and ranges
Application size (MB)
(a) Fragmentation, 192-B objects, 60% allocs, 40% (b) Fragmentation, 192-B objects, varying probabilities frees
500 400 300 200 100 0 Serial 1
2
4 8 16 32 64 128 256 512 Number of workers
100
60 40 20 15,000
400 200
30,000 60,000 120,000 Number of objects
240,000
(g) UPC, 16 workers, varying number of objects
Serial
1
4 16 64 Number of workers
600
256
Computation Worker comm Sched comm Barrier wait
500 400 300 200 100
0 Serial 1 2 4 8 16 32 64 128 256 512 (1) (1) (1) (1) (2) (4) (8) (16) (32) (64) Number of workers (number of L1 schedulers)
512
UPC Myrmics
80
0
600
(f) Barnes-Hut, 1.1M bodies, Multiple schedulers
Execution time (seconds)
Execution time (seconds)
(e) Barnes-Hut, 1.1M bodies, Single scheduler
800
(d) Delaunay, 5M points, Single scheduler Execution time (seconds)
Execution time (seconds)
Computation Worker comm Sched comm Barrier wait
600
1000
0
(c) Fragmentation, 6 object sizes, varying probabilities
Computation Worker comm Sched comm Barrier wait Linear speedup
1200
256 128
UPC Myrmics, flat Myrmics, hierarchical
64 32 16 8 4 2
16
32 64 Number of workers
128
(h) UPC, 30K objects, varying number of workers
Figure 5.11: Evaluation of the Myrmics memory allocator on a high-performance x86_64 cluster, using an MPI communication layer over an Infiniband network.
5.8. Evaluation
79
MPI, single-core, random object allocator that analyzes the fragmentation inside a region slab pool, (ii) a parallel, region-based, Barnes-Hut N-body simulation application, (iii) a parallel, region-based, Delaunay triangulation application and (iv) a comparison to Unified Parallel C for dynamically allocated lists. All MPI-based measurements are done on the LLNL Atlas cluster. Atlas has 1,152 nodes, each of them equipped with four Dual core AMD Opteron 2.4 GHz processors and 16 GB of main memory. The machines are interconnected with an Infiniband DDR network. Fragmentation measurements Our first benchmark, a serial program, allocates and frees objects within a single region. The application tracks all allocated pointers and randomly either allocates an additional object or frees a randomly chosen existing object. Figure 5.11a presents an execution for single-sized 192-B objects, with a 60% probability of allocating a new one and 40% probability to free one. The gray (dotted) line shows the application-requested size of all active objects with units on the left Y axis. The right Y axis shows the number of full and partial slabs. While the total number of objects grows, the allocator can compact most objects into full slabs; the number of partially filled slabs is kept constantly low. Full slabs are demoted to partial ones whenever a free is performed. Figure 5.11b, in which we vary the alloc/free probability in phases, shows this issue more clearly. The phases can be allocation-intensive or free-intensive as indicated by the slope of the application size curve. When frees are more common, full slabs become partial as they develop “holes” of 192 bytes. When the application returns to an allocation-intensive phase, first all holes in the partial slabs are discovered and plugged. We observe that this behavior is consistent with our prime concern to keep a region as packed in full slabs as possible, so that a region communication operation can access few address/size pairs. In figure 5.11c, the application runs with the same alloc/free phases, but uses six object sizes randomly during allocation. Three sizes are aligned to the slab size (64, 1024 and 4096 bytes), and the other three are not (192, 1536 and 50048 bytes). Behavior is similar to the previous measurements, although the large objects (4096 and 50048 bytes) consume correspondingly more full slabs and thus the ratio of full to partial slabs is much greater. Barnes-Hut N-Body simulation The second benchmark is a 3D N-body simulation application that calculates the movement of a number of astronomical objects in space as affected by their gravitational forces. To avoid O(N 2 ) force computations, the Barnes-Hut method approximates clusters of bodies that are far enough from a given point by equivalent large objects at the clusters’ centers of mass. From the many variations of the Barnes-Hut method in the literature, we choose to start with the Dubinski 1996 approach [36], which is a well-known MPI-based implementation. This approach dynamically allocates parallel trees, parts of which are transferred among processors. Thus, it is a prime candidate for region-based memory allocation. Dubinski employs index-based structures with non-trivial mechanisms to allow for efficient transfer, pruning and grafting of subtrees over MPI. Our temporary programming model supports a much more intuitive, pointer-based implementation in which we can easily graft trees since pointers retain their meaning after data transfers. MPI-based applications commonly resort to complex, “assembly-like” techniques to marshal data efficiently for transfers. The Myrmics allocator automates this tedious task. In the Barnes-Hut benchmark, each worker core builds a local oct-tree in each simulation step for each body that it owns. We build the tree with each level belonging to a different
80
Chapter 5. The Myrmics Runtime System
memory region. The bounding box of the local bodies is communicated in pairs with all other workers, which compute based on that portion (i.e., number of levels) of the local tree that must be sent to the communicating peer. We send the respective regions en masse. After we fetch and graft the portions of the remote trees, we perform the force simulation and body movement in isolation. A recursive bisection load-balancing stage in which we split processors into successively smaller groups follows each simulation step. We cut and exchange bodies along the longest dimension, balancing the load based on the number of force calculations that each body performed in the previous iteration. The recursive bisection load-balancer requires that the number of worker cores is a power of two. Figure 5.11e presents application scaling on up to 512 worker cores with a single scheduler core. For each run, stacked bars show the average time of each worker. Time is spent either communicating with other workers (“Worker comm”), communicating with the scheduler via any other API call (“Sched comm”) or doing local work (“Computation”). The first bar, marked “Serial” on the X axis, shows a single-core run in which the scheduler and a single worker are on the same processor. The next bar shows the scheduler and the single worker on separate processors. This distribution increases the cost of scheduler communication for the same work from 2% to 8%. For more worker cores, scaling is irregular, which is a data-dependent feature of the recursive bisection load balancer and the Barnes-Hut cell opening criterion, which needs more tree levels when any cell dimension exceeds certain quality constraints. Replacing the cell opening criterion gives much smoother scaling results, but unfortunately sacrifices simulation accuracy. A second observation concerns the scheduler communication time. As the application scales, each worker requires fewer allocations for its own tree, but the scheduler services more workers and its latency increases. This increase becomes a problem as early as in 32 cores, after which it grows worse. Last, worker communication becomes a bottleneck after 256 cores and overtakes the simulation time at 512 cores. Thus, the given problem size cannot scale further, which is a known limitation of this Barnes-Hut algorithm [36]. Figure 5.11f verifies our hypothesis that we can successfully distribute the memory allocation on multiple schedulers. In these experiments, up to eight workers are dedicated to a single scheduler. When multiple schedulers are present, they are organized in a two-level tree with a single top-level scheduler. The parenthesized number in the X axis specifies the number of leaf schedulers that we use. As expected, the scheduler communication time drops consistently as the application scales up to 128 workers. After that, the increased work needed to fetch all remote trees also involves the scheduler to pack all remote regions; this work appears as scheduler communication time. Delaunay triangulation Our third benchmark, a Delaunay triangulation algorithm, creates a set of well-shaped triangles that connect a number of points in a 2D plane. Delaunay triangulation is a popular research topic with many serial and parallel algorithms. We base our code on the implementation of the serial Bowyer-Watson algorithm by Arens [3]. The algorithm adds each new point into the existing triangulation, deletes the triangles around it that violate the given quality constraints and re-triangulates the convex cavity locally. We use the optimization that Arens described to walk the neighboring triangles in order to determine the triangles that build the cavity quickly. The Bowyer-Watson algorithm is difficult to parallelize, so it is an active research topic; Linardakis [70] wrote an extensive survey on the subject. State-of-the-art distributed memory approaches combine algorithms of great complexity, such as graph partitioning and multiple passes that handle the borders of the decomposition. Understanding and modifying
5.8. Evaluation
81 2
3
6
7
7
2
3
6
0
1
4
5
5
0
1
4
10
11
14
15
15
10
11
14
8
9
12
13
13
8
9
12
8
9
12
13
13
8
9
12
2
3
6
7
7
2
3
6
0
1
4
5
5
0
1
4
10
11
14
15
15
10
11
14
Figure 5.12: Parallelization of the Bower-Watson algorithm on four cores. Each core works on four sub-quadrants, which successive rotations to the right, down, left and up communicate among cores.
these algorithms to use regions effectively is beyond the scope of testing and evaluating the memory allocator, so we follow a simpler parallelization approach. Our benchmark uses a grid decomposition to divide the 2D space statically into a number of regions equal to four times the number of worker cores. Each region holds the triangles with circumcenters within its bounds. All regions are at the lowest level of a hierarchy with a degree of four; e.g., the top-level master region owns the whole space and its four children own one fourth of the space. Initially, after we create all regions, the space is empty except for placeholder triangles that form the borders. A single core begins the triangulation process by inserting a small number of points up to a limit. We dynamically allocate all triangles into the appropriate last-level regions of the hierarchy, according to the triangle centers. When we have inserted enough points to create an adequate number of triangles, the core delegates the four quadrants to three other cores and to itself and the algorithm recurses with four times more workers. Apart from the first step, in which a single core owns the entire space, points near the borders of the space owned by a core may need to modify triangles that belong to other cores. Our algorithm postpones the processing of these points, when three re-triangulation phases occur. Figure 5.12 shows the concept used with four active cores. The main triangulation is in the top-left, where each core owns a quadrant of space comprised of four sub-quadrants, which are the regions one level below in the region hierarchy. The first re-triangulation uses communication with other cores and rotates the four sub-quadrants to the right. For example, a point that needs triangles from regions 3 and 6 would be postponed in the main triangulation, but handled successfully by the blue core in the first re-triangulation. The two next re-triangulations rotate the sub-quadrants down and left, while a fourth rotation brings the sub-quadrants upwards back to their original position, in order to be split to more workers9 . 9 Our algorithm assumes each point can be triangulated within two adjacent sub-quadrants and requires the number of workers to be a power of four.
82
Chapter 5. The Myrmics Runtime System
Figure 5.11d shows the results for a triangulation with 5 million points. The dotted line represents the ideal scaling. We find that the scaling is superlinear due to the increased caching effects that the division of work has over the approximately 650 MB dataset. This memory locality effect is also apparent from the difference between the serial run and the one in which a single worker communicates with a single scheduler. In contrast to the BarnesHut runs, the two-process run is faster despite the MPI communication. Comparison to Unified Parallel C With our fourth benchmark, we compare the Myrmics memory allocator to Unified Parallel C (UPC) [107]. We use the Berkeley UPC 2.14.0 for these measurements. For the most faithful comparison possible, we instruct the UPC compiler to use its MPI backend for interprocess communication. Each worker core (in Myrmics) or thread (in UPC) begins by dynamically building a linked list of objects. After all cores are done, an all-to-all communication pattern happens in multiple stages, separated by barriers. In each stage, a pair of workers exchange their lists, the receiving core modifies all objects and the lists are swapped back to their original owners. In UPC, we allocate the list nodes in the shared address space of each thread using the upc_alloc() call. When the benchmark is in the exchange phase, each thread fetches a list node locally with upc_memget() for the node, modifies it and returns it to its owner with upc_memput(). In Myrmics, each worker creates a region and then allocates all list nodes inside it, which supports a more efficient exchange. To fetch a remote list, a worker fetches the whole region. We traverse the list nodes by following the pointers locally. When the whole list is modified, we send the region back in one operation. Figure 5.11g shows how the benchmark performs in UPC and Myrmics. For both implementations, we use 16 worker cores/threads; in Myrmics a 17th core runs the scheduler. All list nodes are 256 B (including the shared pointer to the next node), as dynamic memory allocation requests for typical applications are on average less than 256 B [16]. The X axis shows the number of objects that are allocated for each worker list. Myrmics performs 3.7–3.9 times better. Sending or receiving the whole list in one call more than compensates for communication between the scheduler and worker, which happens for every memory allocation, and region packing, while we must communicate the list nodes one by one in UPC. Figure 5.11h shows that the benchmark scales to more than 16 workers; the time scale on the Y axis is logarithmic. We keep the list size constant at 30,000 objects per core. We could not use larger problem sizes due to UPC’s limits on total shared memory available. When using a single scheduler core, Myrmics outperforms UPC by a factor of 3.8–7.0×. The scheduler overhead can be further improved when using hierarchical scheduling, which makes Myrmics 4.6–10.7× faster than UPC.
5.8.2
Myrmics Runtime System on the 520-core Prototype
Intrinsic Overhead This section describes the evaluation of the full Myrmics runtime system on the completed 520-core FPGA prototype. We discard the temporary sys_barrier(), sys_send() and sys_recv() calls that we employed in section 5.8.1 and use the full Myrmics API (section 3.3) with task-based benchmarks. We begin the Myrmics evaluation by measuring the inherent overheads of the runtime system. We consider these measurements to be very useful, as they establish a lower limit on
5.8. Evaluation
83
40K MicroBlaze Heterogeneous Cortex-A9
30K
256 Speedup
MicroBlaze clock cycles
35K
25K 20K 15K
64 16 4 1
10K 5K
2
0 Task Spawn
Task Execute
(a) Time to spawn and execute an empty task
8 32 Number of wo
128 rkers
8M 2M s) le 512K yc 128K (c e 32K s iz k 8K s 512 Ta
(b) Impact of task granularity on achievable speedup
Figure 5.13: Myrmics intrinsic overhead measurements
the task sizes that Myrmics can handle as well as how well the system can scale. We create a synthetic microbenchmark that spawns 1,000 empty tasks with the same one object as an argument. We use a single scheduler core and a single worker core. The worker first spawns all tasks and we measure how much time this takes. As there is no other worker in the system, it afterwards executes all spawned tasks in order, and we measure how long this takes as well. Figure 5.13a shows the results, normalized to the time for a single task (we divide the total times by 1,000). We do this experiment in three modes: with the scheduler and worker being MicroBlaze cores (left/dark blue bars), with a Cortex-A9 scheduler and a MicroBlaze worker (middle/red bars) and with both cores being Cortex-A9 (right/green bars). To have a common time reference, all results are measured in MicroBlaze clock cycles. We observe that the two CPU flavors have approximately a 7–8× difference in running time. As we are interested in the study of heterogeneous systems, for the evaluation that follows (except for the “Deeper Hierarchies” paragraph on page 90) we use the heterogeneous setup. This microbenchmark shows that to spawn an empty task with one argument, a Myrmics application needs 16.2 K cycles and to execute such a task it needs 13.3 K cycles. These times represent the minimum overhead to execute all appropriate runtime functions on the worker and scheduler cores, as well as all their communication. We create another microbenchmark to reproduce and to measure the single-master bottleneck in Myrmics. We use one scheduler core and a variable number of worker cores, from 1 to 512. We let the main task spawn 512 independent tasks, each one operating on a different object. The children tasks wait for a programmable delay before they return. Figure 5.13b shows the results. Axes X and Y represent our configuration (number of workers and the task size) and axis Z shows the achieved speedup vs. the single-worker configuration. We observe that the achievable speedup for a given number of workers is limited by the task size. Bigger tasks need scheduler interaction less frequently, which makes the single scheduler more available to other workers. We can also see that there is a speedup-optimal number of workers for a given task size (filled circles in the figure). Near the optimal point the scheduler processes tasks and fills the worker queues fast enough so that the workers are always busy. Adding more workers degrades performance, because there are more events for the scheduler to process (task completions) in less time, while new tasks always go to new, empty workers. We expect that the number of optimal workers is found by dividing the task size by the intrinsic overhead per task (16.2 K cycles). The experiment verifies this: e.g. for 1 M task size figure 5.13b shows the optimal point to be 64 workers, near the computed 64.7 (1 M / 16.2 K). A final observation is that for a given number of workers, bigger
84
Chapter 5. The Myrmics Runtime System
1024
1024 Perfect MPI Myrmics (hier) Myrmics (flat)
512 256 128
256 128
64
64
32
32
16
16
8
8
4
4
2
4
8
16
Perfect MPI Myrmics (hier) Myrmics (flat)
512
32
64
128
256
512
2
4
8
(a) Jacobi Iteration
64
128
256
512
128
256
512
256
512
1024 Perfect MPI Myrmics (hier) Myrmics (flat)
512 256 128
256 128 64
32
32
16
16
8
8
4
4 4
8
16
Perfect MPI Myrmics (hier) Myrmics (flat)
512
64
32
64
128
256
512
2
4
8
(c) Bitonic Sort
16
32
64
(d) K-Means Clustering
1024
1024 Perfect MPI Myrmics (hier) Myrmics (flat)
512 256 128
256 128 64
32
32
16
16
8
8
4
4 4
8
16
Perfect MPI Myrmics (hier) Myrmics (flat)
512
64
2
32
(b) Raytracing
1024
2
16
32
64
128
(e) Matrix Multiplication
256
512
2
4
8
16
32
64
128
(f) Barnes-Hut
Figure 5.14: Myrmics and MPI strong scaling results. The X axis measures the number of worker cores (Myrmics) or total cores (MPI). The Y axis measures speedup, normalized to single-worker performance (higher is better). Scheduler cores for Myrmics are as follows: 1 core for flat scheduling, or 1 top-level scheduler plus L leaf schedulers for hierarchical configurations, where L=2 for 32 workers, L=4 for 64 workers and L=7 for 128, 256 or 512 workers.
tasks always lead to higher speedup —and asymptotically towards the perfect speedup. Note that all these observations are also valid for hierarchical task spawning, as they refer to the inherent Myrmics overheads. Scaling We continue the Myrmics evaluation by running six benchmarks (five computation kernels and one application) and study how well they scale. For each benchmark that we describe below, we compare a baseline MPI implementation to two Myrmics variants: one with a single scheduler and one with multiple schedulers in a two-level hierarchical configuration.
5.8. Evaluation
85
256
256 Perfect Myrmics (flat) Myrmics (hier) MPI
128 64 32
64 32
16
16
8
8
4
4
2
2
1
1
0.5
0.5
4
8
16
Perfect Myrmics (flat) Myrmics (hier) MPI
128
32
64
128
256
512
4
8
(a) Jacobi Iteration
16
32
64
128
256
512
128
256
512
256
512
(b) Raytracing
256
256 Perfect Myrmics (flat) Myrmics (hier) MPI
128 64 32
64 32
16
16
8
8
4
4
2
2
1
1
0.5
0.5
4
8
16
Perfect Myrmics (flat) Myrmics (hier) MPI
128
32
64
128
256
512
4
8
(c) Bitonic Sort
16
32
64
(d) K-Means Clustering
256
256 Perfect Myrmics (flat) Myrmics (hier) MPI
128 64 32
64 32
16
16
8
8
4
4
2
2
1
1
0.5
0.5
4
8
16
Perfect Myrmics (flat) Myrmics (hier) MPI
128
32
64
128
(e) Matrix Multiplication
256
512
4
8
16
32
64
128
(f) Barnes-Hut
Figure 5.15: Myrmics and MPI weak scaling results. The X axis measures the number of worker cores (Myrmics) or total cores (MPI). The Y axis measures slowdown, normalized to single-worker performance (lower is better). Scheduler cores for Myrmics are as follows: 1 core for flat scheduling, or 1 top-level scheduler plus L leaf schedulers for hierarchical configurations, where L=2 for 32 workers, L=4 for 64 workers and L=7 for 128, 256 or 512 workers.
Hierarchical Myrmics benchmarks first use regions to decompose the computation to coarse tasks, each of which then spawns finer tasks with object arguments. In all MPI and Myrmics setups we hand-select the assignment of MPI ranks and Myrmics workers/schedulers, so that they map as well as possible to the physical topology of the 3D hardware platform. To demonstrate fine-grain task parallelism, we use task sizes down to 1 M clock cycles, which would translate to 0.25 ms tasks in a typical server. To measure strong scaling, we use a fixed problem size and split it into variable-sized tasks, according to the available workers. We decompose the problem to a few (2–3) tasks per worker and per computation step. We select dataset and task sizes that fulfill these constraints. To measure weak scaling, we use minimum-sized tasks and grow the problem size according to the available workers. The
86
Chapter 5. The Myrmics Runtime System
algorithms for the MPI and Myrmics variants are exactly the same. We pick non-trivial, optimized implementations that double-buffer the data structures, overlap computation with communication steps and perform broadcasts and reductions using scalable (e.g., tree-like) mechanisms. For each data point, a Myrmics worker and an MPI core perform the same amount of computation. We choose our benchmark kernels to test diverse kinds of parallel communication behaviors. The first kernel that we use is Jacobi Iteration. Its scaling results are shown in figures 5.14a and 5.15a. Jacobi Iteration is a subset of a linear algebra iterative solver. A table of values with a fixed border is split into multiple workers, where each worker takes a succession of rows. In each loop repetition, every table element is replaced by the average of its four neighbors (north, east, south, west). This kernel exhibits a nearest-neighbor communication pattern, because across loop boundaries each worker receives the top and bottom rows of its neighbors. The second benchmark kernel is Raytracing (figures 5.14b, 5.15b). A description of a scene geometry (objects, lights, camera) is made available to all workers. Each worker renders a part of a picture frame, by computing how light rays from the camera to the frame pixels interact with the scene objects and lights. This kernel is embarrassingly parallel, since apart from loading the scene description each worker computes its own frame parts in isolation. The third kernel is Bitonic Sort (figures 5.14c, 5.15c). Each worker begins with a part of the data to be sorted, and sorts this part. Afterwards, in a number of stages equal to the squared binary logarithm of the number of cores, workers exchange data and merge-sort their local buffers with the incoming ones. Bitonic Sort exhibits butterfly-like communication among workers in the data exchange phase. The fourth kernel is K-Means Clustering (figures 5.14d, 5.15d), which heuristically groups a big number of 3D objects into a few clusters based on the proximity of the objects. Beginning with a random cluster assignment, in each iteration the workers assign their share of objects to the clusters. In the end of each iteration, clusters are recomputed to be at the center of grouped objects. K-Means Clustering features parallel reductions and broadcasts. The final benchmark kernel that we use is Matrix Multiplication (figures 5.14e, 5.15e), which multiplies two dense arrays. Each worker has a part of the two source arrays and of the destination array. During each phase, a worker adds partial multiplication results to its destination array by doing a matrix multiplication of smaller parts of the two source arrays. This kernel exhibits communication bursts, as parts of the source arrays temporarily become hot spots that are shared by multiple workers for a computation phase. Finally, we evaluate Barnes-Hut, an application that uses pointer-based data structures and exhibits irregular parallelism (figures 5.14f, 5.15f). Barnes-Hut efficiently solves an N-body problem by grouping far-away collections of bodies into single bodies. The application is the same one that we presented in section 5.8.1, adapted from the temporary programming model to the three new variants (MPI baseline, flat and hierarchical task-based Myrmics versions). First, we observe from the scaling results that the MPI benchmarks scale almost perfectly (green/square lines in all figures). This behavior is expected, both because we employ wellknown parallelization methods and also because we have a lightweight MPI library implementation that runs on an emulated architecture of a single-chip manycore CPU with an efficient network-on-chip. We can therefore depend on the MPI benchmarks to provide a solid baseline for comparing the Myrmics performance on the same architecture. Super-optimal scaling is present in some strong scaling cases (figures 5.14c, 5.14e) where the per-worker task dataset fits entirely in the caches. Under-optimal weak scaling (figures 5.15c, 5.15e) is expected, as these algorithms have non-linear complexity when adding more workers. The Matrix Multiplication graphs have fewer data points, because the algorithm depends on the number of cores being a power of 4. The Barnes-Hut application does not scale well, because it involves many and complex steps, such as load-balancing exchanges, all-to-all
5.8. Evaluation
87
communication and phases with idle workers. We do not include numbers for 256 and 512 cores due to memory constraints, but the scaling already degrades after 64 cores. Our second observation regards how Myrmics scales using a single scheduler (red/cross lines). We can see that the single scheduler performs well up to a certain number of workers, depending on the benchmark. As we use a minimum task size of 1 M cycles, we expect the turning point to be 64 workers. This is confirmed for benchmarks that have bigger communication/computation ratio, such as Jacobi and Bitonic, while others are less affected. We verify our core hypothesis on hierarchical scheduling by observing how Myrmics scales when using a two-level hierarchy of schedulers (blue/circle lines). In all benchmarks, the multiple-scheduler setup outperforms the single scheduler because the schedulers manage to share the load of the workers efficiently, each low-level scheduler being directly responsible for a subset of the total workers. The Myrmics benchmarks code is written in a hierarchical way to support this optimization. The application decomposes the dataset into a number of regions. It then specifies a few high-level tasks that operate on whole regions (e.g., to perform one loop iteration, or do a reduction on whole regions). These tasks spawn children tasks that operate on some of the region objects. Myrmics assigns the few high-level tasks to the top-level schedulers and the many low-level tasks to the low-level schedulers. Thus, the application run is mostly contained in multiple local “domains”, each consisting of a low-level scheduler and its workers. Messages and DMA transfers are localized and the application can scale much better than with the single scheduler setup. As explained in the legend of figures 5.14 and 5.15, we maintain that each low-level scheduler is responsible for up to 16–18 workers, for up to 128 worker cores. Our experiments reveal that this is the scheduler-to-worker ratio that gives the best performance. This ratio is less than the 64 workers we computed with the microbenchmark in section 5.8.2, but it is reasonable for real-life benchmarks that have multiple arguments per task, with multiple dependencies. Since our hardware setup is limited to 8 total Cortex-A9 cores, the 256- and 512-worker cores configuration is sub-optimal, with each low-level scheduler handling up to 37 and 74 workers respectively. We believe the high scheduler-to-worker ratio to be the main reason that these data points show a degradation in scaling. The execution time for Myrmics benchmarks is usually longer than the respective MPI ones. The numbers vary greatly, depending mostly on whether the Myrmics version scales well on the selected core count that we measure. We find that a typical overhead for data points that scale well is in the range of 10%–30%. This overhead represents the time the runtime needs to perform all auto-parallelization work. There are cases where this overhead can be minimized, e.g., by over-decomposing a very parallel problem into many tasks; the runtime can complete its work in the background using the scheduler cores, while all workers are kept busy. However, there are also cases that this cannot be avoided, such as when reductions must be done across loop boundaries. Furthermore, our experiments analysis indicates that Myrmics automatic data placement algorithms work quite well. Myrmics overhead compared to MPI is attributed to the dependency analysis and scheduling, and is not caused by any excessive remote data transfers. Qualitative Analysis To understand how scheduler and worker cores in Myrmics perform further, we select three of the kernels and study their strong scaling executions in more depth. We choose the worstperforming kernel (Bitonic Sort), a medium case (K-Means) and the best-performing one (Raytracing). We first gather statistics about the breakdown of time inside the schedulers and workers. Results are shown in the left column of figure 5.16. In Bitonic Sort (figure 5.16a), this analysis reveals the reason it scales poorly. In high core counts, most workers (left
88
Chapter 5. The Myrmics Runtime System
100%
16M
80%
4M 1M
60%
256K
40%
64K
20% 0%
16K 4K 4 (1)
8 (1)
16 (1)
Idle
32 (3)
64 (5)
128 (8)
Kernel
256 (8)
4 (1)
512 (8)
App
8 (1)
16 (1)
Msg (W)
(a) Bitonic Sort time breakdown
32 (3)
64 (5)
128 (8)
DMA (W)
256 (8)
512 (8)
Msg (S)
(b) Bitonic Sort traffic analysis
100%
64M
80%
16M 4M
60%
1M
40%
256K 64K
20% 0%
16K 4K 4 (1)
8 (1)
16 (1)
Idle
32 (3)
64 (5)
128 (8)
Kernel
256 (8)
512 (8)
4 (1)
App
16 (1)
Msg (W)
(c) K-Means Clustering time breakdown
32 (3)
64 (5)
128 (8)
DMA (W)
256 (8)
512 (8)
Msg (S)
(d) K-Means Clustering traffic analysis
100%
1M
80%
256K 64K
60%
16K
40%
4K
20% 0%
8 (1)
1K 4 (1)
8 (1) Idle
16 (1)
32 (3)
64 (5)
Kernel
128 (8)
256 (8) App
(e) Raytracing time breakdown
512 (8)
4 (1)
8 (1)
Msg (W)
16 (1)
32 (3)
64 (5)
DMA (W)
128 (8)
256 (8)
512 (8)
Msg (S)
(f) Raytracing traffic analysis
Figure 5.16: Time breakdown [(a), (c), (e)] and traffic analysis [(b), (d), (f)]. In all figures, the X axis shows the number of worker cores and below the number of scheduler cores (in parentheses). For time breakdown measurements, the Y axis measures percentages, based on the total execution time. The left bar in a pair indicates where a worker core spent its time. The right bar indicates the same for a scheduler core. The bars are averaged per worker or scheduler core respectively. For traffic analysis measurements, the Y axis is logarithmic and measures core communication in bytes. The first bar in a triplet (read/medium) counts the worker message volume, the second bar (blue/dark) counts the worker DMA transfer volume and the third bar (green/light) counts the scheduler message volume. The bars are averaged per worker or scheduler core respectively.
bars) spend their time being idle (gray/light) instead of running application tasks (blue/dark), while the schedulers’ load (right bars, red/medium) increases. Depending on the phase of the bitonic sorting, the benchmark may spawn a large number of tasks and the schedulers are not fast enough to handle it. However, if we decrease the dataset decomposition to spawn fewer tasks, then there are other application phases where the number of tasks is too small and the performance is degraded due to lack of parallelism. A general observation from our
5.8. Evaluation
89
experiments is that a scheduler should be kept under 10% busy, in order to process requests fast enough to be considered responsive. In the 512-worker Bitonic Sort case, the average scheduler load is 33% and the system is significantly slowed down. Our analysis indicates that scheduler responsiveness is the main reason the system slows down. Overhead due to DMA transfers is negligible, which indicates that good data locality is achieved. K-Means Clustering (figure 5.16c) results show that the workers are kept busy executing tasks for higher core counts than in the Bitonic Sort case. This behavior is more typical, since this benchmark spawns an equal number of tasks per computation step. Up to 128 workers, workers are executing tasks for 88% of their time while schedulers are busy 2% of their time. In the 512-worker case, these numbers become 53% and 17% respectively and the performance begins to suffer. In Raytracing (figure 5.16e) we see an even more ideal situation. The total number of tasks is small compared to the other two benchmarks and the work is embarrassingly parallel. We observe that the scheduler load is at the worst case 6%, and indeed the benchmark scales well. The workers are busy between 79% of their time at best (4 workers) and 48% at worst (512 workers). The fact that the workers are not fully busy at low core counts is explained by the way the benchmark decomposes the dataset: it assigns chunks of work equal to the picture lines divided by the available workers. Thus, the working set for each core has the same amount of picture lines, which does not necessarily imply the same amount of work, as the latter depends on the complexity of the scene —some picture lines will be in the path of more scene objects than others. The right column of figure 5.16 shows our second set of qualitative measurements for the same benchmarks. The pathological case of the bad Bitonic Sort behavior for high core counts is also highlighted here. We observe that the average per-scheduler message-based communication (green/light bars) rises much more rapidly in Bitonic Sort than the other benchmarks, and reaches a very high peak at 512 workers (4 MB, instead of 256 KB and 64 KB). The increased communication is indicative of too many spawned tasks, which is also reflected in the average per-worker messages (red/medium bars). In Bitonic Sort the workerscheduler communication increases at higher core counts; in the other two benchmarks it slightly decreases. For strong scaling benchmarks with a variable task size, we expect a worker core to execute roughly the same number of tasks at higher core counts, each task dealing with a smaller part of the total dataset. The worker message traffic in Bitonic Sort indicates that workers execute more tasks as the benchmark scales. However, in all three cases we see that the DMA transfers communication per worker (blue/dark bars) decreases, which is an artifact of the tasks being smaller. Locality vs. Load-Balancing As we explained in section 5.5, when a task is dependency-free the schedulers cooperate to progressively schedule it down the hierarchy. Two scores are computed, one favoring subtrees of workers where the arguments that the task needs were last produced (a “locality” score L), and one favoring subtrees of workers that are idle or less busy than others (a “load-balance” score B). The total score is T = pL + (100 − p)B, where p is a policy bias percentage value. We run a series of experiments that sweeps p, to affect the relative weights of L and B. The results are shown in figure 5.17. We use the Matrix Multiplication kernel with flat scheduling and 32 workers (figure 5.17a), the Jacobi Iteration with hierarchical scheduling and 128 workers (figure 5.17b) and the K-Means Clustering with hierarchical scheduling and 512 workers (figure 5.17c). As we expected, these two scores are conflicting. The perfect locality is maintained when only a single worker is used (with a single scheduler), or a single worker sub-tree is used (hierarchical). This behavior minimizes the DMA transfers communication, but on the
90
Chapter 5. The Myrmics Runtime System
100% 80% 60%
100% 80%
Runtime Balance DMAs
60%
100% 80%
Runtime Balance DMAs
60%
40%
40%
40%
20%
20%
20%
0% Locality
Mixed
Load-Balance
(a) Matrix Multiplication (32 wrk)
0% Locality
Mixed
Load-Balance
(b) Jacobi Iteration (128 wrk)
Runtime Balance DMAs
0% Locality
Mixed
Load-Balance
(c) K-Means Clustering (512 wrk)
Figure 5.17: Effect of load-balancing vs. locality scheduling criteria. The X axis shows how much we favor the locality scheduling score (left X values, p=100) to the load-balancing score (right X values, p=0). The Y axis shows how this choice impacts the application running time, the system-wide load balance and the total DMA traffic. Y values are normalized to the maximum for this experiment and measured in percentages.
other hand causes the application running time to suffer, as only one or a few workers are busy. When we start taking into account the load-balancing score, we cause more communication but we also improve the application running time. If we only use the load-balancing score (far right point in the graphs), communication volume increases, as the schedulers do not optimize at all for locality. Although not very apparent in the graphs, a noticeable performance degradation exists in this case —e.g., in K-Means, the load-balance-only point is 10% worse in running time vs. the previous one. We find that a good trade-off between running time and communication volume lies in the range of assigning a 0.7–0.9 load-balance weight and a 0.3–0.1 locality weight respectively. Deeper Hierarchies Our final experiments try to explore how Myrmics behaves using more than two levels of schedulers. Unfortunately, we are limited to eight ARM Cortex-A9 cores. To answer our questions, we use only the 512-core MicroBlaze homogeneous system, where we can employ as many of its cores as we see fit to be schedulers. The MicroBlaze-only system has different intrinsic overheads. Looking back at figure 5.13a we see that the spawn delay moves up to 37.4 K cycles. To have a better understanding on how this will affect us, we first repeat the task granularity impact experiment using a single MicroBlaze scheduler, with the same parameters as we described in section 5.8.2. Figure 5.18a shows the results for the homogeneous system. We see that the achievable speedup is much lower for a single scheduler. We also observe that for low core counts, now the the optimal number of workers for a given task size is given by dividing the task size by 37.4 K: e.g. for the 512-K task size, the optimal number of workers is 16, close to the computed 14 (512 K / 37.4 K). However, for high core counts there seems to be a trend for the scheduler to saturate faster. For the 8-M task size, the optimal number of workers is 64, which is much less than the computed 224. In order to test for multiple scheduler levels, we saturate the schedulers with as much load as possible. We use a synthetic benchmark that uses a hierarchy of small regions. It spawns empty task that do nothing. Each task is normally executed in 22.5 K clock cycles, if the scheduler is under no load. Using the empty tasks, we manage to saturate the schedulers so that more than two levels of them are needed to satisfy the system load. Figure 5.18b shows the results of this experiment. First, we observe that for a single scheduler (red/cross line) the slowdown is excessive for high core counts, much more than what we get when the tasks have any significant size (such as the figure 5.18a behavior). Then, we switch to the 2-level scheduling (blue/circle line) and see that the hierarchy of schedulers performs significantly better. This behavior is consistent with the one we have
5.8. Evaluation
91 350
250
64 16 4 1 0.3 0.1
Slowdown
Speedup
300
2
8 32 Number of wo
128 rkers
8M s) 2M le 512K cyc 128K e ( 32K siz 8K sk 511 Ta
(a) Task granularity impact on a MicroBlaze scheduler
Perfect 1 Scheduler 2 Scheduler levels 3 Scheduler levels
200 150 100 50 0 4
8
16 32 64 128 Number of workers
256
512
(b) Multi-level benchmark weak scaling
Figure 5.18: Measurements for deeper hierarchies
seen by all the real benchmarks we have run on the heterogeneous platform and presented in section 5.8.2. For the 2-level scheduling experiments, we use a fanout of 6 for the schedulerto-worker ratio, i.e., each low-level scheduler is responsible for 6 workers. We explored multiple alternatives, and found that this ratio is a good trade-off that makes the low-level schedulers operate fast enough, without requiring too many schedulers to be present10 . As the 2-level setup scales, the top-level scheduler increasingly begins to saturate: when we reach the point of 438 worker cores, there are 73 leaf schedulers and 1 top-level scheduler. Having achieved this saturation point, we then advance the experiment using 3 levels of schedulers (purple/triangle line). This reduces the latency problems caused by the saturation of the top-level scheduler and provides roughly a 15% improvement on the slowdown. We again use a scheduler-to-scheduler ratio of 6 for the middle-to-leaf scheduler configuration. The improvement is not so dramatic as the one we see from a single scheduler to 2-level scheduling. Every additional level of scheduling comes with an increase in the Myrmics overhead, as it implies a more distributed region tree and inter-scheduler communication to traverse it. Although it is a contrived example, this experiment confirms that Myrmics can scale using more than three levels of schedulers. We have also validated the system for correctness running benchmarks with four and five levels of schedulers, which for the limited number of worker cores exhibit a performance slowdown compared to the 3-level setup.
10 The reader may recall that for the heterogeneous platform we found out that a good trade-off was a scheduler-to-worker ratio of 16.
Chapter 6
Related Work This chapter summarizes the related literature that we covered in chapter 2 and, in some areas, extends it. Section 6.1 focuses on the parallel programming models and their respective runtime systems. Section 6.2 focuses on hardware architecture prototyping and simulation.
6.1
Programming Models and Runtime Systems
Partitioned Global Address Spaces (PGAS). PGAS languages provide the a Partitioned Global Address Space, in which the user specifies how the application data are distributed. System-wide memory accesses (global) and thread-only accesses (local) are differentiated. The runtime system must mediate to execute global memory accesses. Unified Parallel C (UPC) [107] is a popular example. It extends C by providing two kinds of pointers: private pointers, which must point to objects local to a thread, and shared pointers, which point to objects that all threads can access but may have affinity to specific cores. The Berkeley UPC compiler [55], which is a reference implementation, translates UPC source code to plain C code with hooks to the UPC runtime system, which manages shared memory aspects. Other well-known PGAS languages are X10 [30, 50], which defines lightweight tasks (activities) that run on specific address spaces (places), Co-Array Fortran [84], which extends Fortran 95 to include remote objects accessible through communication, Titanium [52], which extends Java to support local and global references and Chapel [27], which is a language written from scratch that aims to increase high-end user productivity by supporting multiple levels of abstractions. PGAS languages rely on the user to write hazard-free programs, as the runtime system ensures neither the correctness nor the determinism of the program. Myrmics implements a global address space similar to the one offered by PGAS, and all tasks are dependent on the memory accesses that they make. The runtime system can use this information to enforce correctness and determinism, as well as exploit the data placement knowledge to optimize scheduling for locality.
Task-based models with independent tasks. The first task-parallel programming models that appeared assume that tasks spawned by the user can begin executing immediately. The runtime system takes care of scheduling these tasks, but does not automatically infer any dependence among them. Typical examples of such programming models include Cilk/Cilk++ [44], Intel Thread Building Blocks (TBB) [68] and the official OpenMP support for tasks [8]. These models target cache-coherent, shared memory architectures. As in the PGAS case, they also rely on the user to write hazard-free programs. 93
94
Chapter 6. Related Work
Static dependency analysis. Another approach to task parallelism is to rely on the compiler to perform static analysis, in order to discover which tasks can be safely run in parallel. Static analysis techniques can be quite complex, lead to imprecise results and may require significant compilation time, depending on the application. When successful, they can offer correctness guarantees to the user and they alleviate the runtime system from a lot of overhead, as it can disregard dependency checks from many spawned tasks. Dynamic Outof-Order Java [38] is a recent example of such a language, which performs many static optimizations and also uses heap examiners at runtime, to resolve cases that are ambiguous by the static analysis. Myrmics does not rely on static analysis techniques, but is still able to use compiler hints to exclude certain task arguments if the compiler marks them as SAFE —our modified SCOOP compiler [118] can provide such hints to Myrmics.
Dynamic dependency analysis. The newest class of task-parallel programming models enables the user to write serial code split into tasks, which are not necessarily allowed to run immediately when spawned. The user specifies constraints to inform the runtime system when a task should be allowed to run. The OmpSs family of programming models [7, 15, 23, 37, 91, 101] lets the user annotate a serial code with compiler pragmas that inform the runtime which variables will be touched by each task and how (read or written). A sourceto-source compiler translates the pragmas into runtime hooks, that call the runtime library to perform dynamic task dependency analysis. Myrmics follows a similar approach. In contrast to Myrmics, the OmpSs models support expressive formats for array portions, such as strides or dimension parts, but do not support pointer-based data structures. Another way to spawn dependent tasks is to use futures, which declare that a new task must wait for certain variables (Data-Driven Tasks [100] and X10), or other tasks (Habanero-Java [26]). Finally, OpenStream [93] offers another alternative to enhance the OpenMP tasking model to support data-flow parallelism, through the use of streams, which defines how the tasks produce and consume data.
Regions in task-based programming models. Myrmics support for regions resembles the Legion programming language [13], which was independently developed by Stanford while Myrmics was at the final stages of its implementation. In Legion, the user can specify logical collections of objects and their mapping onto the hardware. Myrmics has a different target than Legion, as it focuses on how dependent-task runtime systems can be structured to scale on emerging manycore architectures. The authors of Legion focus instead on the language structure and do not supply many runtime system details on how they distribute the system load, or how well their implementation scales —they provide measurements for at most 32 CPU cores. Legion is a generalization of the Sequoia [41] programming language, which introduces hierarchical memory concepts and tasks that can exploit them for portability and locality awareness. X10 [30, 50] also supports regions, but these refer to parts of multi-dimensional arrays and can be extracted by the compiler. Chapel [27, 28] introduces the domain concept to support multi-dimensional and hierarchical mapping of indexes to hardware locations. Another programming model that uses regions is Deterministic Parallel Java (DPJ) [20], which is a parallel extension of Java. DPJ combines compiler optimizations and dynamic runtime checks to guarantee determinism and to maximize available parallelism. Like Myrmics, DPJ supports hierarchical regions, but these are statically inferred at compile-time, while Myrmics regions are dynamic. The DeNovo project uses DPJ [31, 32] to propose that if languages like it were commonplace, simpler hardware and memory hierarchy architectures would be feasible.
6.1. Programming Models and Runtime Systems
95
Serial region-based memory management. Tofte and Talpin introduced managing memory in regions for serial programs in 1997 [104] as a programming discipline to facilitate mass deallocation of dead objects in languages, replacing the garbage collector. Memory is managed as a stack of regions and static compiler analysis determines when regions can be scrapped in their entirety, thus avoiding the expensive operations of freeing or garbagecollecting dead objects individually. Gay and Aiken implement RC [46], a compiler of an enhanced version of C for dynamic region-based memory management that supports regions and sub-regions. RC focuses on safety: reference counts are kept to warn about unsafe region deletions or to disable them. The authors claim up to 58% improvement over traditional garbage collection-based programs. Berger et al. [17] verify that region-based allocation offers significant performance benefits, but the inability to free individual pointers can lead to high memory consumption. Parallel region-based memory management. To our knowledge, our work is the first to introduce parallel region-based allocation. Titanium [52] uses “private” regions for efficient garbage collection, in the same way as serial region-based allocators do. There is some tentative support for “shared” regions, which are implemented inefficiently with global, barrierlike synchronization of all cores. Gay’s thesis [47] provides some details on the Titanium shared regions and briefly mentions a sketch of a truly parallel implementation as future work. Parallel regions in Myrmics must not be confused with the X10 language regions [30], which are defined as array subsets and not as arbitrary collection of objects. Legion [13] offers parallel allocation of logical regions; their work was developed independently to ours. Shared memory parallel memory allocators. For thread-based, shared-memory architectures, Hoard [16] is considered one of the best parallel memory allocators. Hoard implements a small number of per-processor local heaps, which are backed by a global heap when they run out of memory, which is backed in turn by the operating system virtual memory system. While Hoard focuses on increased throughput, Michael [81] improves on multi-threaded, lock-based allocators by presenting a scalable lock-free allocator that guarantees progress even when threads are delayed, killed or deprioritized by the scheduler. MAMA! [60] is a recent high-end parallel allocator that introduces client-thread cooperation to aggregate requests on their way to the allocator. McRT-malloc [54] follows a different approach, by implementing a software transactional memory layer to support concurrent requests; threads maintain a small local array of bins for specific, small-sized slots and they revert to accessing a public free list to get more blocks; larger slot sizes than 8 KB are directly referred to the Linux kernel. The Myrmics memory allocator resembles, in many respects, parallel memory allocators that use heap replication. Our schedulers trade address ranges hierarchically and serve requests from these ranges. In the MAMA! paper, the authors describe a three-way trade-off for memory allocators: they can only feature two of the benefits of space efficiency, low latency or high throughput. The Myrmics memory system sacrifices space efficiency (memory is hoarded by multiple schedulers and preallocated for region usage) but offers high throughput, low latency and also compactness for memory objects inside regions. Flash log-structured filesystems. Both the JFFS [113] and the YAFFS [2] filesystems are included in the Linux kernel and marked as stable. Gal and Toledo have surveyed many flash-specific algorithms, data structures, academic/free filesystems as well as related patents [45]. JFFS stores all data and metadata for files and directories in the log using variable-length records, but does not include any information about the mapping from
96
Chapter 6. Related Work
inode numbers to physical block numbers, nor anything about the free list usage. The system mounts by scanning all nodes and building these structures in memory. In the Myrmics filesystem, we include inode map and free bitmap information into both the checkpoints and the block metadata themselves in order to speed up mounting and recovery. YAFFS uses a selection of fixed size chunks, storing some header and valid bits onto the special error correction pages in the raw Flash devices. No structure is written on disk concerning inode maps and free lists, resulting in the same increased mount times. YAFFS saves on the large memory footprint of the variable-length JFFS records by employing many optimizations, including approximate pointers and wide trees. It also implements a better erasing algorithm in two phases. Both JFFS and YAFFS use background cleaning processes to compact data out of valid blocks and to slowly reclaim space by erasing whole Flash erase blocks (considered to be in the hundreds of kilobytes). We do not do this in the Myrmics filesystem, in order not to affect the scheduler responsiveness.
6.2 Hardware Simulators and Prototyping Platforms FPGA prototyping boards. Two very well-known academic efforts are the Berkeley Emulation Engine boards, BEE2 [29] and BEE3 [34]. A more recent commercial version is the BEE4 [14] which uses Virtex-6 FPGAs. FAST [33] was developed in Stanford and combines real CPUs (MIPS R3000/3010) with FPGAs for custom logic, along with SRAMonly memory chips. Xilinx offers single-FPGA boards, such as the XUPV5 platform [117]. Other companies such as the DINI group [103], offer a wide selection of FPGA development boards. To the best of our knowledge, none combines SRAM, DRAM and enough GTP links at a low price. Hardware prototypes. RAMP Blue [67] is a MicroBlaze-based architecture developed by Berkeley for the BEE2 boards, that uses reduced network datapaths. Each FPGA has twelve cores with direct-mapped L1 caches, a single shared FPU, support for partitioned DRAM access and an apparently 16-port crossbar. There are neither L2 caches, nor DMA engines for the network. The FPGA is 24% smaller than the one that we use in Formic, with older generation 4-input LUTs. The authors implementing the network and crossbar using 8-bit datapaths to economize on hardware resources. The FORTH-ICS SARC [63, 64] prototype fits four 5-stage MicroBlaze cores with L1 and L2 caches and integrated network interfaces into the FPGA of the XUPV5 board. It uses a 6-port crossbar with 32-bit datapaths. The Microsoft Beehive [102] is a prototype for the BEE3 platform that features custom, minimalistic 32-bit RISC cores, each of them with only a direct-mapped L1 cache and a token ring-based internal network. Atlas [110] from Stanford uses the BEE2 board to provide hardware transactional memory support for the eight PowerPC cores on the FPGAs. The Scalable Multiprocessor [89] project from University of Toronto, also for the BEE2 board, provides CAD support to create custom computing machines from data-flow descriptions in Matlab. Aegis [97] from Cornell University is a prototype of a processor architecture with security extensions for tamper-proof software execution. These prototypes either use too simple processors and/or cache hierarchies, or are too specialized to support generalpurpose manycore software development. Software simulators. The Simics [76] full-system simulator allows users to study how applications and operating systems run on a hardware architecture. Parts of the architecture can be tuned by plugins that alter the performance of system portions. GEMS [78] provides a parametric coherent memory hierarchy performance model, where users can alter or cre-
6.2. Hardware Simulators and Prototyping Platforms
97
ate their own coherency protocols from scratch. Simics and GEMS are often used together to simulate a system. The gem5 [18] simulator augments the GEMS memory model with full-system simulation capabilities and provides a stand-alone solution. There are other, specialized simulators that focus on parts of the system, such as Orion [62] for the network-onchip and DRAMsim [108] for the external DRAMs, which are either used alone for design space exploration, or in conjunction with full-system simulators to improve their accuracy for specific parts. Full-system simulators run on a single host processor and are too slow to simulate architectures with high core counts. Parallelizing simulators is considered very difficult; there are several attempts in the literature, such as Graphite [82] and TaskSim [95], at the cost of sacrificing simulation accuracy and/or abstracting the nature of the simulation. Another direction is to use hardware-assisted or hybrid hardware-software simulation. Tan et al. have written an extensive taxonomy of such systems [99].
Chapter 7
Conclusions In this chapter we conclude this dissertation. Section 7.1 views our work from a critical standpoint and revisits the contributions that we make. Section 7.2 presents ideas for extending our thesis with future work. In section 7.3 we discuss some key insights for runtime systems scalability, based on the experience we gained during our work. Section 7.4 concludes our thesis with a few final remarks.
7.1
Critical Assessment
After presenting our thesis in detail, we revisit here the contributions listed in the end of chapter 1 (page 5). We take a critical approach and examine the validity of each contribution, discussing the strengths and weaknesses of our methods. A1: Parallel regions. The concept of memory regions in sequential programming is old and well-studied [46, 104]. We presented the formal semantics in 2011 [94] and the Myrmics memory allocator with parallel region support in June 2012 [75]. Independently with our work, Stanford researchers introduced the Legion programming language in November 2012 [13], which also extends the region concept to parallel programming. Although Legion regions are “logical” (i.e., a language concept that does not necessarily imply that the underlying memory management system actually has to pack objects in the same region close together) and an object can belong to many logical regions at the same time, we consider that their work also makes a similar contribution. To the best of our knowledge, and taking into account the aforementioned publication dates, our work is the first to extend the region concept to task-based parallel programming1 . From our own experience of programming several Myrmics benchmarks, regions are intuitive and easy to use. For pointer-based data structures, regions proved extremely helpful to write code and to group task arguments efficiently. For strictly array-based codes, using regions to refer to parts of the array proved to be probably less productive for the programmer than being able to refer to parts of the array with sub-indexing (as in the OmpSs family [37]), but allows for a more efficient runtime implementation. A2: Hierarchical memory management, dependency analysis and task scheduling. Looking back at figures 5.14–5.15 (pages 84–85), our experiments confirmed that an 8scheduler, 2-level hierarchical Myrmics configuration performs 2–8× better than a singlescheduler one. This performance improvement is the direct outcome of the hierarchically 1 We do not consider the earlier-published (2009) Deterministic Parallel Java [20] regions as competitors, as their regions are statically inferred by the compiler.
99
100
Chapter 7. Conclusions
distributed algorithms that we use for memory management, dependency analysis and task scheduling. Although implementation details are rarely published, to the best of our knowledge, existing runtime systems internally use centralized, lock-based data structures supported by cache-coherent memory systems, or exhibit other single points of runtime work concentration (e.g. a single CPU runs the runtime, or a single master thread/task is allowed to spawn tasks). We believe that these systems scaling behavior for high core counts will resemble the single-scheduler Myrmics configuration. Authors evaluate their work on at most 64 CPUs, where single-point scalability issues may or may not start to appear (also see the first point about task granularity that we make in section 7.3 below). Our experiments prove that our proposals for hierarchical algorithms are valid and can reclaim the lost scalability of the single-point implementations for hundreds of cores. Using hierarchical algorithms is one way to go, but we do not claim that this is the only way to go; other distributed implementations may perform equally or better. We chose the hierarchical configuration as a natural fit for emerging architectures (e.g. Runnemede [25]) and to enhance locality by isolating parts of the problem into parts of the chip, but this choice does come with some programmability drawbacks (fourth point in section 7.3). A3: Myrmics target and design. Our literature review suggests that the design and implementation of existing runtime systems is overshadowed by the programming language features and novelties. Authors rarely reveal runtime implementation details, and instead turn the spotlight on the programming models. We can think of two possible reasons for this focus: (i) runtime implementations have novel features, but do not succeed in being published, or (ii) authors focus more on increasing programmer productivity through language design, and then provide a proof-of-concept runtime system that supports these features. We are inclined to assume the second reason. Myrmics is not “yet another runtime system”, in the sense that our work focuses on the runtime implementation scalability challenges of emerging manycore architectures. We made it our top priority to acquire a working model of a manycore processor according to current trends (see contribution B2 below), in order to specifically study the unique scalability problems that a runtime is predicted to face on heterogeneous, non-coherent manycores. We address these problems by designing Myrmics to specialize for the heterogeneous nature of the processor and to implement scalable, hierarchical algorithms for memory management, dependency analysis and task scheduling. We note here that scaling a runtime system in a single-chip processor is an entirely different problem than doing so in an MPI cluster: communication latencies are two orders of magnitude faster inside a single-chip processor than in an Infiniband-backed cluster ([71, 79] and sections 4.5.4 on page 50 and 5.2 on page 56). Some runtime systems [13, 23] are based on GASNet [21] and are therefore portable to clusters. In addition to cluster measurements being again limited to 32–64 nodes, the authors do not define the task granularity that they use (also see the first point in section 7.3). We guess that runtime systems on clusters use very coarse-grained tasks to hide the communication latencies, which also allows for computationally-expensive runtime algorithms that do not appear to become bottlenecks. However, porting such implementations to single-chip manycores would lead to very poor results. A4: Myrmics evaluation and analysis. We believe that the evaluation of the Myrmics runtime system (section 5.8.2 on page 82) is thorough and covers our primary target to explore the runtime scalability problems and propose solutions for them. We use many benchmarks, representative of different communication patterns, and we also reveal internal runtime overheads using microbenchmarks. We contrast our results to hand-optimized MPI
7.1. Critical Assessment
101
versions of the same benchmarks, built upon a solid and fast MPI library (see contribution B3 below). We consider two weaknesses in our approach. First, although the bare-metal nature of Myrmics helps us to remove any possible operating system “interference” to performance measurements, the lack of an underlying operating system (OS) and common userspace libraries makes it hard to (i) port heavier, more realistic applications which rely on them and (ii) compare Myrmics to another, baseline runtime system. In retrospect, we still stand by the bare-metal choice and its limitations. Porting an OS to a non-coherent manycore architecture correctly is not straightforward. The relatively simple approach would be to port an OS (e.g., Linux) to our custom hardware using multiple images where each CPU core runs its own OS. On-chip communication would pass through a kernel driver, which would emulate a network card. This porting would be feasible from an implementation standpoint, but too inefficient. The correct approach would be to port the OS using a single image for all hardware cores. This approach would imply removing the underlying assumption of an OS that all memory is shared (and coherent) and accessible through load-store processor instructions. This task would be immense, and it would lie out of our scope to explore the task-based runtime systems scalability. A second weakness is the limited internal visibility. Although Myrmics collects enough tracing and debug information (section 5.6 on page 68), which we used to analyze the qualitative aspects of the runtime performance, using a software simulator would have given us a much more clear view of various performance aspects during the debugging and the evaluation phases. In parallel to our work, Papaefstathiou et al. [88] explored hardware architecture enhancements for a task-based, dependency-aware programming model using the gem5 [18] software simulator. Using the simulator, on the one hand, their measurements were much more revealing for many interesting aspects, like cache behavior, power and memory traffic breakdowns. On the other hand, the authors were forced to limit their results to 64 cores while the simulations still took days to complete. Again, we stand by our choice to use FPGA prototyping instead of software simulation, as it enabled scaling to hundreds of cores. B1: Formic board. Back in 2010, we decided to undertake the considerable effort to design and to validate a new FPGA prototyping board, after extensive search for purchasing a ready one [14, 29, 34, 103, 117]. We created Formic to address all three reasons (SRAM memory, off-board links and cost) that made existing boards unsuitable for our purposes. The implementation of the 520-core prototype validated our design choices for the Formic board in full. Having the benefit of hindsight, there is one detail that we could implement differently. Formic has three SRAM and one DRAM memory. Our hardware architecture only uses two of the SRAMs to store the data of the eight L2 caches, so one SRAM chip remains unused for the current prototype. If Formic had two SRAM and two DRAM memories instead, we would have doubled the DRAM memory per board, which would have allowed for more memory-intensive benchmarks to run. However, doing so would increase the PCB complexity (DRAM routing is significantly more complicated than SRAM one) and would thus possibly increase the board size, cost and failure risk factor. B2: FPGA prototype. We created the basic Formic-based hardware architecture of an octo-core MicroBlaze building block, by studying state-of-the-art (of the 2010 era) multicore chips [53, 61]. We analyzed the published network-on-chip and micro-architectural details, and tuned our architecture accordingly to model similar latencies. We consider that the final FPGA prototype is as faithful as a model can be, based on trends and predictions on a
102
Chapter 7. Conclusions
ten-year horizon. The FPGA prototype is the key enabling factor for the Myrmics runtime system, as it allows us to run software 50,000× faster than software simulation (4 orders of magnitude), which fully justifies our choice for prototyping vs. simulation. The relation of ARM Cortex-A9 to Xilinx MicroBlaze cores proved to be a weakness of our approach. We were limited to exactly two ARM Versatile Express platforms, and thus had a total of 8 Cortex cores at our disposal. As all but two manufactured Formic boards proved to be fully functional, we ended up with 512 MicroBlaze cores. The heterogeneous platform has a 64:1 Cortex to MicroBlaze ratio. Our Myrmics evaluation showed that a more suitable ratio would be 16:1. The very recent Intel Runnemede [25] proposes an 8:1 ratio. Although the numbers will vary depending on relative core capabilities, the 64:1 ratio is definitely too big. We believe that Myrmics would scale much better for the 256- and 512-worker core count, if more Cortex cores were available and the ratio was smaller. B3: MPI library. We designed the MPI library to be as fast as possible, taking full advantage of the underlying hardware capabilities (fast polling through Mailboxes and offloaded data transfers using the DMA engines). We achieve similar results to the Intel SCC RCCE messaging library (see the footnote in section 4.5.4 on page 50). We take care that all collective operations are based on scalable, tree-like algorithms. MPI benchmarks scale very well, which further strengthens our argument that the MPI library is fast and can be used as a credible baseline against which to compare Myrmics. A drawback of the library, which does not affect the Myrmics measurements, is that the library does not implement the full functionality of the MPI standard [96].
7.2 Further Work We have identified several aspects of our work that can be improved. We list them here, along with other ideas for further extensions, that came up during the hardware and software implementation. Implement wait. The enhanced programming model defines a wait pragma. A task that has delegated an object or region to a spawned child task can use wait to regain control. Currently this pragma is not supported in Myrmics. In the cases that we need such behavior, we spawn a new task with the delegated object/region to work with it. Spawning a new task incurs more overhead in the common case compared to having an existing task wait on some of its arguments. However, supporting the wait pragma in Myrmics is quite complicated, which is the main reason that it was of lower priority compared to runtime features and academic targets. The programming model defines that the waiting task must be preempted2 . The architecture-specific Myrmics layer needs to support saving the task function state in predefined breakpoints (saving registers not on the stack, but at a given data hook point; the used stack space must be copied there as well). The dependency analysis algorithms must be enhanced to support re-enqueueing of the task to the new targets. The task completion algorithms must be enhanced to support waking up the task (when other finished tasks unblock the waiting one) and dequeueing the task from more points than its original arguments (when the waiting task ultimately finishes). Implement NOTRANSFER. One optimization of the programming model for non-coherent architectures is to use the NOTRANSFER flag. It specifies that although the task dependency is 2 The task must really be preempted, as other tasks may be behind it in the worker ready queues. Simply blocking the worker on the task that waits is not an option, as it would create deadlocks.
7.2. Further Work
103
honored normally, the corresponding DMA must not happen. The optimization seems trivial to implement, but the packed bitmaps that accompany the task arguments from scheduler to scheduler to ultimate worker are currently full with region and in/out information, and there is no obvious place to stuff one more bit per task argument that will persist through all involved messages from task dispatch to scheduling to ultimate worker core. Library or language for hierarchical allocation. The hierarchical decomposition of user applications proved to be easy to grasp as a concept, but not so easy to write the application code (also see the fourth point in section 7.3). The most challenging part was to allocate the hierarchical data structures, in cases that they were not homogeneous. For example, it is easy to allocate a hierarchically decomposed array, but quite more difficult to allocate a hierarchically decomposed stencil application. One way to facilitate the application code is to provide a library of allocation functions for a number of often needed data structures. The user can call a library function specifying the decomposition parameters and depth, and the function can return the data structures, ready to be used. A second way would be for this difficulty to become the motivation for creating a high-level parallel language, which would incorporate both the allocation of non-trivial, hierarchically decomposed data structures, as well as the compiler pragmas for accessing their parts, into language constructs. Virtual addresses. The hardware architecture supports virtual addresses with 1-MB pages through the TLB block. However, we have not used this functionality in Myrmics. To harvest the full memory in the FPGA prototype, a virtual memory layer could be added that made all Formic board DRAMs act as an aggregated pool of memory. This layer would enable Myrmics to run applications with much larger datasets than it currently handles. Region migration. A region in Myrmics is created by a scheduler core, which remains responsible for it for the rest of its life. Although this key choice greatly simplifies the runtime system, it could be interesting to explore region migration scenarios, both implicit and explicit. For the latter, the API could be extended with a sys_rrealloc() call, that would allow the application to re-parent a region from its current parent to a new one. The programming model should define that the task executing the new call should have write access to both parent regions. For the former, Myrmics schedulers under load imbalance could decide to reassign region responsibility automatically. Any of the migration scenarios would involve major changes to the memory management system; careful attention should be given not to introduce races. Workers for mid- and top-level schedulers. Worker cores in Myrmics are the leaves of the core tree hierarchy. The (few) tasks handled by mid- and top-level schedulers pass through lower-level schedulers for dispatching and completion (also see the third point in section 7.3). It would be very interesting to explore a different core hierarchy organization, in which mid- and top-level schedulers would have some dedicated worker cores. Tasks handled by these schedulers would be dispatched locally to these worker pools. The different organization could lead to reduced per-task overhead for such tasks, but would also probably mean reduced feasible speedups for well-behaved applications, as the leaf worker pools would be reduced. A suitable trade-off exploration is necessary. A secondary idea is to try to match application patterns to core hierarchies: some applications would benefit from the current Myrmics setup, others (e.g. with heavy reduction/fork-join parallelism) might benefit from dedicated workers in middle and top levels.
104
Chapter 7. Conclusions
Integrate filesystem. Currently, the Myrmics filesystem is not visible to application code. It is limited for use by the Myrmics kernel, as its original purpose was to store multiple applications, results, traces, etc. Eventually, it was used for none of these, as higher-priority functionality had to be implemented. In addition to implementing the aforementioned points, one interesting approach would be to expose the filesystem to application tasks. An application could open a file handle and this handle could be similar to a task argument dependency: task I/O would be serializable in this manner through a path much like an object dependency. Complete the MPI library. The MPI library implements the basic send/receive calls (blocking and non-blocking versions), as well as a small set of collective operations (barrier, broadcast, reduce, allreduce, alltoall). To run more complicated MPI applications, the full set of MPI calls could be added. Off-cube board DRAM. To support larger datasets, non-Formic boards (e.g. XUPV5 from Xilinx) with expandable DRAM DIMM slots can be connected to the Formic cube. The hardware architecture would need to be changed to support these locations as the “real DRAMs” and either disregard or treat the Formic board DRAMs as L3 caches. The topology of the new boards is open to multiple ideas. Following the rationale we used for the current 3D-mesh architecture and Formic DRAMs, advances in embedded DRAM (eDRAM) and Through-Silicon Vias (TSVs) suggest that local DRAM resources will be close to each CPU core; thus, the new boards can be connected on the eighth, currently unused, SATA connector on some of the Formic boards. If we project the current practice of 2D-mesh architectures, DRAM resources are found at the periphery of the mesh; thus, the new boards can be connected on existing X/Y/Z connectors, extending the 3D mesh dimensions. Hard or Solid-State Disk on Formic. The eighth, currently unused, SATA connector of the Formic boards could be used to connect hard disk(s) or solid-state disk(s). Small hardware IP blocks for SATA communication are available (e.g. the recently presented Groundhog [114]) and the Formic oscillators that provide clocks to the GTP physical layers are compatible with SATA-2 speeds.
7.3 Discussion Throughout the design, development and evaluation of the Myrmics runtime system, we delved into various scalability problems. Before we conclude the dissertation, we discuss some key issues and share our acquired insight on them. First, we have observed that the dominating factor that affects the performance of any task-parallel runtime system is the duration of the spawned tasks, i.e., the task granularity. When handling bigger tasks, the runtime system has more time (per task) to work and thus the perceived (per task) overhead is reduced. Picking the “correct” task size depends on many factors, such as how much data a task touches and how these data fit into the cache hierarchy. Smaller tasks sizes strain the runtime system, but on the other hand expose more parallelism and exhibit better cache hit ratios. Authors do not usually provide details about how fine or coarse a task granularity they choose for their evaluations. As future runtime systems need to scale to hundreds of cores, if the scaling is done simply by increasing the task size to minimize the runtime overhead, it will hurt parallelism. To make the most out of the emerging manycore architectures, we need to think ahead and propose scalable solutions for scheduling and dependency analysis algorithms.
7.3. Discussion
105
A second point concerns the number of ready (dependency-free) tasks. Assuming a sufficiently low runtime overhead and an appropriate problem size, is there a benefit in over-decomposing a problem to very small tasks? For a given per-task overhead, more (and smaller) tasks will incur a bigger total overhead. On the other hand, when the workers queues are kept non-empty, the runtime can prepare the next task by transferring its data during the execution of the current task (as in Myrmics) or by enabling a hardware-assisted prefetcher to touch the needed cache lines and bring them closer (in cache-coherent systems). We propose that a good trade-off must be found by decomposing the application so that there is a number of ready tasks in flight which is dependent on the number of worker cores in the system. In the Myrmics evaluation, we have picked the number of ready tasks to be around two times the number of active worker cores. This ratio seems sufficient to keep workers non-empty, and allow the runtime to optimize for the next task execution, while keeping the total runtime overhead low. Third, a point regarding core specialization and hierarchical scaling. As we argued in section 5.1, we think that in the future manycore chips CPU cores must diversify their functionality. Our experience with the two roles in Myrmics (scheduler and worker) is very positive, because it allows uninterrupted execution of worker tasks and fast processing of scheduler events. Although we do not have an alternative implementation to measure against, we believe that core specialization leads to improved cache hit ratios and avoids context switching overhead, for systems where the runtime code must be protected by escalated hardware privileges. Organizing the cores in a strict hierarchy has proven to be advantageous, but also cumbersome. Again without having hard evidence against an alternative implementation, our insight is that the hierarchical organization successfully manages to “concentrate” application parts around the low-level schedulers. The communication and data movement remain localized for much of the application running time and thus decrease network traffic and increase the application and power efficiency. However, restricting the communication only across parent-children cores tends to be problematic in handling a few cases, e.g., creating new regions on the boundary between schedulers or top-level schedulers managing (the few) tasks by forwarding messages through other schedulers towards workers. Our measurements reveal that increasing the levels of the hierarchy seems promising to scale the runtime system to many hundreds of cores, but this comes with an added overhead per scheduler level. Tuning the runtime system to a “correct” balance of (levels of) schedulers and workers is again a trade-off. More schedulers balance the runtime load and enable faster event processing, but also increase the average per-task overhead, especially for non-leaf tasks that are handled by upper levels of schedulers that need to run reduction-like code. One avenue that we did not explore —that would alleviate this problem and also map even more naturally to hierarchical architectures like Runnemede in which every big core is close to a number of small cores— is to provide mid- and top-level schedulers with dedicated worker cores, which would run tasks managed by these schedulers (we presented this idea in the previous section regarding further work). Our fourth and final point is about the hierarchical programming approach. Our key hypothesis that hierarchical decomposition of the problem is beneficial (as we discussed in the third point above) seems to be supported. However, providing to the programmer a practical and intuitive programming model to allow such a decomposition is difficult. Programming Myrmics benchmarks revealed that regions are extremely helpful to that end (especially for pointer-based data structures), but still the hierarchical programming experience was difficult for non-trivial cases. We discussed in the previous section that a good candidate for further work in this area could be a user library that takes care of the object/region allocation, which seems to be the most difficult part. A language specifically targeting hierarchical decomposition would go even further to improve not only the allocation, but also provide
106
Chapter 7. Conclusions
ways to refer to parts of data structures in a more intuitive way. We feel that hierarchical decomposition is the correct end goal to target, but more work and innovative ideas are needed to reach it.
7.4 Concluding Remarks In this thesis we delve into the challenges that lie ahead for parallel programing on emerging processors with hundreds of CPU cores. Current trends suggest that future processors will be more heterogeneous and less cache-coherent than the ones available today. The problem of programming on such architectures productively by non-expert software developers becomes crucial. One path towards this goal is to use task-based programming models, which are intuitive and productive. The runtime systems that accompany task-based programming models are not ready to scale to such architectures. They are developed to map well to existing cache-coherent multicore chips and are evaluated up to a few tens of cores. Implementation details are rarely published. To the best of our knowledge, they do not employ scalable algorithms for memory management, dependency analysis and task scheduling. Furthermore, they do not project well either to heterogeneous single-chip processors or to partially (or fully) non-coherent memory systems. We first solve the basic problem of a viable evaluation platform: heterogeneous, noncoherent, manycore, single-chip processors are not available for researchers to experiment with new runtime systems. We propose that FPGA prototyping is the correct approach. We create a heterogeneous 520-core FPGA prototype that models a single-chip processor after the current hardware architecture predictions for ten years into the future. Although hardware prototyping is harder than software simulation, the effort is well worth the added insight, the modeling accuracy and the execution speed. We estimate that our FPGA prototype runs code 50,000× faster than software simulators. We then study the fundamental problems of making a programming model and its runtime system scale to hundreds of cores. We explore several mechanisms and policies towards this goal, such as specializing CPU roles, hierarchical organization and limiting task argument expressiveness. We propose scalable algorithms for memory management, dependency analysis and task scheduling. We create the Myrmics runtime system and evaluate it on our 520-core FPGA prototype. Our experiments suggest that our main hypotheses are supported and that many of these ideas are promising. Hierarchical scheduling avoids the single-master bottleneck and allows Myrmics to scale as well as the MPI baseline to hundreds of cores. Automatic parallelization of the serial code in Myrmics imposes a modest overhead of 10–30% compared to the hand-optimized MPI code. Current hardware architecture trends hint that programming models and their runtime systems must evolve fast to catch up with the increasing number of cores. Radical changes will be needed if the new processors become more heterogeneous and/or less cache-coherent than today’s norm. Our work explores interesting problems on researching and enhancing runtime system scalability; we hope it will stimulate further research in this area.
Bibliography [1] Aeroflex Gaisler. The Leon3 Processor, 2012. http://www.gaisler.com/doc/leon3_ product_sheet.pdf. [2] Aleph One. YAFFS: Yet Another Flash Filing System, 2002. http://www.yaffs.net. [3] C. Arens. The Bowyer-Watson Algorithm; An efficient Implementation in a Database Environment. Technical report, Delft University of Technology, January 2002. [4] ARM Ltd. Cortex-A9 Processor, 2012. http://www.arm.com/products/processors/ cortex-a/cortex-a9.php. [5] ARM Ltd. The Versatile Express Product Family, 2012. products/tools/development-boards/versatile-express.
http://www.arm.com/
[6] K. Asanovic, R. Bodik, J. Demmel, T. Keaveny, K. Keutzer, J. Kubiatowicz, N. Morgan, D. Patterson, K. Sen, J. Wawrzynek, et al. A View of the Parallel Computing Landscape. Communications of the ACM, 52(10):56–67, 2009. [7] C. Augonnet, S. Thibault, R. Namyst, and P. A. Wacrenier. StarPU: A Unified Platform for Task Scheduling on Heterogeneous Multicore Architectures. Concurrency and Computation: Practice and Experience, 23(2):187–198, 2011. [8] E. Ayguadé, N. Copty, A. Duran, J. Hoeflinger, Y. Lin, F. Massaioli, X. Teruel, P. Unnikrishnan, and G. Zhang. The Design of OpenMP Tasks. IEEE Transactions on Parallel and Distributed Systems, 20(3):404–418, 2009. [9] D. H. Bailey, E. Barszcz, J. T. Barton, R. L. Carter, T. A. Lasinski, D. S. Browning, L. Dagum, R. A. Fatoohi, P. O. Frederickson, and R. S. Schreiber. The NAS Parallel Benchmarks. International Journal of High Performance Computing Applications, 5 (3):63–73, 1991. [10] J. Balart, A. Duran, M. Gonzàlez, X. Martorell, E. Ayguadé, and J. Labarta. Nanos Mercurium: A Research Compiler for OpenMP. In Proceedings of the 2004 European Workshop on OpenMP, volume 8, 2004. [11] Barcelona Supercomputing Center. Nanos++ Overview, 2013. http://pm.bsc.es/ nanox. [12] Barcelona Supercomputing Center. Paraver: A Flexible Performance Analysis Tool, 2013. http://www.bsc.es/computer-sciences/performance-tools/paraver. [13] M. Bauer, S. Treichler, E. Slaughter, and A. Aiken. Legion: Expressing Locality and Independence with Logical Regions. In Proceedings of the 2012 International Conference for High Performance Computing, Networking, Storage and Analysis (SC ’12), page 66, 2012. 107
108
Bibliography
[14] BEE4. The BEE4 Hardware Platform, 2012. http://www.beecube.com/products/ BEE4.asp. [15] P. Bellens, J. M. Perez, R. M. Badia, and J. Labarta. CellSs: A Programming Model for the Cell BE Architecture. In Proceedings of the 2006 International Conference for High Performance Computing, Networking, Storage and Analysis (SC ’06), pages 5–5, 2006. [16] E. D. Berger, K. S. McKinley, R. D. Blumofe, and P. R. Wilson. Hoard: A Scalable Memory Allocator for Multithreaded Applications. SIGPLAN Notices, 35:117–128, November 2000. [17] E. D. Berger, B. G. Zorn, and K. S. McKinley. Reconsidering Custom Memory Allocation. In Proceedings of the 2002 Conference on Object-Oriented Programming Systems, Languages and Applications (OOPSLA ’02), pages 1–12, 2002. [18] N. L. Binkert, B. M. Beckmann, G. Black, S. K. Reinhardt, A. G. Saidi, A. Basu, J. Hestness, D. Hower, T. Krishna, S. Sardashti, R. Sen, K. Sewell, M. Shoaib, N. Vaish, M. D. Hill, and D. A. Wood. The gem5 Simulator. SIGARCH Computer Architecture News, 39(2):1–7, 2011. [19] R. Blumofe, C. Joerg, B. Kuszmaul, C. Leiserson, K. Randall, and Y. Zhou. Cilk: An Efficient Multithreaded Runtime System. In Proceedings of the 1995 Symposium on Principles and Practice of Parallel Programming (PPoPP ’95), pages 207–216, 1995. [20] R. Bocchino, Jr., V. Adve, D. Dig, S. Adve, S. Heumann, R. Komuravelli, J. Overbey, P. Simmons, H. Sung, and M. Vakilian. A Type and Effect System for Deterministic Parallel Java. SIGPLAN Notices, 44(10):97–116, 2009. [21] D. Bonachea. GASNet Specification, v1.1. Technical Report CSD-02-1207, EECS Berkeley, October 2002. [22] J. Bonwick. The Slab Allocator: An Object-Caching Kernel Memory Allocator. In Proceedings of the 1994 USENIX Summer Technical Conference (USTC ’94), pages 87–98, 1994. [23] J. Bueno, L. Martinell, A. Duran, M. Farreras, X. Martorell, R. M. Badia, E. Ayguade, and J. Labarta. Productive Cluster Programming with OmpSs. In Proceedings of the 2011 European Conference on Parallel and Distributed Computing (Euro-Par ’11), pages 555–566, 2011. [24] Cadence Design Systems, Inc. Incisive Enterprise Simulator, 2012. http://www. cadence.com/products/fv/enterprise_simulator/pages/default.aspx. [25] N. P. Carter, A. Agrawal, S. Borkar, R. Cledat, H. David, D. Dunning, J. Fryman, I. Ganev, R. A. Golliver, R. Knauerhase, R. Lethin, B. Meister, A. K. Mishra, W. R. Pinfold, J. Teller, J. Torrellas, N. Vasilache, G. Venkatesh, and J. Xu. Runnemede: An Architecture for Ubiquitous High-Performance Computing. In Proceedings of the 2013 Symposium on High-Performance Computer Architecture (HPCA ’13), 2013. [26] V. Cavé, J. Zhao, J. Shirako, and V. Sarkar. Habanero-Java: The New Adventures of Old X10. In Proceedings of the 2011 Symposium on Principles and Practice of Programming in Java (PPPJ ’11), pages 51–61, 2011.
109 [27] B. L. Chamberlain, D. Callahan, and H. P. Zima. Parallel Programmability and the Chapel Language. IJHPCA, 21(3):291–312, 2007. [28] B. L. Chamberlain, S.-E. Choi, S. J. Deitz, D. Iten, and V. Litvinov. Authoring Userdefined Domain Maps in Chapel. In Proceedings of the 2011 Conference on Cray User Group (CUG ’11), 2011. [29] C. Chang, J. Wawrzynek, and R. W. Brodersen. BEE2: A High-End Reconfigurable Computing System. IEEE Design & Test of Computers, 22(2):114–125, 2005. [30] P. Charles, C. Grothoff, V. A. Saraswat, C. Donawa, A. Kielstra, K. Ebcioglu, C. von Praun, and V. Sarkar. X10: An Object-Oriented Approach to Non-Uniform Cluster Computing. In Proceedings of the 2005 Conference on Object-Oriented Programming Systems, Languages and Applications (OOPSLA ’05), pages 519–538, 2005. [31] B. Choi, R. Komuravelli, H. Sung, R. Bocchino, S. Adve, and V. Adve. Denovo: Rethinking Hardware for Disciplined Parallelism. In Proceedings of the 2010 Workshop on Hot Topics in Parallelism (HotPar ’10), pages 1–7, 2010. [32] B. Choi, R. Komuravelli, H. Sung, R. Smolinski, N. Honarmand, S. V. Adve, V. S. Adve, N. P. Carter, and C. T. Chou. DeNovo: Rethinking the Memory Hierarchy for Disciplined Parallelism. In Proceedings of the 2011 Conference on Parallel Architectures and Compilation Techniques (PACT ’11), pages 155–166, 2011. [33] J. D. Davis. FAST: A Flexible Architecture for Simulation and Testing of Multiprocessor and CMP Systems. PhD thesis, Stanford University, 2006. [34] J. D. Davis, C. P. Thacker, and C. Chang. BEE3: Revitalizing Computer Architecture Research. Technical Report MSR-TR-2009-45, Microsoft Research, April 2009. [35] D. Doerfler and R. Brightwell. Measuring MPI Send and Receive Overhead and Application Availability in High Performance Network Interfaces. In Recent Advances in Parallel Virtual Machine and Message Passing Interface, volume 4192 of Lecture Notes in Computer Science, pages 331–338. Springer, 2006. [36] J. Dubinski. A Parallel Tree Code. New Astronomy, 1(2):133–147, 1996. [37] A. Duran, E. Ayguadé, R. M. Badia, J. Labarta, L. Martinell, X. Martorell, and J. Planas. OmpSs: A Proposal for Programming Heterogeneous Multi-Core Architectures. Parallel Processing Letters, 21(02):173–193, 2011. [38] Y. H. Eom, S. Yang, J. C. Jenista, and B. Demsky. DOJ: Dynamically Parallelizing Object-Oriented Programs. In Proceedings of the 2012 Symposium on Principles and Practice of Parallel Programming (PPoPP ’12), pages 85–96, 2012. [39] H. Esmaeilzadeh, E. Blem, R. S. Amant, K. Sankaralingam, and D. Burger. Dark Silicon and the End of Multicore Scaling. In Proceedings of the 2011 International Symposium on Computer Architecture (ISCA ’11), pages 365–376, 2011. [40] H. Esmaeilzadeh, E. Blem, R. S. Amant, K. Sankaralingam, and D. Burger. Power Challenges May End the Multicore Era. Communications of the ACM, 56(2):93–102, Feb 2013.
110
Bibliography
[41] K. Fatahalian, D. R. Horn, T. J. Knight, L. Leem, M. Houston, J. Y. Park, M. Erez, M. Ren, A. Aiken, W. J. Dally, and P. Hanrahan. Sequoia: Programming the Memory Hierarchy. In Proceedings of the 2006 International Conference for High Performance Computing, Networking, Storage and Analysis (SC ’06), 2006. [42] FORTH-ICS. The Formic Board, 2013. http://formic-board.com. [43] FORTH-ICS. The Myrmics Runtime System, 2013. http://myrmics.com. [44] M. Frigo, C. E. Leiserson, and K. H. Randall. The Implementation of the Cilk-5 Multithreaded Language. In Proceedings of the 1998 Conference on Programming Language Design and Implementation (PLDI ’98), pages 212–223, 1998. [45] E. Gal and S. Toledo. Algorithms and Data Structures for Flash Memories. ACM Computing Surveys, 37(2):138–163, 2005. [46] D. Gay and A. Aiken. Language Support for Regions. In Proceedings of the 2001 Conference on Programming Language Design and Implementation (PLDI ’01), pages 70–80, 2001. [47] D. E. Gay. Memory Management with Explicit Regions. PhD thesis, UC Berkeley, Berkeley, CA, USA, 2001. [48] J. Gibson, R. Kunz, D. Ofelt, and M. Heinrich. FLASH vs. (Simulated) FLASH: Closing the Simulation Loop. In Proceedings of the 2000 Conference on Architectural Support for Programming Languages and Operating Systems (ASPLOS ’00), pages 49–58, 2000. [49] P. Greenhalgh. Big.LITTLE Processing with ARM Cortex-A15 & Cortex-A7. White paper, ARM Ltd., Sep 2011. [50] D. Grove, O. Tardieu, D. Cunningham, B. Herta, I. Peshansky, and V. Saraswat. A Performance Model for X10 Applications. In Proceedings of the 2011 Workshop on X10 (X10 ’11), 2011. [51] D. J. Hennessy. A Conversation with John Hennessy and David Patterson. ACM Queue, 4(10), 2006. [52] P. N. Hilfinger, D. O. Bonachea, K. Datta, D. Gay, S. L. Graham, B. R. Liblit, G. Pike, J. Z. Su, and K. A. Yelick. Titanium Language Reference Manual, Version 2.19. Technical Report UCB/EECS-2005-15, EECS Berkeley, November 2005. [53] J. Howard, S. Dighe, Y. Hoskote, S. R. Vangal, D. Finan, G. Ruhl, D. Jenkins, H. Wilson, N. Borkar, G. Schrom, F. Pailet, S. Jain, T. Jacob, S. Yada, S. Marella, P. Salihundam, V. Erraguntla, M. Konow, M. Riepen, G. Droege, J. Lindemann, M. Gries, T. Apel, K. Henriss, T. Lund-Larsen, S. Steibl, S. Borkar, V. De, R. F. V. der Wijngaart, and T. G. Mattson. A 48-Core IA-32 Message-passing Processor with DVFS in 45nm CMOS. In Proceedings of the 2010 International Solid-State Circuits Conference (ISSCC ’10), pages 108–109, 2010. [54] R. L. Hudson, B. Saha, A.-R. Adl-Tabatabai, and B. C. Hertzberg. McRT-Malloc: A Scalable Transactional Memory Allocator. In Proceedings of the 2006 International Symposium on Memory Management (ISMM ’06), pages 74–83, 2006.
111 [55] P. Husbands, C. Iancu, and K. Yelick. A Performance Analysis of the Berkeley UPC Compiler. In Proceedings of the 2003 International Conference on Supercomputing (ICS ’03), pages 63–73, 2003. [56] ITRS. The International Technology Roadmap for Semiconductors: 2012 Update, 2012. http://www.itrs.net/Links/2012ITRS/2012Chapters/2012Overview.pdf. [57] D. N. Jayasimha, B. Zafar, and Y. Hoskote. On-Chip Interconnection Networks: Why They are Different and How to Compare Them. Technical report, Intel Corp., 2006. [58] D. Jeon, S. Garcia, C. M. Louie, and M. B. Taylor. Kismet: Parallel Speedup Estimates for Serial Programs. In Proceedings of the 2011 Conference on Object-Oriented Programming Systems, Languages and Applications (OOPSLA ’11), pages 519–536, 2011. [59] M. S. Johnstone and P. R. Wilson. The Memory Fragmentation Problem: Solved? SIGPLAN Notices, 34:26–36, October 1998. [60] S. Kahan and P. Konecny. “MAMA!”: A Memory Allocator for Multithreaded Architectures. In Proceedings of the 2006 Symposium on Principles and Practice of Parallel Programming (PPoPP ’06), pages 178–186, 2006. [61] J. A. Kahle, M. N. Day, H. P. Hofstee, C. R. Johns, T. R. Maeurer, and D. Shippy. Introduction to the Cell Multiprocessor. IBM Journal of Research & Development, 49(4/5):589–604, 2005. [62] A. B. Kahng, B. Li, L.-S. Peh, and K. Samadi. ORION 2.0: A Fast and Accurate NoC Power and Area Model for Early-stage Design Space Exploration. In Proceedings of the 2009 Conference on Design, Automation & Test in Europe (DATE ’09), pages 423–428, 2009. [63] M. Katevenis, V. Papaefstathiou, S. Kavadias, D. Pnevmatikatos, F. Silla, and D. S. Nikolopoulos. Explicit Communication and Synchronization in SARC. IEEE Micro, 30(5):30–41, 2010. [64] S. Kavadias, M. Katevenis, M. Zampetakis, and D. Nikolopoulos. On-chip communication and synchronization mechanisms with cache-integrated network interfaces. In Proceedings of the 2010 Conference on Computing Frontiers (CF ’10), pages 217–226, 2010. [65] S. Kavvadias. Direct Communication and Synchronization Mechanisms in Chip Multiprocessors (Ph. D. thesis). Technical Report TR-411, FORTH-ICS, December 2010. [66] R. Knauerhase, R. Cledat, and J. Teller. For Extreme Parallelism, Your OS Is Sooooo Last-Millennium. In Proceedings of the 2012 Workshop on Hot Topics in Parallelism (HotPar ’12), pages 3–3, 2012. [67] A. Krasnov, A. Schultz, J. Wawrzynek, G. Gibeling, and P.-Y. Droz. RAMP Blue: A Message-Passing Manycore System in FPGAs. In Proceedings of the 2007 Conference on Field Programmable Logic and Applications (FPL ’07), pages 54–61, 2007. [68] A. Kukanov and M. Voss. The Foundations for Scalable Multi-Core Software in Intel Threading Building Blocks. Intel Technology Journal, 11(4), Nov. 2007. [69] E. A. Lee. The Problem with Threads. Computer, 39(5):33–42, May 2006.
112
Bibliography
[70] L. Linardakis. Decoupling Method for Parallel Delaunay Two-Dimensional Mesh Generation. PhD thesis, College of William & Mary, Williamsburg, VA, USA, 2007. [71] J. Liu, J. Wu, and D. Panda. High Performance RDMA-Based MPI Implementation over InfiniBand. International Journal of Parallel Programming, 32:167–198, 2004. [72] P. Lotfi-Kamran, B. Grot, M. Ferdman, S. Volos, O. Kocberber, J. Picorel, A. Adileh, D. Jevdjic, S. Idgunji, E. Ozer, and B. Falsafi. Scale-Out Processors. In Proceedings of the 2012 International Symposium on Computer Architecture (ISCA ’12), pages 500–511, 2012. [73] S. Lyberis and G. Kalokerinos. The 512-core Formic Hardware Prototype: Architecture Manual & Programmer’s Model. Technical Report TR-430, FORTH-ICS, June 2012. [74] S. Lyberis, G. Kalokerinos, M. Lygerakis, V. Papaefstathiou, D. Tsaliagkos, M. Katevenis, D. Pnevmatikatos, and D. Nikolopoulos. Formic: Cost-efficient and Scalable Prototyping of Manycore Architectures. In Proceedings of the 2012 Symposium on Field-Programmable Custom Computing Machines (FCCM ’12), pages 61–64, 2012. [75] S. Lyberis, P. Pratikakis, D. S. Nikolopoulos, M. Schulz, T. Gamblin, and B. R. de Supinski. The Myrmics Memory Allocator: Hierarchical, Message-Passing Allocation for Global Address Spaces. In Proceedings of the 2012 International Symposium on Memory Management (ISMM ’12), pages 15–24, 2012. [76] P. S. Magnusson, M. Christensson, J. Eskilson, D. Forsgren, G. Hållberg, J. Högberg, F. Larsson, A. Moestedt, and B. Werner. Simics: A Full System Simulation Platform. IEEE Computer, 35(2):50–58, 2002. [77] D. A. Mallón, G. L. Taboada, C. Teijeiro, J. Touriño, B. B. Fraguela, A. Gómez, R. Doallo, and J. C. Mouriño. Performance Evaluation of MPI, UPC and OpenMP on Multicore Architectures. In Recent Advances in Parallel Virtual Machine and Message Passing Interface, pages 174–184. Springer, 2009. [78] M. M. K. Martin, D. J. Sorin, B. M. Beckmann, M. R. Marty, M. Xu, A. R. Alameldeen, K. E. Moore, M. D. Hill, and D. A. Wood. Multifacet’s General Execution-driven Multiprocessor Simulator (GEMS) Toolset. SIGARCH Computer Architecture News, 33(4):92–99, 2005. [79] T. G. Mattson, M. Riepen, T. Lehnig, P. Brett, W. Haas, P. Kennedy, J. Howard, S. Vangal, N. Borkar, G. Ruhl, and S. Dighe. The 48-core SCC Processor: the Programmer’s View. In Proceedings of the 2010 International Conference for High Performance Computing, Networking, Storage and Analysis (SC ’10), pages 1–11, 2010. [80] J. D. McCalpin. Memory Bandwidth and Machine Balance in Current High Performance Computers. IEEE Technical Committee on Computer Architecture Newsletter, Dec 1995. [81] M. M. Michael. Scalable Lock-Free Dynamic Memory Allocation. SIGPLAN Notices, 39:35–46, June 2004. [82] J. Miller, H. Kasture, G. Kurian, C. Gruenwald, N. Beckmann, C. Celio, J. Eastep, and A. Agarwal. Graphite: A Distributed Parallel Simulator for Multicores. In Proceedings of the 2010 Symposium on High-Performance Computer Architecture (HPCA ’10), pages 1–12, 2010.
113 [83] MPICH. High-Performance Portable MPI, 2013. http://www.mpich.org. [84] R. W. Numrich and J. Reid. Co-Array Fortran for Parallel Programming. SIGPLAN Fortran Forum, 17:1–31, August 1998. [85] OpenCores. OpenRISC project, 2012. http://opencores.org/project,or1k. [86] OpenMP ARB. OpenMP Application Program Interface, version 3.1. www.openmp.org, July 2011.
http://
[87] OpenMPI. Open Source High Performance Computing, 2013. http://www.openmpi.org. [88] V. Papaefstathiou, M. G. Katevenis, D. S. Nikolopoulos, and D. Pnevmatikatos. Prefetching and Cache Management Using Task Lifetimes. In Proceedings of the 2013 International Conference on Supercomputing (ICS ’13), pages 1–10, 2013. [89] A. Patel, C. A. Madill, M. Saldaña, C. Comis, R. Pomes, and P. Chow. A Scalable FPGA-based Multiprocessor. In Proceedings of the 2006 Symposium on FieldProgrammable Custom Computing Machines (FCCM ’06), pages 111–120, 2006. [90] D. Patterson, K. Asanovic, K. Keutzer, et al. Computer Architecture is Back: The Berkeley View on the Parallel Computing Landscape, January 2007. http:// www.stanford.edu/class/ee380/Abstracts/070131-BerkeleyView1.7.pdf. [91] J. M. Perez, R. M. Badia, and J. Labarta. A Dependency-Aware Task-Based Programming Environment for Multi-Core Architectures. In Proceedings of the 2008 IEEE Cluster Conference (CLUSTER ’08), pages 142–151, 2008. [92] J. M. Perez, R. M. Badia, and J. Labarta. Handling Task Dependencies under Strided and Aliased References. In Proceedings of the 2010 International Conference on Supercomputing (ICS ’10), pages 263–274, 2010. [93] A. Pop and A. Cohen. OpenStream: Expressiveness and Data-Flow Compilation of OpenMP Streaming Programs. ACM TACO, 9(4):53:1–53:25, 2013. [94] P. Pratikakis, H. Vandierendonck, S. Lyberis, and D. S. Nikolopoulos. A Programming Model for Deterministic Task Parallelism. In Proceedings of the 2011 Workshop on Memory Systems Performance and Correctness (MSPC ’11), pages 7–12, 2011. [95] A. Rico, F. Cabarcas, C. Villavieja, M. Pavlovic, A. Vega, Y. Etsion, A. Ramirez, and M. Valero. On the Simulation of Large-Scale Architectures Using Multiple Application Abstraction Levels. ACM TACO, 8(4):36:1–36:20, 2012. [96] M. Snir, S. W. Otto, D. W. Walker, J. Dongarra, and S. Huss-Lederman. MPI: The Complete Reference. MIT Press, Cambridge, MA, USA, 1995. ISBN 0262691841. [97] G. E. Suh, C. W. O’Donnell, and S. Devadas. Aegis: A Single-Chip Secure Processor. IEEE Design & Test of Computers, 24(6):570–580, 2007. [98] H. Sun, J. Liu, R. Anigundi, N. Zheng, J.-Q. Lu, K. Rose, and T. Zhang. 3D DRAM Design and Application to 3D Multicore Systems. IEEE Design Test of Computers, 26(5):36 –47, 2009. [99] Z. Tan, A. Waterman, H. Cook, S. Bird, K. Asanovic, and D. A. Patterson. A Case for FAME: FPGA Architecture Model Execution. In Proceedings of the 2010 International Symposium on Computer Architecture (ISCA ’10), pages 290–301, 2010.
114
Bibliography
[100] S. Tasırlar and V. Sarkar. Data-Driven Tasks and their Implementation. In Proceedings of the 2011 International Conference on Parallel Processing (ICPP ’11), pages 652–661, 2011. [101] E. Tejedor, M. Farreras, D. Grove, R. M. Badia, G. Almasi, and J. Labarta. ClusterSs: A Task-based Programming Model for Clusters. In Proceedings of the 2011 Symposium on High-Performance Parallel and Distributed Computing (HPDC ’11), pages 267–268, 2011. [102] C. P. Thacker. Beehive: A many-core computer for FPGAs. Technical report, Microsoft Research, January 2010. [103] The DINI Group. Product Catalog, 2012. http://www.dinigroup.com/products.php. [104] M. Tofte and J.-P. Talpin. Region-Based Memory Management. Information and Computation, 132(2):109–176, 1997. [105] E. Totoni, B. Behzad, S. Ghike, and J. Torrellas. Comparing the Power and Performance of Intel’s SCC to State-of-the-Art CPUs and GPUs. In Proceedings of the 2012 International Symposium on Performance Analysis of Systems and Software (ISPASS ’12), pages 78–87, 2012. [106] G. Tzenakis, A. Papatriantafyllou, J. Kesapides, P. Pratikakis, H. Vandierendonck, and D. S. Nikolopoulos. BDDT: Block-level Dynamic Dependence Analysis for Deterministic Task-based Parallelism. In Proceedings of the 2012 Symposium on Principles and Practice of Parallel Programming (PPoPP ’12), pages 301–302, 2012. [107] UPC Consortium. UPC Language Specification v. 1.2, 2005. http://upc.gwu.edu/ docs/upc_specs_1.2.pdf. [108] D. Wang, B. Ganesh, N. Tuaycharoen, K. Baynes, A. Jaleel, and B. Jacob. DRAMsim: A Memory System Simulator. SIGARCH Computer Architecture News, 33(4): 100–107, 2005. [109] M. Ware, K. Rajamani, M. Floyd, B. Brock, J. Rubio, F. Rawson, and J. Carter. Architecting for Power Management: The IBM POWER7 Approach. In Proceedings of the 2010 Symposium on High-Performance Computer Architecture (HPCA ’10), pages 1–11, 2010. [110] S. Wee, J. Casper, N. Njoroge, Y. Teslyar, D. Ge, C. Kozyrakis, and K. Olukotun. A Practical FPGA-based framework for Novel CMP Research. In Proceedings of the 2007 Conference on International Symposium on Field-Programmable Gate Arrays (FPGA ’07), pages 116–125, 2007. [111] D. Wentzlaff and A. Agarwal. Factored Operating Systems (fos): The Case for a Scalable Operating System for Multicores. Operating Systems Review, 43(2):76–85, 2009. [112] Wikipedia. Commonly Used and Standardized CRCs, 2011. http://en.wikipedia.org/ wiki/Cyclic_redundancy_check. [113] D. Woodhouse. JFFS: The Journalling Flash File System. In Proceedings of the 2001 Ottawa Linux Symposium (OLS ’01), 2001.
115 [114] L. Woods and K. Eguro. Groundhog—A Serial ATA Host Bus Adapter (HBA) for FPGAs. In Proceedings of the 2012 Symposium on Field-Programmable Custom Computing Machines (FCCM ’12), pages 220–223, 2012. [115] Xilinx Inc. Platform Studio and the Embedded Development Kit (EDK), 2012. http://www.xilinx.com/tools/platform.htm. [116] Xilinx Inc. MicroBlaze Soft Processor Core, 2012. http://www.xilinx.com/tools/ microblaze.htm. [117] Xilinx Inc. Xilinx University Program XUPV5-LX110T Development System, 2012. http://www.xilinx.com/univ/xupv5-lx110t.htm. [118] F. S. Zakkak, D. Chasapis, P. Pratikakis, A. Bilas, and D. S. Nikolopoulos. Inference and Declaration of Independence: Impact on Deterministic Task Parallelism. In Proceedings of the 2012 Conference on Parallel Architectures and Compilation Techniques (PACT ’12), pages 453–454, 2012.