Municipal Market: Technicals Override Solid Fundamentals Market Commentary
Fourth Quarter 2016
MUNICIPALS UNDERPERFORMED TREASURIES IN THE FOURTH QUARTER, following a redemption-driven, spiraling sell-off that was exacerbated by both tactical moves and tax loss selling at year end. Historically, once such periods end and the market stabilizes, performance has improved. Economic data continues to strengthen. We believe both global and domestic monetary policy will remain accommodative. Municipal credit spreads are elevated, representing an opportunity for investors once fundamentals are again the primary drivers of performance.
U.S. Economic Growth Encompasses More Sectors ECONOMIC DATA were somewhat stronger in the second half of 2016, accelerating from a very slow start. First half real gross domestic product (GDP) averaged just 1.1%, lagging recent trends. Third quarter GDP increased to 3.5% and fourth quarter estimates range from 2.25% to 2.5%. For all of 2016, real GDP appears to have advanced at approximately a 2% pace, which is in line with the economic recovery period that began in 2010. EMPLOYMENT reports showed the economy adding 161,000 jobs in October, with the unemployment rate at 4.9%. November saw 198,000 jobs added with unemployment falling to 4.6%, while December’s figure was 144,000 net new jobs with unemployment at 4.7%. This steady pattern, averaging 168,000 jobs per month, exemplifies an economy running very close to full employment. As a result, wages are rising, but the increase is still gradual with an average hourly earnings increase of 2.9% year over year. Inflation is expected to increase due to the combination of much anticipated fiscal stimulus after the election results, accommodative monetary policy and near full employment. Actual inflation remained tame for 2016, in line with recent trends. Core CPI (excluding food and energy) increased at a 2.2% annual rate, while the core PCE deflator most recently increased by 1.6%, year over year. While the economy was stronger in the second half of the year than the first, overall 2016 growth and inflation remain in line with recent trends of approximately 2.0%.
John V. Miller Co-Head of Fixed Income Nuveen Asset Management, LLC
Leading the Way in Municipal Bonds Since 1898, Nuveen Investments has been a pioneer in municipal bonds, helping to build lasting value for investors. This municipal bond heritage is reflected in the way Nuveen Asset Management manages portfolios today.* ▪▪ 119 years of experience ▪▪ 25 credit research analysts ▪▪ $118.2 billion in municipal bond AUM Through ongoing publications, the team is committed to helping investors understand today’s pressing issues. * Nuveen Investments, Inc. traces its history back to 1898. Nuveen’s asset management business was established in 1989. Nuveen Asset Management credit research analysts and AUM as of 12/31/16.
NOT FDIC INSURED NO BANK GUARANTEE MAY LOSE VALUE
Municipal Market: Technicals Override Solid Fundamentals
Fourth Quarter 2016
Few details are available yet on these priorities, or how they will be funded. Current assumptions may prove premature. We caution that some recent projections are based only on initial sketches of policy proposals. One-party control of Congress and the White House creates a level of certainty that something will be accomplished, but legislation passed and eventually implemented in 2017 and 2018 could diverge significantly from the current policy outlines.
MANUFACTURING is improving after lagging for some time. The ISM Manufacturing Index rose above the threshold level of 50 to 54.7 in the most recent release. This data provides evidence of progress in the second half, and a broadening of the sectors participating in the improvement. CONSUMER SPENDING increased by 3.3% in 2016, accelerating from 2.3% in 2015. The increase is primarily due to strong auto sales. Consumer confidence rose to 113.7, the highest level since the recovery began in 2010. This is most likely due to the low unemployment rate and the low level of weekly unemployment claims, indicating layoffs are becoming less common.
VOLATILITY IN NOVEMBER AND DECEMBER was driven more by the surprise election results than fundamentals. Municipals would normally behave more defensively.
HOUSING continues to grow, with the home price index up 5.6% year over year at the end of December. Home sales also increased 1.4% year over year.
ECB Expands Bond Purchase Program The European economy is faring better than many had forecast, with the broad growth rate holding steady at approximately 1% during 2016. U.S. interest rates have followed a similar pattern to global rates. Global and U.S. rates have both increased, but U.S. Treasury rates have risen significantly. Thus the spread has increased between the 10-year U.S. Treasury bond yield and comparable highly rated sovereign bonds.
Post-Election Municipal Sell-Off Is Overdone The firming of the overall economy in the second half of 2016 was significant for both the stock and bond markets. However, volatility in November and December was driven more by the surprise election results than fundamentals. Municipals would normally behave more defensively in a purely interest rate driven sell-off. This time, confusion and speculation around projected infrastructure spending and tax code changes may have affected performance. In addition, credit spreads would normally narrow for fundamental reasons if the sharp yield increase reflected discounting of stronger 2017 economic growth.
The European Central Bank (ECB) announced an extension of its asset purchase program from March 2017 to December 2017. The size of the purchase program was reduced to €60 billion per month from the current level of €80 billion. Global yields rose slightly in response to this announcement, perhaps because the ECB was seen as reducing its commitment to negative interest rates. However, the new policy can also be viewed as a strong commitment to low rates, given the nine-month extension of QE and a statement of intent to extend the program further if inflation does not increase.
This narrowing of credit spreads occurred in the taxable fixed income markets, including major tightening for corporate high yield. One would expect similar narrowing within the credit sensitive municipal bond asset class, but instead municipal spreads widened for technical reasons.
Several factors have contributed to a stronger overall trend in the U.S. dollar versus major trading partners and currencies. These include second half economic improvement, the election results and extensions of QE policies in both Europe and Japan. A rising dollar is generally bond positive because it tends to reduce inflation due to lower import and commodity prices. It also creates growth concerns, because a stronger dollar increases the trade deficit by reducing exports and increasing imports.
Several changes are expected in the wake of the election, including tax cuts, new stimulus spending for infrastructure and a massive increase in the federal deficit. Many constraints to this view have garnered very little attention, including a Republican focus on debt reduction and the Budget Control Act (known as sequestration) that requires budgetary changes to be fiscally neutral.
2
Municipal Market: Technicals Override Solid Fundamentals
Fourth Quarter 2016
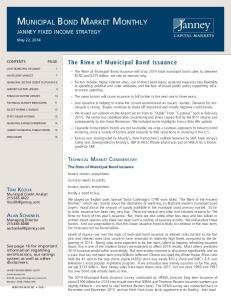
Ratios Vary Based on the Maximum Tax Rate
Municipals Outperform Treasuries
Bond Buyer 20 / Treasury Ratios
Municipal bonds outperformed Treasuries in the first half of the year, but underperformed during the rate sell-off in the fourth quarter. The 30-year U.S. Treasury yield rose sharply during the quarter from 2.32% to 3.07%. The 10-year Treasury yield rose from 1.60% to 2.45%. The 30-year AAA municipal benchmark yield increased from 2.31% to 3.04%, while 10-year municipal yields rose from 1.51% to 2.31%. Because of a two-week rally in municipals at the end of December, municipal-to-Treasury ratios remain largely unchanged at 94% and 100% for 10- and 30-year ratios, respectively. The 10-year ratio rose as high as 115% in midDecember due to municipal-specific concerns that contributed to investor outflows from the asset class.
Period
Maximum Tax Rate
BB20/10-Year
BB20/30-Year
1982-1986
50.0%
87.7%
87.4%
1987
38.5%
91.0%
89.0%
1988-1990
33.0%
85.7%
85.3%
1991-1992
31.0%
90.2%
84.5%
1993-2001
39.6%
93.5%
88.8%
Data source: Maximum Tax Rate, Walters Kluwer, CCH, http://www.cch.com/ WBOT2013/029IncomeTaxRates.asp. Past performance is no guarantee of future results. Indices are unmanaged and unavailable for direct investment.
As a result of the Tax Reform Act of 1986, the maximum federal tax rate fell from 50% to 38.5% in the transition year of 1987, then to 33% for the next two years. The initial drop in the tax rate was accompanied by an increase in the ratios in 1987, which is what one would expect if the maximum tax rate affected the pricing of tax-free securities.
Fed Is More Hawkish Since the Election The Federal Reserve (Fed) raised interest rates 25 bps in December as expected. Although this was only the second fed funds rate hike in more than ten years, the increase did not move markets because it was so well anticipated. The Fed’s objectives are generally being met, as the economy approaches the definition of full employment and inflation moves toward 2%. Given this, the Fed’s message to the markets is becoming somewhat more hawkish.
However, when the tax rate fell to 33%, the average ratios declined to levels lower than when the top tax rate was 50%. The slight reduction in the tax rate in 1991 and 1992 was associated with an increase in the ratio versus 10-year Treasuries, but a modest decrease in the ratio to 30-year Treasuries.
A CHANGE IN THE TOP marginal income tax rate has made no discernable impact on municipal bond performance.
The Fed also appears to be thinking about future fiscal stimulus given the election results and rhetoric. There could possibly be a need to offset fiscal stimulus with a tighter monetary policy to suppress potential inflation. Perhaps as a result, the Fed is forecasting three rates hikes in 2017, which is slightly more hawkish than the fixed income markets anticipated.
The difference between the 10-year and 30-year ratios resulted from a steepening of the yield curve as the fed funds rate was lowered from an average of 6.91% in January 1991 to 2.92% in December 1992. Finally, when the tax rate jumped to 39.6% in 1993, municipal-to-Treasury ratios also rose, instead of falling as one might expect.
Lower Tax Rates Have Not Affected Municipal Bond Pricing There has been concern that lower corporate and personal income tax rates will reduce demand for municipal bonds. Historically, a change in the top marginal income tax rate has made no discernable impact on municipal bond market performance in the following year.
Regardless of one’s theory about the factors that affect pricing of tax-exempt bonds relative to taxable securities, the historical record indicates we cannot assume that a lower top marginal tax rate leads to higher ratios of tax-exempt to taxable yields.
The table shows how the average ratio of tax-exempt to taxable yields has varied under different tax regimes.
3
Municipal Market: Technicals Override Solid Fundamentals
Technical Abnormalities Drive the Market
Fourth Quarter 2016
In the corporate market, credit spreads have narrowed to a greater degree than Treasury interest rate increases because investors are predicting a stronger economy in 2017. Fundamentally, a stronger 2017 economy characterized by more fiscal stimulus and infrastructure spending would also benefit municipal credit and lead to narrower spreads. This is a fundamental argument temporarily obscured by volatile technical factors.
SUPPLY. 2016 supply totaled $452 billion, eclipsing the prior record high of $440 billion set in 2010. More than 60% of the new issues were for refinancing. In the first three quarters of the year, robust demand easily absorbed the supply. That changed in the fourth quarter, and new issue bonds sold at significantly cheaper yields to clear the market. Looking forward, we think 2017 supply will drop below the 2016 record levels, and is likely to be less than $400 billion. The change relates specifically to refinancing volumes. After three consecutive years of unusually heavy refinancing activity, both market conditions and the supply of bonds for refinancing will make it more difficult to keep up this pace. In 2016, the breakdown was approximately $172 billion raised for new projects and $280 billion for refinancing. While new projectoriented issuance should continue to increase, the 20-year average is $194 billion. Using that figure as a base, we could easily see refinancing transactions dropping below $200 billion, particularly if market volatility continues. Uncertainty around President Trump’s polices could further curtail the overall flow of new issue bonds.
DEFAULTS. As we have warned for several years, Puerto Rico’s $25.4 billion (par value) of defaults represented 93% of all municipal bond defaults for 2016. Defaults excluding Puerto Rico were just $1.8 billion, one of the lowest levels in the years since the financial crisis of 2008. No single theme characterizes 2016 defaults, as they are low and idiosyncratic. No Moody’srated municipal bond defaulted in 2016.
Credit Risks Due to Pensions Continue UPGRADES/DOWNGRADES. We expect that upgrades should continue to exceed downgrades. Most downgrades are in New Jersey, Illinois and to a lesser extent Pennsylvania and Michigan. They are mainly focused on the Midwestern rust belt states and states with underfunded pensions. Most downgrades are coming from general obligations bonds (GOs) rather than revenue bonds.
DEMAND. Municipal bond demand was remarkably steady from September 2015 to October 2016. For 55 consecutive weeks, inflows averaged approximately $1 billion per week. Outflows began in mid-October 2016, coinciding with higher interest rates. November was dominated by election results that exacerbated general fixed income concerns. December was characterized by tax-loss selling of municipals. Outflows totaled approximately $26 billion for the last two months of the year, skewed toward high yield municipals.
Number of Upgrades Exceeds Downgrades Number of Upgrades/Downgrades Moody’s
S&P
All Public Finance
163/96
209/158
Tax & Appropriation
79/54
153/110
Revenue
84/42
66/48
391/388
719/473
Tax & Appropriation
217/229
485/307
Revenue
174/159
234/166
Third Quarter 2016
SPREADS. Surprisingly, high yield municipal credit spreads (ex-Puerto Rico) widened by 54 bps during the quarter, from 231 bps to 285 bps. This is the widest spread since 2013. The widening trend defies fundamentals, as defaults are very low (ex-Puerto Rico) and overall credit quality trends have been stable.
2016 Year to Date (through 9/30/16): All Public Finance
Data source: Moody’s Investors Service, Standard & Poor’s.
TOBACCO. Tobacco securitization bonds outperformed the general municipal market every quarter since 2013 until the fourth quarter of 2016. This strong overall performance was due to yield, narrowing credit spreads and a moderation of declines in cigarette sales. After an 11.8% increase in total return for the first three quarters of 2016, tobacco bonds lost approximately -6.1% during the fourth quarter. Tobacco tends to be a liquidity-driven bond, and liquidity needs driven by high
This spread widening reflects a technical shift driven by outflows. Approximately 50% of recent redemptions have come from high yield municipals, yet high yield municipals make up only 15% of the overall asset base. A rising liquidity premium is one way to describe the elevated spread level with stable fundamentals. We believe this represents an opportunity, given that fundamentals will likely catch up and ultimately be more important. 4
Municipal Market: Technicals Override Solid Fundamentals
yield fund redemptions weakened performance. Importantly, the fundamentals of this segment remained broadly unchanged for the quarter.
Fourth Quarter 2016
University of Puerto Rico subsidies and pensions. The Rosselló administration officially responded to the board, making clear many of the proposed reductions are unacceptable and they will pursue alternate measures to reach the savings target.
PUERTO RICO. Puerto Rico’s newly elected governor, Ricardo Rosselló and the Congressionally-appointed Financial Oversight Board continue to work toward adoption of a Fiscal and Economic Growth Plan (FEGP), as required by the Puerto Rico Oversight, Management and Economic Stability Act (PROMESA). Late last year, the board set an aggressive time line for adopting a fiscal plan by the end of January. In response to the new administration’s early request for a revised schedule, the board released a statement in mid-January indicating they are inclined to accept a slightly longer time frame, provided the governor agrees to several interim deadlines and conditions.
In the short time the governor has been in office, he has signed several executive orders and proposed multiple bills aimed at controlling expenditures, improving government operations and encouraging economic development. The governor is also expected to introduce legislation to replace the Commonwealth’s expiring debt moratorium law in the near term and establish greater clarity for how the government will prioritize debt payments until they can complete a debt restructuring. This process is unavoidably contentious, but the board clearly prefers to work closely with elected officials on both the fiscal plan and debt restructuring negotiations. The transparent coordination between the board and the new administration is critical to establishing and maintaining the political legitimacy of the process. Necessary reform measures and expenditure reductions will unquestionably be difficult to implement. Cooperation between the board and government could make the process easier; conflict will make implementation much more challenging.
The board is now asking for the proposed fiscal plan to be submitted by February 28 with the intention of having the plan certified by March 15. The board is also likely to extend the legal stay on creditor lawsuits to May 1, as permitted by PROMESA, at their next board meeting in late January. Various creditor groups have publically expressed support for extending the stay.
TOBACCO TENDS TO BE A LIQUIDITY-DRIVEN BOND, and liquidity needs driven by high yield fund redemptions weakened performance.
Once the fiscal plan is certified, debt restructuring negotiations can begin in earnest. Preliminary meetings between creditors, the government and the board are already taking place. We expect debt restructuring and structural reforms will take longer than the board or creditors would like. Future conflict between the board and elected officials, whether the new governor, legislature or local officials, is likely inevitable and will slow down implementation of the fiscal plan and complicate debt negotiations.
The oversight board recently set a savings target of $4.5 billion for the proposed fiscal plan to meet as a prerequisite to be certified. It made clear it will not support any short-term liquidity loans or near-term financing. Board projections now put the average annual fiscal gap for fiscal years (FY) 2019 through 2026 at $7.0 billion. The gap in 2019, inclusive of debt service, is estimated to be $7.6 billion, equivalent to 49% of baseline revenues. About half of the gap, $3.9 billion, is attributed to contractual debt service in fiscal 2019.
CHICAGO. The city of Chicago recently issued more than $1 billion of general obligation (GO) bonds. Proceeds will be used for a mix of new money and refunding, including scoop and toss refunding. The city indicates it intends to end the practice of issuing new bonds to pay off near-term debt service, a practice known as scoop and toss, after this issuance.
The fiscal initiatives and structural reform proposals aimed at closing the budget imbalance by FY19 were outlined in the board’s most recent communication. The board’s recommendations for how to achieve the $4.5 billion in savings includes both revenue increases and expenditure reductions to right-size government, as well as cuts to health care,
Although the city’s credit rating has been affirmed at BBB+ (stable outlook) by S&P and BBB- (stable outlook) by Fitch, Moody’s rates the city’s outstanding GO bonds below investment grade at Ba1 and maintains a negative outlook.
5
Municipal Market: Technicals Override Solid Fundamentals
Chicago continues to be penalized by the market for its massive pension liabilities. The tax-exempt portion of the recent deal priced at a spread of over 330 basis points, 100 basis points wider than the city’s GO deal a year prior. Although the city has identified new revenue sources to dedicate to pensions, including higher property taxes and a new tax on water and sewer services, further resources will be needed in the future to prevent the liabilities from growing. The city’s plan to increase pension funding to municipal employees’ and laborers pensions is contingent on state lawmakers enacting legislation outlining a ramp up in contributions. The House and Senate have approved the bill, but it is unclear whether Governor Rauner will sign or veto it, as he did to similar legislation for Chicago’s public safety pensions last year. The General Assembly overrode the veto for the public safety pension funding plan, but a new slate of lawmakers has been sworn in, creating uncertainty as to whether a super-majority needed to overturn a veto would vote for the municipal employees’ and laborers pension bill. If the legislation is not enacted, Chicago may revert to making lower contributions based on the current statutory funding formula, a practice that places the plans on track to become insolvent in about a decade, underscoring the need for higher contributions. Improving pension funding will require fiscal discipline over the long-term. ILLINOIS. State leaders in Illinois have not yet arrived at a budget compromise. The partial, six-month stop gap budget passed last year for the first half of FY17 expired at year end, and many state functions currently do not have spending authority. There may be some hope of compromise emerging from the State Senate. A bipartisan effort has put forward a package of bills that could become the basis for a potential end to the nearly two-year long stalemate. Notably, the governor and house speaker have not participated in the negotiations so far. The proposed plan includes an income tax increase to 4.99% from the current flat 3.75% rate. This and other revenue measures would generate nearly $5 billion in new revenue, much needed to address the state’s significant operating deficit. The proposal also authorizes $7 billion in new short-term borrowing to begin paying down the state’s backlog of bills, now estimated at nearly $11 billion. Importantly, the plan also includes some reforms Governor Rauner has insisted be addressed before he’ll agree to a budget or any new revenue increases. Senate leaders have included modest pension reforms, some term limits and government consolidation under the plan. Linking reforms with a new budget is something Democratic lawmakers have resisted until now. Including reforms now may be viewed as progress, but there is still much to be resolved. The package of bills should be considered before month end in the Senate, but their fate in the House is uncertain. CHICAGO PUBLIC SCHOOLS. A state budget compromise could prove to be critical for Chicago Board of Education as well. Chicago Public Schools’ FY17 budget relied on $215 million in new support from the state to offset the district’s $720 million scheduled teacher pension contribution due in June. Lawmakers approved this funding last year, 6
Fourth Quarter 2016
IF THE LEGISLATION IS NOT ENACTED, Chicago may revert to making lower contributions based on the current statutory funding formula, a practice that places the plans on track to become insolvent in about a decade.
Municipal Market: Technicals Override Solid Fundamentals
but Governor Rauner vetoed the bill in late December citing inadequate progress on broader, statewide pension reform. The veto leaves the school district with a $215 million hole in the approximately $6 billion operating budget.
Fourth Quarter 2016
Several recent reform proposals have been discussed, but they require agreement from at least 65% employees and eventually action by the state legislature. We expect several of these proposals to be addressed during the state legislative session from January 10 until Memorial Day.
Chicago Board of Education (CBOE) officials recently announced plans to implement four unpaid furlough days to save $35 million and have indicated they’ll address the remaining budget gap at their next board meeting in late January. If new state funding for CPS is approved, any cuts implemented could be reversed. The district plans to do a refunding deal sometime in FY17. Addressing the budget gap will be important to bolstering market confidence ahead of the bond sale. CBOE sold $750 million in new capital improvement tax bonds late last year. The new bonds benefit from a dedicated tax levy for capital projects and the security structure was well received.
While Dallas’ pension problems represent a significant credit risk, this must be weighed against the city’s diverse local economy, large tax base, favorable reserves and balanced general fund operations. NEW JERSEY. Due to various budget pressures and pension funding challenges, S&P downgraded New Jersey’s rating to A- with a negative outlook in November 2016, cementing New Jersey’s rank as the second lowest-rated state after Illinois. Recent and upcoming changes to New Jersey’s tax rates will add to budget troubles. In January 2017, the sales tax declined from 7% to 6.875% and it will be further reduced in January 2018 to 6.625%. Additionally, the estate tax will be phased out over two years and certain changes to income tax exemptions will be phased in. The impact on the current budget will actually be mildly positive, but these actions will reduce the state’s operating revenues significantly in the long run.
DALLAS. The city of Dallas made recent headlines regarding its pension obligations, particularly its police and fire fund. The mayor warned that the dire situation could cause the city to file for bankruptcy. The current level of plan assets is concerning, but we think the near-term chances of a bankruptcy filing are remote. A municipality must meet certain criteria to file for bankruptcy, and the city lacks at least two: it is not insolvent and is has not made a good faith effort to negotiate with creditors.
The state has estimated that its general fund will receive $1 billion less in revenues due to the reduction by FY21. This will complicate Governor Christie’s pension funding plan to increase payments by 1/10 of the actuarially required contribution each year. In FY17, the budget includes a $1.9 billion contribution, equal to 4/10 of the total payment. Reduced operating revenues over the next few years will endanger the plan of fully funding pension payments by FY23. Future revenues will likely be necessary to continue making progress with pension funding.
The primary drivers of pension underfunding are poor investment returns and a gratuitous Deferred Retirement Option Plan (DROP). Dallas’ Police and Fire DROP Plan participants were guaranteed a return between 8% and 10% on funds deposited into the DROP account. The plan invested heavily in private equity and real estate; these investments performed poorly and caused billions in write-downs of plan assets.
Careful Analysis Benefits Municipals
With plan liabilities growing and assets falling from poor investment returns, worried participants began making massive withdrawals from DROP plans. These withdrawals created a run on the bank, further depleting plan assets. The pension fund board voted at the beginning of December to temporarily halt withdrawals from DROP accounts, then voted at the end of December to allow only automatic monthly withdrawals, meaning no large withdrawals are currently permitted. Temporarily halting any further withdrawals stops the immediate bleed, but significant pension reform legislation must be enacted to the put the fund on a path toward longterm solvency.
The fourth quarter of 2016 opened up compelling valuations for longer-term municipal bond investors. The 30-year municipalto-Treasury ratio returned to 100%, which has historically indicated an attractive entry point. We have seen significant credit spread widening in the absence of defaults (outside of Puerto Rico) or credit deterioration, again highlighting the technical nature of the sell-off. Much of the rationale for municipal redemptions appears to be heavily based on the political environment, with the market presuming that President Trump’s proposals will be easily passed 7
Municipal Market: Technicals Override Solid Fundamentals
in full. The 2017 policy environment bears watching more than ever, given that major fiscal shifts may significantly affect municipal bond performance. Perhaps overlooked is the fact that the Republican Party is diverse, and legislation passed and eventually implemented in 2017 and 2018 could differ significantly from recent statements
Fourth Quarter 2016
and outlines. On the policy front, we believe that broad-brush statements will slowly be incorporated into more detailed pieces of legislation. When it comes to tax cuts, tax reforms, fiscal stimulus and infrastructure programs, the realities of today’s U.S. budget could scale back some of the more dramatic statements. An elongated legislative process with a greater dose of realism should bode well for municipal bonds in 2017. ▪
For more information, please consult with your financial advisor and visit nuveen.com.
Gross Domestic Product: U.S. Department of Commerce Treasury Yields and Ratios: Bloomberg (subscription required) Municipal Bond Yields: Municipal Market Data ICI Fund Flows: http://www.ici.org/research/stats Municipal Issuance: Seibert Research Defaults: Industry Overview, Municipals Mid Year Review, Bank of America/Merrill Lynch Research, January 29, 2016. State Revenues: The Nelson A. Rockefeller Institute of Government, State Revenue Report, November 2016. State Budget Reserves: Pew Charitable Trust. Global Growth: International Monetary Fund (IMF) and the Organisation for Economic Co-operation and Development (OECD) Standard & Poor’s and Investortools: http://www.invtools.com/ Flow of Funds, The Federal Reserve Board: http://www.federalreserve.gov/releases/Z1/Current/z1.pdf Payroll Data: Bureau of Labor Statistics Bond Ratings: Standard & Poor’s, Moody’s, Fitch
RISKS AND OTHER IMPORTANT CONSIDERATIONS
This report provides general information only. The analysis contained herein is based on the data available at the time of publication. This information represents the opinion of Nuveen Asset Management, LLC and is not intended to be a forecast of future events and this is no guarantee of any future result. Information was obtained from third party sources which we believe to be reliable but are not guaranteed as to their accuracy or completeness. Information is current or relevant as of the date indicated and such information may become outdated or otherwise superseded at any time without notice. This analysis is based on numerous assumptions. Different assumptions could result in materially different outcomes. This report should not be regarded by the recipients as a substitute for the exercise of their own judgment. All investments carry a certain degree of risk and there is no assurance that an investment will provide positive performance over any period of time. Investing in municipal bonds involves risks such as interest rate risk, credit risk and market risk, including the possible loss of principal. The value of the portfolio will fluctuate based on the value of the underlying securities. There are special risks associated with investments in high yield bonds, hedging activities and the potential use of leverage. Portfolios that include lower rated municipal bonds, commonly referred to as “high yield” or “junk” bonds, which are considered to be speculative, the credit and investment risk is heightened for the portfolio. Bond insurance guarantees only the payment of principal and interest on the bond when due, and not the value of the bonds
DEFINITIONS
The Municipal Market Data AAA scales are compilations of the previous day’s actual trades for AAA-rated insured bonds. The personal consumption expenditures (PCE) deflator indicates the average increase in prices for all domestic personal consumption. One basis point equals .01%, or 100 basis points equal 1%. This material is not intended to be a recommendation or investment advice, does not constitute a solicitation to buy or sell securities, and is not provided in a fiduciary capacity. The information provided does not take into account the specific objectives or circumstances of any particular investor, or suggest any specific course of action. Investment decisions should be made based on an investor’s objectives and circumstances and in consultation with his or her advisors.
themselves, which will fluctuate with the bond market and the financial success of the issuer and the insurer. No representation is made as to an insurers ability to meet their commitments. This information should not replace an investor’s consultation with a professional advisor regarding their tax situation. Nuveen Asset Management is not a tax advisor. Investors should contact a tax advisor regarding the suitability of tax-exempt investments in their portfolio. If sold prior to maturity, municipal securities are subject to gain/losses based on the level of interest rates, market conditions and the credit quality of the issuer. Income may be subject to the alternative minimum tax (AMT) and/or state and local taxes, based on the state of residence. Income from municipal bonds held by a portfolio could be declared taxable because of unfavorable changes in tax laws, adverse interpretations by the Internal Revenue Service or state tax authorities, or noncompliant conduct of a bond issuer. It is important to review your investment objectives, risk tolerance and liquidity needs before choosing an investment style or manager. CFA® and Chartered Financial Analyst ® are registered trademarks owned by CFA Institute. Nuveen Asset Management, LLC is a registered investment adviser and an affiliate of Nuveen Investments, Inc. © 2017 Nuveen Investments, Inc. All rights reserved.
Nuveen Investments | 333 West Wacker Drive | Chicago, IL 60606 | 800.752.8700 | nuveen.com
GPE-MNMKT-1216D 22643-INV-Q-04/17
SOURCES
New Money Project Financing: The Bond Buyer Consumer Price Index: http://www.bls.gov/cpi/ http://research.stlouisfed.org/fred2/series/CPIAUCNS U.S. Dollar: http://research.stlouisfed.org/fred2/series/DEXUSEU Puerto Rico: The Bond Buyer Illinois: The Bond Buyer Chicago: The Bond Buyer Chicago Public Schools: The Bond Buyer